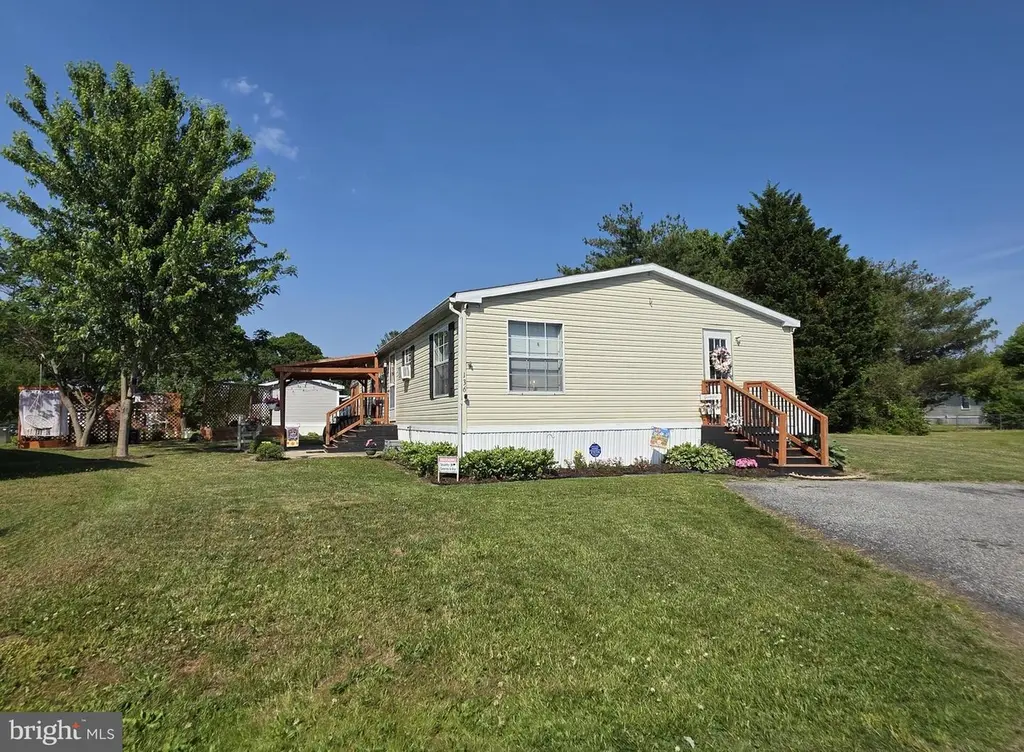
136 Sewan Cir #136 · Dover, DE
Flood risk 4/10 · Minor
- FEMA flood zone
- X (unshaded)
- Chance of flooding over 30 yrs
- 0.24%
- Est. flood insurance / yr
- $507 – $1,088
Fire risk 1/10 · Minimal
- Est. fire insurance / yr
- $476 – $884
Heat risk 8/10 · Major
- Hot days now (above 101°F)
- 7 days/yr
- Hot days in 30 yrs
- 16 days/yr
Wind risk 8/10 · Major
- Chance of severe wind over 30 yrs
- 80.0%
Air-quality risk 2/10 · Minimal
- Unhealthy air days now
- 1 days/yr
- Unhealthy air days in 30 yrs
- 2 days/yr
Risk factors via First Street. Map © Google.
Why this score? — see what drove the B- grade
The composite is a weighted blend of 9 inputs, each scored 0–100. Each bar is that input's sub-score; the figure is the points it added to the 100-point composite (weight × sub-score).
- Cash flow +30.0/30.0
- 1% rule +10.0/10.0
- DSCR +10.0/10.0
- ARV discount +7.5/15.0
- Condition / age +4.0/5.0
- Livability +3.4/5.0
- Rent growth +3.0/5.0
- Schools +2.0/10.0
- Appreciation +0.0/10.0
$90,000
🖨 Deal sheet 📄 Offer letter ✓ Due diligence
Listing remarks
Welcome home to your well loved 3 bedroom 2 full bath home situated on a prime lot with an outdoor space you will fall in love with! Plenty of space to garden or just enjoy the shade. Inside the home, you'll find an impressive kitchen with a center island, excellent cabinet space, quality appliances - to include a smooth top range and hood vent, wall oven and dishwasher. This eat in kitchen includes ample space for a dining table to gather and enjoy your meals. The primary bedroom includes a walk in closet and ensuite bathroom with a stall shower, soaking tub, dual vanity and linen cabinet. Your private space is separated from the guest bedrooms by spacious living room that features a styli
Key facts
- Wall oven
- Quality appliances
- Smooth top range
Tags
Property features AI
Finance
- Other: Not in a federal flood zone; Annual taxes and assessments recorded (details not included per instructions)
- Financial info: Ground rent exists; paid annually; Monthly land lease payment of $526; 1 year of lease remaining; Property manager present
Exterior
- Parking: Driveway parking; Two driveway spaces; Two total garage/parking spaces
- Utilities: Public sewer; Community water; Municipal trash service
- Home design: Modular/Manufactured construction; Shingle roof; Land lease ownership; Very good condition; Estimated year built (assessor source)
- Construction: Modular/Manufactured construction; Shingle roof; Shed on property
- Exterior features: Patio(s); Shed; Above-grade and below-grade structures
Interior
- Kitchen: Kitchen island; Table space in kitchen
- Bedrooms: Three bedrooms on the main level
- Flooring: Carpet; Vinyl
- Bathrooms: Two full bathrooms on the main level
- Heating & cooling: Forced air heating; Window cooling units (electric); Propane (leased) heating fuel; Electric hot water
- Interior features: Stall shower; Tub with shower; Soaking tub; Built-in shelving/units; Ceiling fan(s); Combination kitchen and dining area; Kitchen island; Kitchen table space; Window treatments; Paneled walls
- Laundry & utility: Main floor laundry
Neighborhood map
What this means for you Summary
Snapshot
- This is a 3-bed/2.0-bath single-family listed at $90k. Condition is rated good.
Deal economics
- At list price, monthly cash flow is $919 ($11k/yr) — positive.
- The deal already cash-flows at list — no discount required.
- Meets the 1% rule at list price ($2k rent vs $90k).
- Recommended offer: $89k (1.5% below list) — sets the bar for market timing.
- Cap rate 18.5% vs local median 5.2% in Dover — top-decile yield for the area; either an underpriced asset or a hidden risk that comps aren't pricing in. Stress-test before assuming the spread holds.
Location & tenants
- Location reads 67/100 on livability (#38 in DE) — a middle-class / working-renter tenant base. Strengths: amenities A+, cost of living A+, housing A+; Watch: crime F, commute F, employment D-.
- Capital School District (urban): math 14% / reading 31% proficiency, ranked #24 of 26 in DE (top 92%) — low school quality limits family demand, transient renter base, plan for 1-2y turnover.
- Zoned schools: Dover High School (math 21% / reading 45%, grade F, #22 of 40 statewide, top 56%, 1,771 students, 0% FRL) — zoned schools average 0% FRL vs 56% district-wide (56 pts lower); this property's tenant base skews higher-income than the district average.
- Market conditions: Rents rising (+2.0%/yr); 184 active listings in the ZIP; 6 comparable units currently listed for rent nearby; rentals lingering (median 44d on market — plan ~5-8 weeks vacancy on turnover, expect pricing pressure); 100% of comp listings sitting > 30 days — soft ceiling on asking rent; 1,201 units permitted in Kent County in 2024 (116 in 5+ unit buildings).
- This rent runs 35% of the median local income ($66k/yr) — at the standard rent-burdened threshold; future hikes will face affordability resistance.
Forward outlook
- Local home prices are declining (-3.0%/yr); year-one equity from $622 of loan paydown is wiped out by about $3k of value loss. Plan a longer hold.
- Kent County population projected at +22% by 2050 — long-run rental-demand tailwind backs the buy-and-hold thesis.
- At projected returns (-3.0% appreciation + 2.0% rent growth), your $25k cash investment doubles in ~3 years — after that, you're playing with house money.
Negotiation context
- It's been on market 29 days — a 2% lower offer ($89k) is reasonable based on typical stale-listing flexibility.
Risks & watch-outs
- Climate carrying-cost: severe wind risk, 80% chance of damaging wind over 30y; extreme-heat days projected 7→16/yr by 2055 (HVAC capex compounding) — expect insurance premiums to compound above CPI over the hold.
Questions for the listing agent
- Is there a deadline driving the sale (1031 exchange, divorce, estate, relocation)? That informs how much negotiation room exists.
- Crime grade is F in this area — have there been break-ins, vandalism, or insurance claims at this property in the last 3 years? What carrier currently insures it and at what premium?
- What's the average days-on-market for RENTAL listings here right now (not sales)? A rising rental-DOM trend means longer vacancies and softer asking-rent achievability than the comps imply.
- What's the recent tenant-quality profile in this submarket — average credit score on applications, eviction rate, late-payment / NSF rate, and stable-employment percentage? A property-management company in the area should have these aggregated.
- How much new for-sale + rental construction is in the pipeline within 1–3 miles? Heavy new supply typically softens prices + rents 12–24 months out; constrained supply supports both.
Investment metrics
- 1% rule
- 2.17% ✓
- Cap rate
- 18.54%
- Cash-on-cash
- 43.75%
- DSCR
- 2.95
- GRM
- 3.8
CMA / ARV
- ARV (on-the-fly)
- $309,744
- Comps found
- 12
Show comp detail 12 sales within ~0.75 mi
| Address | Dist | Beds/Ba | Sqft | Sold | Price | $/sf | Match |
|---|---|---|---|---|---|---|---|
| 1061 S Little Creek Rd #143 | 0.11mi | 3/2.0 | 1,456 (+12%) | 11mo | $100,000 | $69 | 65 |
| 711 Marta Dr | 0.30mi | 3/2.0 | 1,374 (+6%) | 20mo | $350,000 | $255 | 60 |
| 1401 S Hancock Ave | 0.65mi | 3/2.0 | 1,344 (+4%) | 5mo | $324,900 | $242 | 59 |
| 315 Bluecoat St | 0.35mi | 3/2.0 | 1,357 (+5%) | 20mo | $340,000 | $251 | 58 |
| 1061 S Little Creek Rd #46 | 0.11mi | 3/2.0 | 1,120 (-14%) | 23mo | $52,000 | $46 | 53 |
| 1422 S Hancock Ave | 0.64mi | 3/2.0 | 1,320 (+2%) | 17mo | $315,000 | $239 | 52 |
| 20 Moriarty St | 0.24mi | 3/2.0 | 1,472 (+14%) | 22mo | $304,000 | $207 | 48 |
| 1680 N Little Creek Rd | 0.51mi | 3/2.0 | 1,456 (+12%) | 13mo | $290,500 | $200 | 45 |
| 708 Marta Dr | 0.31mi | 3/2.5 | 1,470 (+13%) | 20mo | $335,000 | $228 | 45 |
| 273 Acorn Ln | 0.68mi | 4/2.0 (+1) | 1,170 (-10%) | 6mo | $349,000 | $298 | 42 |
| 505 Roberta Ave | 0.38mi | 3/1.5 | 1,130 (-13%) | 21mo | $280,000 | $248 | 41 |
| 846 E Loockerman St | 0.56mi | 4/1.5 (+1) | 1,402 (+8%) | 17mo | $315,000 | $225 | 39 |
Match score weights: distance 35% · size 25% · config 20% · recency 20%. Top-matched comps best support the ARV.
Projected returns pro-forma
-3.0% appreciation · 2.03% rent growth · sell at horizon
- IRR
- 39.6%
- Equity multiple
- 2.67×
- Total profit
- $42,075
- Equity at exit
- $13,419
- IRR
- 45.5%
- Equity multiple
- 5.15×
- Total profit
- $104,519
- Equity at exit
- $7,782
Cash invested: $25,200 (down + closing). Projections, not guarantees.
Landlord ↔ Tenant lean methodology
- Overall (STATE)
- 70 Landlord-Friendly
- State Delaware
- 70 Landlord-Friendly · D+7
- County
- — inherits STATE
- City
- — inherits STATE
ZIP-level market 19901
- Rents YoY
- 2.0%
- Active inventory
- 184
- Price-to-rent
- 3.8×
Monthly cashflow live
- Estimated rent
- $1,950 high interval (Pro) →
- Mortgage (P&I)
- −$472
- Tax est. 1.5%
- −$112 /mo · $1,350/yr
- Insurance
- −$38
- HOA
- −$0
- Vacancy / Maint / Mgmt
- −$410
- Net cashflow
- $919
Break-even live
UW: 25.0% down · 7.5% · 30yr · 1.5% tax · 5.0% vac · 8.0% maint · 8.0% mgmt
Financing live
Cash to close
- Down payment
- $22,500
- Closing costs
- $2,700
- Reserves months
- —
- Total cash needed
- —
Loan-product check · same deal, 3 products live
Conventional
25% down · 7.5% · 30yr
- Down + closing
- —
- Monthly P&I
- —
- Monthly cashflow
- —
- DSCR
- —
- Eligible?
- —
Personal DTI + credit; lowest rate.
DSCR
20% down · 8.5% · 30yr
- Down + closing
- —
- Monthly P&I
- —
- Monthly cashflow
- —
- DSCR
- —
- Eligible?
- —
No personal income docs; deal must DSCR.
Hard money
10% down · 12.0% · 12mo
- Down + closing
- —
- Monthly P&I
- —
- Monthly cashflow
- —
- DSCR
- —
- Eligible?
- —
Short-term bridge; refi at stabilization.
Rent comps 6 comps
| Address | Beds | Baths | Sqft | Rent | $/sqft | DOM | Units | Dist |
|---|---|---|---|---|---|---|---|---|
| 205 Fairfax Ln Dover, DE | 3.0 | 2.5 | 1428 | $1,975 | $1.38 | 43d | 1 | 0.25mi |
| 203 Fairfax Ln Dover, DE | 3.0 | 2.5 | 1428 | $1,975 | $1.38 | 43d | 1 | 0.25mi |
| 480 Country Dr Dover, DE | 3.0 | 1.0–2.0 | 715 | $1,875 | $2.62 | 43d | 22 | 0.43mi |
| 177 Willis Rd Dover, DE | 1.0–2.0 | 1.0 | 851 | $1,605 | $1.88 | 43d | 27 | 0.89mi |
| 814 New Castle Ave Dover, DE | 3.0 | 1.0 | 950 | $1,650 | $1.74 | 43d | 1 | 1.11mi |
| 820 Carvel Dr Dover, DE | 1.0–2.0 | 1.0–1.5 | 782 | $1,435 | $1.83 | 43d | 12 | 1.37mi |
Listing history 16 events
-
2026-06-19days on market $90,000 Active 29 DOM
-
2026-06-18days on market $90,000 Active 28 DOM
-
2026-06-17days on market $90,000 Active 27 DOM
-
2026-06-16days on market $90,000 Active 26 DOM
-
2026-06-15days on market $90,000 Active 25 DOM
-
2026-06-14days on market $90,000 Active 23 DOM
-
2026-06-13days on market $90,000 Active 22 DOM
-
2026-06-10days on market $90,000 Active 20 DOM
-
2026-06-09days on market $90,000 Active 19 DOM
-
2026-06-08days on market $90,000 Active 18 DOM
-
2026-06-07days on market $90,000 Active 17 DOM
-
2026-06-02days on market $90,000 Active 12 DOM
-
2026-06-01days on market $90,000 Active 11 DOM
-
2026-05-31days on market $90,000 Active 10 DOM
-
2026-05-30days on market $90,000 Active 9 DOM
-
2026-05-21$90,000 Active
ⓘ Source: listings_history table (triggers on properties + properties_extension) + one-shot
backfill from property_details.listing_events for pre-trigger history.
Climate risk First Street
- Flood 4/10 Moderate FEMA zone X (unshaded) · 24% chance over 30 yrs
- Wildfire 1/10 Low
- Heat 8/10 Severe 7 d/yr ≥101°F today · 16 d/yr by 30 yrs out
- Wind 8/10 Severe 80% chance of damaging wind over 30 yrs
- Air quality 2/10 Low 1 unhealthy d/yr today · 2 by 30 yrs out
Nearby sold comps map
Loading sold comps map…
Walkable amenities ~0.75 mi
Loading nearby amenities…
Taxation est. · year 1
- Rental income
- $23,403
- − Mortgage interest
- −$5,041
- − Property taxes
- −$1,350
- − Insurance
- −$450
- − Repairs & maintenance
- −$1,872
- − Management
- −$1,872
- − Depreciation
- −$2,618
- Taxable income
- $10,199
- Est. tax owed @ 24.0%
- −$2,448
- After-tax cash flow
- $8,577/yr
For passive investors: Depreciation is non-cash, so a rental often shows a tax loss while cash-flowing — sheltering income. Rental losses are passive: they offset passive income freely, and up to $25,000/yr can offset ordinary (W-2) income if you actively participate and your MAGI is under $100k (phasing out to $0 by $150k); unused losses carry forward. On sale, claimed depreciation is recaptured at up to 25%, and gains may owe capital-gains tax (a 1031 exchange can defer both). Figures are a year-1 estimate at your 24.0% rate — not tax advice; consult a CPA.
Condition & rehab AI · 30 photos
This home is in good condition with a well-maintained exterior and interior. It has a good curb appeal and is move-in ready. However, there are some minor updates that can further increase its value, such as painting the exterior siding and cleaning the gutters.
Value-add opportunities
- Resale Paint the exterior siding — Painting the exterior siding can enhance the home's curb appeal and increase its resale value.
- Resale Clean the gutters — Clean gutters can prevent water damage and improve the home's overall appearance.
- Both Replace the outdoor furniture — Replacing the outdoor furniture can improve the home's curb appeal and increase its rental value.
- Both Install a new outdoor lighting system — A new outdoor lighting system can improve the home's curb appeal and increase its rental value.
- Both Install a new roof — If the roof is in poor condition, replacing it can improve the home's overall appearance and increase its resale and rental value. However, this is not necessary based on the photos provided.
Renovation cost estimate screening
Value-add ROI direction
- Resale Paint the exterior siding — Painting the exterior siding can enhance the home's curb appeal and increase its resale value. ↑
- Resale Clean the gutters — Clean gutters can prevent water damage and improve the home's overall appearance. ↑
- Both Replace the outdoor furniture — Replacing the outdoor furniture can improve the home's curb appeal and increase its rental value. ↑
- Both Install a new outdoor lighting system — A new outdoor lighting system can improve the home's curb appeal and increase its rental value. ↑
- Both Install a new roof — If the roof is in poor condition, replacing it can improve the home's overall appearance and increase its resale and rental value. However, this is not necessary based on the photos provided. ↑
ⓘ Cost ranges are severity-bucket heuristics (US national rule-of-thumb). Get contractor quotes + a written scope before underwriting a rehab budget.
Schools (NCES district)
- District
- Capital School District
- NCES district ID
- 1000190
- Math proficiency
- 14% ▼ -17.00%
- Reading proficiency
- 31% ▼ -12.00%
- Median HH income
- $48,499
- Composite
- 19.78/100
- National rank
- #8703
- State rank
- #24 of 26 in DE
Livability — Dover
- Score
- 67/100
- State rank
- #38
- US rank
- #10574
Category grades
Schools grade is shown separately in the Schools card above.
Census & demographics
- Census place
- Dover, DE
- County
- Kent County · 82,184 people
- City population
- 76,581
- Metro
- Dover, DE
- Population (ZIP)
- 37,763
- Household income
- $66,388
- Rent vs Own
- Severe rent burden
- 1320.0
Population outlook (Kent County) Hauer SSP2
- Today (2025)
- 194,477 people
- By 2030
- 204,351 · +5.1%
- By 2040
- 222,135 · +14.2%
- By 2050
- 236,483 · +21.6%
- By 2075
- 266,327 · +36.9%
- By 2100
- 275,335 · +41.6%
Race, ethnicity, and origin ACS 2023
- Neighborhood character
- Diverse neighborhood (Simpson 0.68)
- Race & ethnicity
- White 44% Black 34% Hispanic / Latino 13% Two or more races 11% Asian 2%
- Hispanic origin (detail)
- Mexican 3% Puerto Rican 6%
- Common ancestry
- Romanian 2% Hispanic 1% Lithuanian 1%
- Foreign-born
- 7% · Canada, South Korea
- Languages at home
- 88% English-only · Spanish 7% French/Haitian/Cajun 1% Other Asian/Pacific 1%
Political lean MEDSL · Kent
- 2024 margin
- Toss-up / Even · D 50.2% · R 48.2% · Other 1.7%
- 2008→2024 swing
- -7.8pp toward R · 2008: 9.8pp · 2024: 2.0pp
- All cycles
- 2024: D+2.0 2020: D+4.1 2016: R+4.9 2012: D+4.9 2008: D+9.8
Not yet ingested
- Civics
- —
Market trends
- HPI YoY
- ▼ -113.29%
- Current HPI
- 199.5132
- Rent YoY
- ▲ 2.03%
- Metro
- Dover, DE
- State GDP YoY
- —
- F500 in state
- 0
Price history
1 event — show timeline
- 2026-05-21 Listed $90,000 BRIGHT MLS
Cash-flow waterfall
monthlySold comps — $/sqft
last 12 mo · ≤1 miLoading sold comps…