1000 W Main St #45 · West Jefferson, OH
Flood risk 1/10 · Minimal
- FEMA flood zone
- X (unshaded)
- Chance of flooding over 30 yrs
- 0.0%
- Est. flood insurance / yr
- $507 – $1,088
Fire risk 1/10 · Minimal
- Est. fire insurance / yr
- $713 – $1,323
Heat risk 3/10 · Minor
- Hot days now (above 100°F)
- 7 days/yr
- Hot days in 30 yrs
- 18 days/yr
Wind risk 2/10 · Minimal
- Chance of severe wind over 30 yrs
- 1.0%
Air-quality risk 2/10 · Minimal
- Unhealthy air days now
- 1 days/yr
- Unhealthy air days in 30 yrs
- 3 days/yr
Risk factors via First Street. Map © Google.
Why this score? — see what drove the B grade
The composite is a weighted blend of 9 inputs, each scored 0–100. Each bar is that input's sub-score; the figure is the points it added to the 100-point composite (weight × sub-score).
- Cash flow +30.0/30.0
- 1% rule +10.0/10.0
- DSCR +10.0/10.0
- ARV discount +7.5/15.0
- Schools +4.7/10.0
- Livability +3.4/5.0
- Rent growth +2.5/5.0
- Condition / age +2.2/5.0
- Appreciation +0.0/10.0
$39,000
🖨 Deal sheet (PDF) 📄 Offer letter ✓ Due diligence
Listing remarks MLS
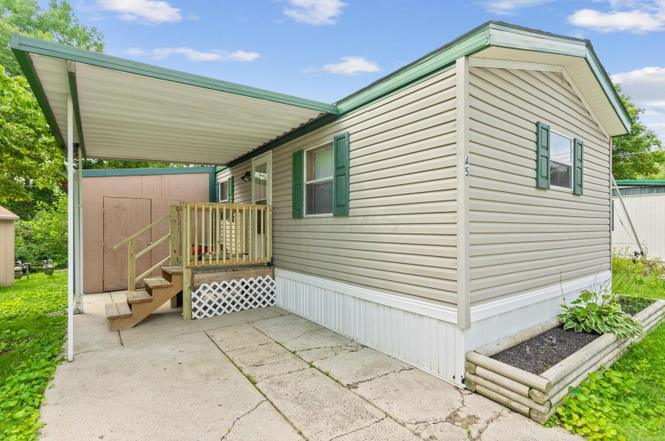
THIS 2 BEDRROOM HOME HAS BEEN RENOVATED WITH BEAUTIFUL KITCHEN CABINETS AND GRANITE COUNTER TOPS. NEW LVP FLOORING IN KITCHEN AND LIVING ROOM. BOTH BATHROOMS HAVE BEEN UPDATED WITH NEW VANIETIES AND FLOORING. SHED IS A DREAM WITH BENCHES AND A/C. THIS HOME IS READY FOR A NEW OWNER. NEW FULLY APPLIANCED KITCHEN AND OPEN FLOORPLAN.
Key facts
- Open floor plan
- New carpet
- Laundry room
Tags
Property features AI
Exterior
- Parking: On-street parking
- Utilities: Public water; Public sewer
- Home design: Single-family home; One story; Built in 1997; No shared/common walls
- Construction: Agent-provided building area approximately 1,064; Built in 1997
- Exterior features: Other foundation
Interior
- Bedrooms: Two main-level bedrooms
- Bathrooms: Two full bathrooms
- Heating & cooling: Central air conditioning; Forced-air heating
- Interior features: Living area approximately 980
Neighborhood map
What this means for you Summary
Snapshot
- This is a 2-bed/2.0-bath manufactured listed at $39k. Condition is rated fair.
Deal economics
- At list price, monthly cash flow is $929 ($11k/yr) — positive.
- The deal already cash-flows at list — no discount required.
- Meets the 1% rule at list price ($2k rent vs $39k).
- Recommended offer: $38k (3.0% below list) — sets the bar for market timing.
- Cap rate 34.9% vs local median 3.5% in West Jefferson — top-decile yield for the area; either an underpriced asset or a hidden risk that comps aren't pricing in. Stress-test before assuming the spread holds.
Location & tenants
- Location reads 68/100 on livability (#558 in OH) — a middle-class / working-renter tenant base. Strengths: crime A+, cost of living A+, housing A+; Watch: amenities F, commute F, health & safety F.
- Jefferson Local (town): math 55% / reading 54% proficiency, ranked #361 of 656 in OH (top 55%) — acceptable for families but not a draw, mixed tenant base, ~2y average lease.
- Zoned schools: Norwood Elementary School (math 73% / reading 65%, grade A-, #431 of 1,584 statewide, top 27%, 437 students, 42% FRL); West Jefferson Middle School (math 44% / reading 42%, grade D-, #489 of 654 statewide, top 75%, 254 students, 0% FRL); West Jefferson High School (math 37% / reading 62%, grade D, #390 of 781 statewide, top 54%, 296 students, 70% FRL) — zoned schools at 37% FRL track the district average.
- Market conditions: 25 active listings in the ZIP; 1 comparable units currently listed for rent nearby; solid renter incomes; 530 units permitted in Madison County in 2024 (120 in 5+ unit buildings).
Forward outlook
- Local home prices are declining (-3.0%/yr); year-one equity from $270 of loan paydown is wiped out by about $1k of value loss. Plan a longer hold.
- Madison County population projected at +4% by 2050 — modest demand growth; plan on rents tracking national, not racing it.
- At projected returns (-3.0% appreciation + 3.0% rent growth), your $11k cash investment doubles in ~2 years — after that, you're playing with house money.
Negotiation context
- It's been on market 46 days — a 3% lower offer ($38k) is reasonable based on typical stale-listing flexibility.
- 3 sale attempts since 5y ago with the ask held roughly flat each time — persistent listings suggest the price (not the market) is what's stuck; bring a comps-based counter.
- Current owner paid $27k; 44% above their basis — modest negotiation headroom, anchor on the comps not their cost.
Questions for the listing agent
- It's been on market 46 days. Have you received any prior offers? Is the seller open to a 3% concession, seller financing, or rate buy-down credit?
- Have any recent inspections been done? Can we get a copy of the seller's disclosures and any deferred-maintenance estimates?
- Is there a deadline driving the sale (1031 exchange, divorce, estate, relocation)? That informs how much negotiation room exists.
- What's the average days-on-market for RENTAL listings here right now (not sales)? A rising rental-DOM trend means longer vacancies and softer asking-rent achievability than the comps imply.
- What's the recent tenant-quality profile in this submarket — average credit score on applications, eviction rate, late-payment / NSF rate, and stable-employment percentage? A property-management company in the area should have these aggregated.
- How much new for-sale + rental construction is in the pipeline within 1–3 miles? Heavy new supply typically softens prices + rents 12–24 months out; constrained supply supports both.
Investment metrics
- 1% rule
- 3.89% ✓
- Cap rate
- 34.88%
- Cash-on-cash
- 102.09%
- DSCR
- 5.54
- GRM
- 2.1
CMA / ARV
- ARV (median comp)
- $214,646
- List price
- $39,000
- Delta
- -81.83%
- Verdict
- UNDERPRICED
- Comps
- 20 within 1.0 mi
Projected returns pro-forma
-3.0% appreciation · 3.0% rent growth · sell at horizon
- IRR
- —
- Equity multiple
- 5.84×
- Total profit
- $52,870
- Equity at exit
- $5,815
- IRR
- —
- Equity multiple
- 12.20×
- Total profit
- $122,319
- Equity at exit
- $3,372
Cash invested: $10,920 (down + closing). Projections, not guarantees.
Landlord ↔ Tenant lean methodology
- Overall (STATE)
- 73 Landlord-Friendly
- State Ohio
- 73 Landlord-Friendly · R+6
- County
- — inherits STATE
- City
- — inherits STATE
ZIP-level market 43162
- Home prices YoY
- -27.1%
- Active inventory
- 25
- Price-to-rent
- 2.1×
Monthly cashflow live
- Estimated rent
- $1,517 medium interval (Pro) →
- Mortgage (P&I)
- −$205
- Tax est. 1.5%
- −$49 /mo · $585/yr
- Insurance
- −$16
- HOA
- −$0
- Vacancy / Maint / Mgmt
- −$319
- Net cashflow
- $929
Break-even live
Sensitivity live
| Price | -10% $956 | -5% $942 | +0% $929 | +5% $916 | +10% $902 |
|---|---|---|---|---|---|
| Rent | -10% $809 | -5% $869 | +0% $929 | +5% $989 | +10% $1,049 |
| Rate | -1.0pp $949 | -0.5pp $939 | base $929 | +0.5pp $919 | +1.0pp $909 |
UW: 25.0% down · 7.5% · 30yr · 1.5% tax · 5.0% vac · 8.0% maint · 8.0% mgmt
Financing live
Cash to close
- Down payment
- $9,750
- Closing costs
- $1,170
- Reserves months
- —
- Total cash needed
- —
Loan-product check · same deal, 3 products live
Conventional
25% down · 7.5% · 30yr
- Down + closing
- —
- Monthly P&I
- —
- Monthly cashflow
- —
- DSCR
- —
- Eligible?
- —
Personal DTI + credit; lowest rate.
DSCR
20% down · 8.5% · 30yr
- Down + closing
- —
- Monthly P&I
- —
- Monthly cashflow
- —
- DSCR
- —
- Eligible?
- —
No personal income docs; deal must DSCR.
Hard money
10% down · 12.0% · 12mo
- Down + closing
- —
- Monthly P&I
- —
- Monthly cashflow
- —
- DSCR
- —
- Eligible?
- —
Short-term bridge; refi at stabilization.
Rent comps 1 comps
| Address | Beds | Baths | Sqft | Rent | $/sqft | DOM | Units | Dist |
|---|---|---|---|---|---|---|---|---|
| 168 Lincoln St West Jefferson, OH | 2.0 | 1.0 | 804 | $1,050 | $1.31 | 22d | 1 | 1.22mi |
Listing history 20 events
-
2026-06-21days on market $39,000 Active 46 DOM
-
2026-06-18days on market $39,000 Active 43 DOM
-
2026-06-17days on market $39,000 Active 42 DOM
-
2026-06-16days on market $39,000 Active 41 DOM
-
2026-06-16status $39,000 Active 40 DOM
-
2026-06-15days on market $39,000 Contingent 40 DOM
-
2026-06-13days on market $39,000 Contingent 38 DOM
-
2026-06-13days on market $39,000 Contingent 37 DOM
-
2026-06-09days on market $39,000 Contingent 34 DOM
-
2026-06-08days on market $39,000 Contingent 33 DOM
-
2026-06-07days on market $39,000 Contingent 32 DOM
-
2026-06-05days on market $39,000 Contingent 29 DOM
-
2026-06-03days on market $39,000 Contingent 28 DOM
-
2026-06-02days on market $39,000 Contingent 27 DOM
-
2026-06-01days on market $39,000 Contingent 26 DOM
-
2026-05-31days on market $39,000 Contingent 25 DOM
-
2026-05-06$39,000 Active 381-char remark
-
2021-08-23soldstatus $27,000 Closed 331-char remark
Show marketing remark (331 chars)
THIS 2 BEDRROOM HOME HAS BEEN RENOVATED WITH BEAUTIFUL KITCHEN CABINETS AND GRANITE COUNTER TOPS. NEW LVP FLOORING IN KITCHEN AND LIVING ROOM. BOTH BATHROOMS HAVE BEEN UPDATED WITH NEW VANIETIES AND FLOORING. SHED IS A DREAM WITH BENCHES AND A/C. THIS HOME IS READY FOR A NEW OWNER. NEW FULLY APPLIANCED KITCHEN AND OPEN FLOORPLAN.
-
2021-08-20status Pending 331-char remark
Show marketing remark (331 chars)
THIS 2 BEDRROOM HOME HAS BEEN RENOVATED WITH BEAUTIFUL KITCHEN CABINETS AND GRANITE COUNTER TOPS. NEW LVP FLOORING IN KITCHEN AND LIVING ROOM. BOTH BATHROOMS HAVE BEEN UPDATED WITH NEW VANIETIES AND FLOORING. SHED IS A DREAM WITH BENCHES AND A/C. THIS HOME IS READY FOR A NEW OWNER. NEW FULLY APPLIANCED KITCHEN AND OPEN FLOORPLAN.
-
2021-08-13$26,000 Active 331-char remark
Show marketing remark (331 chars)
THIS 2 BEDRROOM HOME HAS BEEN RENOVATED WITH BEAUTIFUL KITCHEN CABINETS AND GRANITE COUNTER TOPS. NEW LVP FLOORING IN KITCHEN AND LIVING ROOM. BOTH BATHROOMS HAVE BEEN UPDATED WITH NEW VANIETIES AND FLOORING. SHED IS A DREAM WITH BENCHES AND A/C. THIS HOME IS READY FOR A NEW OWNER. NEW FULLY APPLIANCED KITCHEN AND OPEN FLOORPLAN.
ⓘ Source: listings_history table (triggers on properties + properties_extension) + one-shot
backfill from property_details.listing_events for pre-trigger history.
Climate risk First Street
- Flood 1/10 Low FEMA zone X (unshaded) · 0% chance over 30 yrs
- Wildfire 1/10 Low
- Heat 3/10 Moderate 7 d/yr ≥100°F today · 18 d/yr by 30 yrs out
- Wind 2/10 Low 100% chance of damaging wind over 30 yrs
- Air quality 2/10 Low 1 unhealthy d/yr today · 3 by 30 yrs out
Nearby sold comps map
Loading sold comps map…
Walkable amenities ~0.75 mi
Loading nearby amenities…
Taxation est. · year 1
- Rental income
- $18,205
- − Mortgage interest
- −$2,185
- − Property taxes
- −$585
- − Insurance
- −$195
- − Repairs & maintenance
- −$1,456
- − Management
- −$1,456
- − Depreciation
- −$1,135
- Taxable income
- $11,193
- Est. tax owed @ 24.0%
- −$2,686
- After-tax cash flow
- $8,461/yr
For passive investors: Depreciation is non-cash, so a rental often shows a tax loss while cash-flowing — sheltering income. Rental losses are passive: they offset passive income freely, and up to $25,000/yr can offset ordinary (W-2) income if you actively participate and your MAGI is under $100k (phasing out to $0 by $150k); unused losses carry forward. On sale, claimed depreciation is recaptured at up to 25%, and gains may owe capital-gains tax (a 1031 exchange can defer both). Figures are a year-1 estimate at your 24.0% rate — not tax advice; consult a CPA.
Condition & rehab AI · 9 photos
A moderately rehabbed mobile home with good interior and exterior conditions, but some minor repairs and maintenance needed. Paint and flooring updates would significantly increase its value.
Repairs flagged
- Minor Deck — Slight wear
- Minor Siding — Slight wear
Value-add opportunities
- Both Paint exterior — Enhances curb appeal and value
- Both Replace carpet with hardwood — Improves aesthetics and value
- Both Replace countertops — Modernizes kitchen and adds value
Renovation cost estimate screening
| Repair item | Severity | Est. cost |
|---|---|---|
| Deck · Slight wear | Minor | $500–3,000 |
| Siding · Slight wear | Minor | $500–3,000 |
| Total estimated repair cost · 2 items | $1,000–6,000 |
Value-add ROI direction
- Both Paint exterior — Enhances curb appeal and value ↑
- Both Replace carpet with hardwood — Improves aesthetics and value ↑
- Both Replace countertops — Modernizes kitchen and adds value ↑
ⓘ Cost ranges are severity-bucket heuristics (US national rule-of-thumb). Get contractor quotes + a written scope before underwriting a rehab budget.
Schools (NCES district)
- District
- Jefferson Local
- NCES district ID
- 3904825
- Math proficiency
- 55% ▼ -20.00%
- Reading proficiency
- 54% ▼ -8.00%
- Median HH income
- $56,405
- Composite
- 47.14/100
- National rank
- #2326
- State rank
- #361 of 656 in OH
Livability — West Jefferson
- Score
- 68/100
- State rank
- #558
- US rank
- #9519
Category grades
Schools grade is shown separately in the Schools card above.
Census & demographics
- County
- Madison County · 6,896 people
- City population
- 6,896
- Metro
- Columbus, OH
- Population (ZIP)
- 6,896
- Household income
- $76,250
- Rent vs Own
- Severe rent burden
- 53.0
Population outlook (Madison County) Hauer SSP2
- Today (2025)
- 46,050 people
- By 2030
- 46,826 · +1.7%
- By 2040
- 47,941 · +4.1%
- By 2050
- 47,919 · +4.1%
- By 2075
- 46,160 · +0.2%
- By 2100
- 38,584 · -16.2%
Race, ethnicity, and origin ACS 2023
- Neighborhood character
- Predominantly White (93%)
- Race & ethnicity
- White 93% Two or more races 6% Hispanic / Latino 3%
- Common ancestry
- Iranian 3% Slovak 2% Italian 1%
- Foreign-born
- 0%
- Languages at home
- 98% English-only · Spanish 1% German/W. Germanic 1%
Political lean MEDSL · Madison
- 2024 margin
- Solid R (+43.7) · D 27.6% · R 71.3% · Other 1.1%
- 2008→2024 swing
- -20.3pp toward R · 2008: -23.4pp · 2024: -43.7pp
- All cycles
- 2024: R+43.7 2020: R+41.0 2016: R+39.7 2012: R+20.4 2008: R+23.4
Not yet ingested
- Civics
- —
Market trends
- HPI YoY
- ▼ -98.47%
- Current HPI
- 264.9361
- Rent YoY
- —
- Metro
- Columbus, OH
- State GDP YoY
- ▲ 1.98%
- F500 in state
- 48
Industry mix (Fortune 500 HQ in OH)
| Industry | F500 HQs | Revenue |
|---|---|---|
| Insurance | 3 | $145B |
|
||
| Industrial Machinery | 3 | $49B |
|
||
| Financial Services | 3 | $24B |
|
||
| Consumer Goods | 2 | $93B |
|
||
| Aerospace / Defense | 2 | $47B |
|
||
| Utilities | 2 | $33B |
|
||
Price history
+50.0% since first listed6 events — show timeline
- 2026-06-15 Relisted — CBRMLS
- 2026-05-29 Contingent — CBRMLS
- 2026-05-06 Listed $39,000 CBRMLS
- 2021-08-23 Sold (MLS) $27,000 CBRMLS
- 2021-08-20 Pending — CBRMLS
- 2021-08-13 Listed $26,000 CBRMLS
Cash-flow waterfall
monthlySold comps — $/sqft
last 12 mo · ≤1 miLoading sold comps…