 Duplex
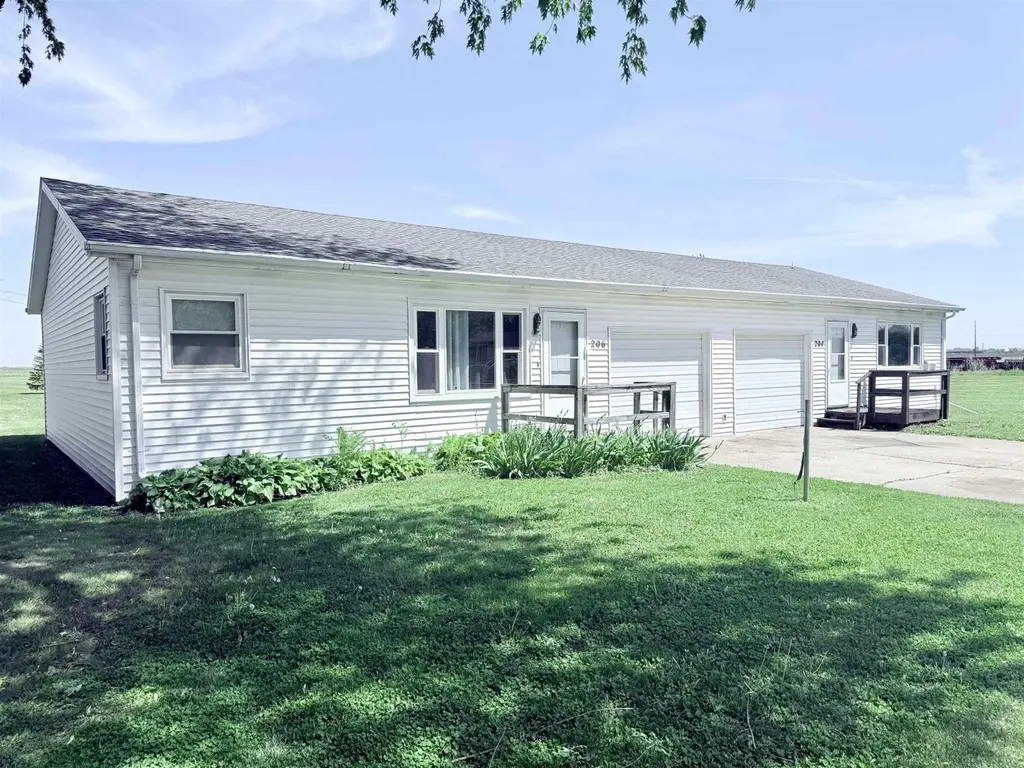
204-206 E Elm St · Iowa Falls, IA
Flood risk 1/10 · Minimal
- FEMA flood zone
- X (unshaded)
- Chance of flooding over 30 yrs
- 0.0%
- Est. flood insurance / yr
- $507 – $1,088
Fire risk 3/10 · Minor
- Est. fire insurance / yr
- $902 – $1,676
Heat risk 2/10 · Minimal
- Hot days now (above 102°F)
- 7 days/yr
- Hot days in 30 yrs
- 15 days/yr
Wind risk 2/10 · Minimal
- Chance of severe wind over 30 yrs
- —
Air-quality risk 1/10 · Minimal
- Unhealthy air days now
- 0 days/yr
- Unhealthy air days in 30 yrs
- 0 days/yr
Risk factors via First Street. Map © Google.
Why this score? — see what drove the C+ grade
The composite is a weighted blend of 9 inputs, each scored 0–100. Each bar is that input's sub-score; the figure is the points it added to the 100-point composite (weight × sub-score).
- Cash flow +26.5/30.0
- DSCR +9.0/10.0
- 1% rule +7.1/10.0
- Schools +5.6/10.0
- ARV discount +4.3/15.0
- Livability +3.9/5.0
- Condition / age +3.8/5.0
- Rent growth +2.5/5.0
- Appreciation +0.0/10.0
$160,000
🖨 Deal sheet 📄 Offer letter ✓ Due diligence
Multi-family units
County records classify this as Multi-Family (2-4 Unit). Listing-text estimate: 2 units. confirmed
Listing remarks MLS
Great investment property on the edge of town! Ranch home with no basement, east side is 336 square feet larger than the west side. Laundry is off the garage. Nice layout with full bath in between two bedrooms. Each side has a fireplace in living room for ambiance only. The east side has new flooring in most rooms, new outlets, paint, tiling around the fireplace, new light fixtures, vanity in bathroom and new central air.
Key facts
- 0.27 acre lot
- 2 garage spots
- Built 1980
Property features AI
Finance
- Other: Zoning: R-1
- Financial info: Property type: Residential income; Actual rent: one unit at $700, another unit at $825
- HOA & community: (No HOA or community details provided)
Exterior
- Parking: Attached garage spaces: 2 total (one garage space per unit); 4 open paved parking spaces; Attached paved garage
- Security: (No security features provided)
- Utilities: Public water; Public sewer
- Home design: Residential income property (duplex)
- Construction: Vinyl siding; Asphalt roof; (Above-grade finished living area reported)
- Exterior features: Level lot; Lot dimensions approximately 121 x 44 x 142 x 142
Interior
- Kitchen: (No specific kitchen appliance details provided)
- Bedrooms: Two 2-bedroom units
- Flooring: (No flooring details provided)
- Bathrooms: Two 1-bath units
- Heating & cooling: Natural gas heating; Central air conditioning
- Interior features: Basement: none
- Laundry & utility: Laundry located in hall/laundry closet on main level
Neighborhood map
What this means for you Summary
Snapshot
- This is a 2 × 2-bed/1.0-bath units multifamily listed at $160k. Condition is rated good.
Deal economics
- At list price, monthly cash flow is $423 ($5k/yr) — positive. Per door: $211/mo.
- The deal already cash-flows at list — no discount required.
- Meets the 1% rule at list price ($2k rent vs $160k).
- Recommended offer: $155k (3.0% below list) — sets the bar for market timing.
- Cap rate 9.5% vs local median 3.8% in Iowa Falls — top-decile yield for the area; either an underpriced asset or a hidden risk that comps aren't pricing in. Stress-test before assuming the spread holds.
Location & tenants
- Location reads 77/100 on livability (#172 in IA, #3,097 nationally) — a middle-class / working-renter tenant base. Strengths: cost of living A+, housing A+, health & safety A+; Watch: employment D, amenities F, commute F.
- Iowa Falls Community School District (town): math 62% / reading 71% proficiency, ranked #184 of 289 in IA (top 64%) — acceptable for families but not a draw, mixed tenant base, ~2y average lease.
- Zoned schools: Iowa Falls - Alden High School (math 60% / reading 78%, grade B, #176 of 336 statewide, top 53%, 412 students, 35% FRL) — zoned schools at 35% FRL track the district average.
- Market conditions: 90 active listings in the ZIP; 6 units permitted in Hardin County in 2024 (0 in 5+ unit buildings).
Forward outlook
- Local home prices are declining (-3.0%/yr); year-one equity from $1k of loan paydown is wiped out by about $5k of value loss. Plan a longer hold.
- Hardin County population projected to shrink 6% by 2050 — rents likely to lag national; underwrite the cash flow, not the appreciation.
- At projected returns (-3.0% appreciation + 3.0% rent growth), your $45k cash investment doubles in ~10 years — after that, you're playing with house money.
Negotiation context
- It's been on market 35 days — a 3% lower offer ($155k) is reasonable based on typical stale-listing flexibility.
- 2 sale attempts since 4y ago with the ask held roughly flat each time — persistent listings suggest the price (not the market) is what's stuck; bring a comps-based counter.
Questions for the listing agent
- It's been on market 35 days. Have you received any prior offers? Is the seller open to a 3% concession, seller financing, or rate buy-down credit?
- Can we see the unit-by-unit rent roll, current vacancy, and any below-market leases? What's the average tenancy length?
- What capital expenditures (roof, boiler, parking lot, exteriors) have been made in the last 5 years, and what's planned in the next 2?
- Is there a deadline driving the sale (1031 exchange, divorce, estate, relocation)? That informs how much negotiation room exists.
- Schools are B-rated — typically a magnet for longer-tenancy family renters. What's the average tenant stay here, and is there a school-zone premium baked into asking?
- What's the average days-on-market for RENTAL listings here right now (not sales)? A rising rental-DOM trend means longer vacancies and softer asking-rent achievability than the comps imply.
- What's the recent tenant-quality profile in this submarket — average credit score on applications, eviction rate, late-payment / NSF rate, and stable-employment percentage? A property-management company in the area should have these aggregated.
- How much new apartment / multifamily construction is in the pipeline within 1–3 miles? Heavy new supply (>2% of stock underway) typically softens rents 12–24 months out; light construction supports rent growth.
Investment metrics
- 1% rule
- 1.21% ✓
- Cap rate
- 9.46%
- Cash-on-cash
- 11.33%
- DSCR
- 1.50
- GRM
- 6.9
CMA / ARV
- ARV (median comp)
- $149,273
- List price
- $160,000
- Delta
- 7.19%
- Verdict
- FAIR
- Comps
- 5 within 1.0 mi
Projected returns pro-forma
-3.0% appreciation · 3.0% rent growth · sell at horizon
- IRR
- 0.6%
- Equity multiple
- 1.02×
- Total profit
- $1,039
- Equity at exit
- $23,857
- IRR
- 10.3%
- Equity multiple
- 1.80×
- Total profit
- $35,708
- Equity at exit
- $13,834
Cash invested: $44,800 (down + closing). Projections, not guarantees.
Landlord ↔ Tenant lean methodology
- Overall (STATE)
- 83 Strongly Landlord-Friendly
- State Iowa
- 83 Strongly Landlord-Friendly · R+6
- County
- — inherits STATE
- City
- — inherits STATE
ZIP-level market 50126
- Active inventory
- 90
- Price-to-rent
- 13.8×
Monthly cashflow live
- Estimated rent
- $1,935 medium interval (Pro) →
- Mortgage (P&I)
- −$839
- Tax est. 1.5%
- −$200 /mo · $2,400/yr
- Insurance
- −$67
- HOA
- −$0
- Vacancy / Maint / Mgmt
- −$406
- Net cashflow
- $423
Break-even live
2-unit breakdown (identical units grouped — click to expand)
| Units | Beds | Baths | Est. rent |
|---|---|---|---|
| 2× units | 2 | 1 | $1,934 |
| #1 | 2 | 1 | $967 |
| #2 | 2 | 1 | $967 |
| Total (2 units) | $1,935 | ||
UW: 25.0% down · 7.5% · 30yr · 1.5% tax · 5.0% vac · 8.0% maint · 8.0% mgmt
Financing live
Cash to close
- Down payment
- $40,000
- Closing costs
- $4,800
- Reserves months
- —
- Total cash needed
- —
Loan-product check · same deal, 3 products live
Conventional
25% down · 7.5% · 30yr
- Down + closing
- —
- Monthly P&I
- —
- Monthly cashflow
- —
- DSCR
- —
- Eligible?
- —
Personal DTI + credit; lowest rate.
DSCR
20% down · 8.5% · 30yr
- Down + closing
- —
- Monthly P&I
- —
- Monthly cashflow
- —
- DSCR
- —
- Eligible?
- —
No personal income docs; deal must DSCR.
Hard money
10% down · 12.0% · 12mo
- Down + closing
- —
- Monthly P&I
- —
- Monthly cashflow
- —
- DSCR
- —
- Eligible?
- —
Short-term bridge; refi at stabilization.
Listing history 19 events
-
2026-06-18days on market $160,000 Active 35 DOM
-
2026-06-17days on market $160,000 Active 34 DOM
-
2026-06-16days on market $160,000 Active 33 DOM
-
2026-06-15days on market $160,000 Active 32 DOM
-
2026-06-13days on market $160,000 Active 30 DOM
-
2026-06-12days on market $160,000 Active 29 DOM
-
2026-06-09days on market $160,000 Active 26 DOM
-
2026-06-08days on market $160,000 Active 25 DOM
-
2026-06-07days on market $160,000 Active 24 DOM
-
2026-06-07days on market $160,000 Active 23 DOM
-
2026-06-04days on market $160,000 Active 20 DOM
-
2026-06-02days on market $160,000 Active 19 DOM
-
2026-06-01days on market $160,000 Active 18 DOM
-
2026-05-31days on market $160,000 Active 17 DOM
-
2026-05-31days on market $160,000 Active 16 DOM
-
2026-05-14$160,000 Active 732-char remark
-
2023-01-18soldstatus $140,500 Closed 425-char remark
Show marketing remark (425 chars)
Great investment property on the edge of town! Ranch home with no basement, east side is 336 square feet larger than the west side. Laundry is off the garage. Nice layout with full bath in between two bedrooms. Each side has a fireplace in living room for ambiance only. The east side has new flooring in most rooms, new outlets, paint, tiling around the fireplace, new light fixtures, vanity in bathroom and new central air.
-
2022-12-05status Pending 425-char remark
Show marketing remark (425 chars)
Great investment property on the edge of town! Ranch home with no basement, east side is 336 square feet larger than the west side. Laundry is off the garage. Nice layout with full bath in between two bedrooms. Each side has a fireplace in living room for ambiance only. The east side has new flooring in most rooms, new outlets, paint, tiling around the fireplace, new light fixtures, vanity in bathroom and new central air.
-
2022-11-29$140,000 Active 425-char remark
Show marketing remark (425 chars)
Great investment property on the edge of town! Ranch home with no basement, east side is 336 square feet larger than the west side. Laundry is off the garage. Nice layout with full bath in between two bedrooms. Each side has a fireplace in living room for ambiance only. The east side has new flooring in most rooms, new outlets, paint, tiling around the fireplace, new light fixtures, vanity in bathroom and new central air.
ⓘ Source: listings_history table (triggers on properties + properties_extension) + one-shot
backfill from property_details.listing_events for pre-trigger history.
Climate risk First Street
- Flood 1/10 Low FEMA zone X (unshaded) · 0% chance over 30 yrs
- Wildfire 3/10 Moderate
- Heat 2/10 Low 7 d/yr ≥102°F today · 15 d/yr by 30 yrs out
- Wind 2/10 Low
- Air quality 1/10 Low 0 unhealthy d/yr today · 0 by 30 yrs out
Nearby sold comps map
Loading sold comps map…
Walkable amenities ~0.75 mi
Loading nearby amenities…
Taxation est. · year 1
- Rental income
- $23,220
- − Mortgage interest
- −$8,962
- − Property taxes
- −$2,400
- − Insurance
- −$800
- − Repairs & maintenance
- −$1,858
- − Management
- −$1,858
- − Depreciation
- −$4,655
- Taxable income
- $2,688
- Est. tax owed @ 24.0%
- −$645
- After-tax cash flow
- $4,430/yr
For passive investors: Depreciation is non-cash, so a rental often shows a tax loss while cash-flowing — sheltering income. Rental losses are passive: they offset passive income freely, and up to $25,000/yr can offset ordinary (W-2) income if you actively participate and your MAGI is under $100k (phasing out to $0 by $150k); unused losses carry forward. On sale, claimed depreciation is recaptured at up to 25%, and gains may owe capital-gains tax (a 1031 exchange can defer both). Figures are a year-1 estimate at your 24.0% rate — not tax advice; consult a CPA.
Condition & rehab AI · 12 photos
This well-maintained and updated duplex is ready for new tenants or investors. It offers a good investment opportunity with minimal repairs needed.
Value-add opportunities
- Both Paint exterior siding — Fresh paint enhances curb appeal and can increase both resale and rental value.
- Both Replace damaged windows — New windows improve energy efficiency and can increase both resale and rental value.
Renovation cost estimate screening
Value-add ROI direction
- Both Paint exterior siding — Fresh paint enhances curb appeal and can increase both resale and rental value. ↑
- Both Replace damaged windows — New windows improve energy efficiency and can increase both resale and rental value. ↑
ⓘ Cost ranges are severity-bucket heuristics (US national rule-of-thumb). Get contractor quotes + a written scope before underwriting a rehab budget.
Schools (NCES district)
- District
- Iowa Falls Community School District
- NCES district ID
- 1914730
- Math proficiency
- 62% ▼ -9.00%
- Reading proficiency
- 71% ▼ -5.00%
- Median HH income
- $46,696
- Composite
- 56.12/100
- National rank
- #1182
- State rank
- #184 of 289 in IA
Livability — Iowa Falls
- Score
- 77/100
- State rank
- #172
- US rank
- #3097
Category grades
Schools grade is shown separately in the Schools card above.
Census & demographics
- Census place
- Iowa Falls, IA
- City population
- 6,362
- Population (ZIP)
- 6,362
Population outlook (Hardin County) Hauer SSP2
- Today (2025)
- 17,474 people
- By 2030
- 17,369 · -0.6%
- By 2040
- 17,018 · -2.6%
- By 2050
- 16,454 · -5.8%
- By 2075
- 14,665 · -16.1%
- By 2100
- 12,404 · -29.0%
Race, ethnicity, and origin ACS 2023
- Neighborhood character
- Predominantly White (90%)
- Race & ethnicity
- White 90% Hispanic / Latino 7% Two or more races 2% Black 2%
- Hispanic origin (detail)
- Mexican 5% Puerto Rican 1%
- Common ancestry
- Portuguese 6% Iranian 3% Lithuanian 2%
- Foreign-born
- 3% · Canada
- Languages at home
- 94% English-only · Spanish 5%
Political lean MEDSL · Hardin
- 2024 margin
- Solid R (+38.4) · D 30.3% · R 68.7% · Other 1.1%
- 2008→2024 swing
- -39.3pp toward R · 2008: 0.9pp · 2024: -38.4pp
- All cycles
- 2024: R+38.4 2020: R+32.0 2016: R+29.2 2012: R+7.1 2008: D+0.9
Not yet ingested
- Civics
- —
Market trends
- HPI YoY
- ▼ -87.54%
- Current HPI
- 146.3741
- Rent YoY
- —
- Metro
- —
- State GDP YoY
- ▲ 2.48%
- F500 in state
- 4
Industry mix (Fortune 500 HQ in IA)
| Industry | F500 HQs | Revenue |
|---|---|---|
| Financial Services | 1 | $16B |
|
||
| Retail / Convenience | 1 | $15B |
|
||
Price history
+14.3% since first listed4 events — show timeline
- 2026-05-14 Listed $160,000 NEIRBR as distributed by MLS GRID
- 2023-01-18 Sold (MLS) $140,500 IAR
- 2022-12-05 Pending — IAR
- 2022-11-29 Listed $140,000 IAR
Cash-flow waterfall
monthlySold comps — $/sqft
last 12 mo · ≤1 miLoading sold comps…