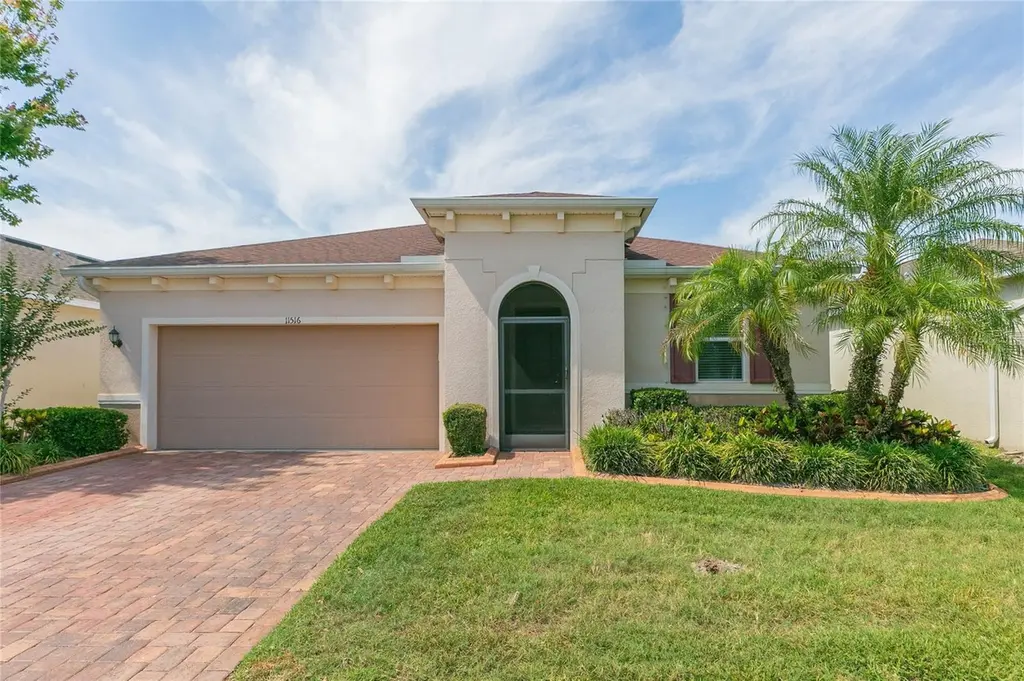
11516 Luckygem Dr · Riverview, FL
Flood risk 1/10 · Minimal
- FEMA flood zone
- X (unshaded)
- Chance of flooding over 30 yrs
- 0.0%
- Est. flood insurance / yr
- $507 – $1,088
Fire risk 5/10 · Moderate
- Est. fire insurance / yr
- $947 – $1,759
Heat risk 10/10 · Severe
- Hot days now (above 109°F)
- 7 days/yr
- Hot days in 30 yrs
- 28 days/yr
Wind risk 9/10 · Severe
- Chance of severe wind over 30 yrs
- 99.0%
Air-quality risk 3/10 · Minor
- Unhealthy air days now
- 3 days/yr
- Unhealthy air days in 30 yrs
- 3 days/yr
Risk factors via First Street. Map © Google.
Why this score? — see what drove the D- grade
The composite is a weighted blend of 9 inputs, each scored 0–100. Each bar is that input's sub-score; the figure is the points it added to the 100-point composite (weight × sub-score).
- Cash flow +9.0/30.0
- ARV discount +7.5/15.0
- Appreciation +4.3/10.0
- Schools +4.2/10.0
- Livability +4.0/5.0
- 1% rule +2.9/10.0
- Rent growth +2.8/5.0
- DSCR +2.5/10.0
- Condition / age +2.5/5.0
$369,000
🖨 Deal sheet 📄 Offer letter ✓ Due diligence
Listing remarks
Under contract-accepting backup offers. This 4-bedroom, 2-bath home sits on a desirable POND lot in the South Fork community! Featuring an open floorplan, the home is enhanced by tile flooring throughout, creating a seamless and cohesive feel. Large glass sliders fill the living space with natural light and provide easy indoor-outdoor living. The backyard oasis is complete with a fully fenced yard and a screened-in lanai, where plenty of time will be spent enjoying the peaceful water views. The kitchen features granite countertops with wrap around breakfast bar for seating, stainless steel appliances, recess lighting, and pantry. The primary bedroom is a true retreat with views of the pond,
Key facts
- Large glass sliders
- Open floorplan
- Screened-in lanai
Tags
Property features AI
Finance
- Other: Unfurnished; Direction faces south
- Financial info: CDD present; Lease restrictions apply
- HOA & community: HOA: South Fork - First Service Residential; HOA required with annual fee of $150 (monthly equivalent $12.50); Association approval required; HOA includes pool; Community features: deed restrictions, dog park, playground, pool; Pets allowed
Exterior
- Parking: Attached 2-car garage (20 x 19) with garage door opener; Driveway
- Utilities: Public water; Public sewer; Cable available; Broadband/high-speed internet available; Electricity connected
- Home design: Single family residence; One story; South-facing; Located on waterfront (pond)
- Construction: Block and stucco construction; Shingle roof; Slab foundation; Built area and living area per public records
- Exterior features: Covered rear porch; Screened porch; Sliding doors; Exterior lighting; Vinyl fencing; Pond frontage and pond view; Landscaped with trees; Paved road access
Interior
- Kitchen: Dishwasher; Microwave; Range; Refrigerator
- Bedrooms: 4 bedrooms
- Flooring: Tile
- Bathrooms: 2 full bathrooms
- Heating & cooling: Central heating; Central air conditioning
- Interior features: Ceiling fans; Kitchen/family room combo; Living room/dining room combo; Open floorplan; Walk-in closets
- Laundry & utility: Laundry room inside
Neighborhood map
What this means for you Summary
Snapshot
- This is a 4-bed/2.0-bath single-family listed at $369k.
Deal economics
- At list price, monthly cash flow is $-293 ($-4k/yr) — negative.
- To cash-flow at today's rent, offer at most $317k (14.0% below list).
- To meet the 1% rule (rent ≥ 1% of price), the offer needs to be $293k (20.7% below list).
- Recommended offer: $293k (20.7% below list) — sets the bar for 1% rule.
Location & tenants
- Location reads 79/100 on livability (#134 in FL, #2,000 nationally) — a middle-class / working-renter tenant base. Strengths: housing A+, health & safety A+, employment B+; Watch: amenities F.
- Hillsborough (suburban): math 47% / reading 50% proficiency, ranked #41 of 73 in FL (top 56%) — families likely to look elsewhere, expect single-tenant / working-renter base with shorter leases.
- Zoned schools: Summerfield Crossings Elementary School (math 43% / reading 45%, grade F, #1,330 of 2,144 statewide, top 63%, 869 students, 53% FRL); Jule F Sumner High School (math 43% / reading 43%, grade F, #255 of 667 statewide, top 39%, 3,827 students, 43% FRL) — zoned schools at 48% FRL track the district average.
- Market conditions: Rents rising (+1.2%/yr); 457 active listings in the ZIP; 40 comparable units currently listed for rent nearby; rentals at typical pace (median 15d on market — plan ~3-4 weeks tenant-placement turnaround); high-income renter base; 9,053 units permitted in Hillsborough County in 2024 (4,555 in 5+ unit buildings).
- This rent runs 30% of the median local income ($116k/yr) — at the standard rent-burdened threshold; future hikes will face affordability resistance.
Forward outlook
- Local home prices are declining (-1.4%/yr); year-one equity from $3k of loan paydown is wiped out by about $5k of value loss. Plan a longer hold.
- Hillsborough County population projected at +37% by 2050 — long-run rental-demand tailwind backs the buy-and-hold thesis.
Negotiation context
- Only 10 days on market — expect competitive offers; lowballing is unlikely to land.
Risks & watch-outs
- Climate carrying-cost: severe wind risk, 99% chance of damaging wind over 30y; moderate wildfire risk; extreme-heat days projected 7→28/yr by 2055 (HVAC capex compounding) — expect insurance premiums to compound above CPI over the hold.
Questions for the listing agent
- What do current leases actually rent for vs. the listed asking? Can we see a recent rent roll and the last 12 months of T-12 income?
- What does the HOA fee cover, when was the last increase, and are there any pending special assessments or reserve-fund shortfalls?
- Is there a deadline driving the sale (1031 exchange, divorce, estate, relocation)? That informs how much negotiation room exists.
- Schools are B-rated — typically a magnet for longer-tenancy family renters. What's the average tenant stay here, and is there a school-zone premium baked into asking?
- The area grade is low — what's the realistic commute time and amenity access for the typical tenant pool here? Any planned neighborhood developments (good or bad) we should know about?
- What's the average days-on-market for RENTAL listings here right now (not sales)? A rising rental-DOM trend means longer vacancies and softer asking-rent achievability than the comps imply.
- What's the recent tenant-quality profile in this submarket — average credit score on applications, eviction rate, late-payment / NSF rate, and stable-employment percentage? A property-management company in the area should have these aggregated.
- How much new for-sale + rental construction is in the pipeline within 1–3 miles? Heavy new supply typically softens prices + rents 12–24 months out; constrained supply supports both.
Investment metrics
- 1% rule
- 0.79% ✗
- Cap rate
- 5.34%
- Cash-on-cash
- -3.40%
- DSCR
- 0.85
- GRM
- 10.5
CMA / ARV
No comps found within radius.
Projected returns pro-forma
-1.42% appreciation · 1.18% rent growth · sell at horizon
- IRR
- -13.9%
- Equity multiple
- 0.43×
- Total profit
- $-58,590
- Equity at exit
- $81,672
- IRR
- -8.9%
- Equity multiple
- 0.30×
- Total profit
- $-72,534
- Equity at exit
- $79,605
Cash invested: $103,320 (down + closing). Projections, not guarantees.
Landlord ↔ Tenant lean methodology
- Overall (STATE)
- 87 Strongly Landlord-Friendly
- State Florida
- 87 Strongly Landlord-Friendly · R+3
- County
- — inherits STATE
- City
- — inherits STATE
ZIP-level market 33579
- Home prices YoY
- -0.6%
- Rents YoY
- 1.2%
- Active inventory
- 457
- Price-to-rent
- 10.5×
Monthly cashflow live
- Estimated rent
- $2,926 high interval (Pro) →
- Mortgage (P&I)
- −$1,935
- Tax from tax record
- −$504 /mo · $6,042/yr
- Insurance
- −$154
- HOA
- −$12
- Vacancy / Maint / Mgmt
- −$614
- Net cashflow
- $-293
Break-even live
UW: 25.0% down · 7.5% · 30yr · 1.5% tax · 5.0% vac · 8.0% maint · 8.0% mgmt
Financing live
Cash to close
- Down payment
- $92,250
- Closing costs
- $11,070
- Reserves months
- —
- Total cash needed
- —
Loan-product check · same deal, 3 products live
Conventional
25% down · 7.5% · 30yr
- Down + closing
- —
- Monthly P&I
- —
- Monthly cashflow
- —
- DSCR
- —
- Eligible?
- —
Personal DTI + credit; lowest rate.
DSCR
20% down · 8.5% · 30yr
- Down + closing
- —
- Monthly P&I
- —
- Monthly cashflow
- —
- DSCR
- —
- Eligible?
- —
No personal income docs; deal must DSCR.
Hard money
10% down · 12.0% · 12mo
- Down + closing
- —
- Monthly P&I
- —
- Monthly cashflow
- —
- DSCR
- —
- Eligible?
- —
Short-term bridge; refi at stabilization.
Rent comps 40 comps
| Address | Beds | Baths | Sqft | Rent | $/sqft | DOM | Units | Dist |
|---|---|---|---|---|---|---|---|---|
| 11514 Brighton Knoll Loop Riverview, FL | 3.0 | 2.5 | 2759 | $2,900 | $1.05 | 12d | 1 | 0.08mi |
| 13655 Artesa Bell Dr Riverview, FL | 4.0 | 3.0 | 2351 | $3,075 | $1.31 | 4d | 1 | 0.10mi |
| 11510 Harlan Eddy Ct Riverview, FL | 4.0 | 2.0 | 2351 | $2,700 | $1.15 | 24d | 1 | 0.21mi |
| 13465 Fladgate Mark Dr Riverview, FL | 4.0 | 2.0 | 1544 | $2,045 | $1.32 | 4d | 1 | 0.25mi |
| 11211 Flora Springs Dr Riverview, FL | 5.0 | 3.0 | 2320 | $2,723 | $1.17 | 23d | 1 | 0.31mi |
| 11618 Ashton Field Ave Riverview, FL | 4.0 | 3.0 | 2114 | $2,600 | $1.23 | 14d | 1 | 0.53mi |
| 11519 Misty Isle Ln Riverview, FL | 4.0 | 2.0 | 1936 | $2,600 | $1.34 | 24d | 1 | 0.62mi |
| 13423 Beechberry Dr Riverview, FL | 4.0 | 2.5 | 2322 | $2,800 | $1.21 | 2d | 1 | 0.63mi |
| 11716 Navajo Sandstone St Riverview, FL | 4.0 | 2.5 | 2450 | $2,900 | $1.18 | 4d | 1 | 0.69mi |
| 11328 Misty Isle Ln Riverview, FL | 4.0 | 3.5 | 2532 | $2,600 | $1.03 | 10d | 1 | 0.75mi |
| 13305 Silvercreek Dr Riverview, FL | 3.0 | 2.0 | 1743 | $2,099 | $1.20 | 4d | 1 | 0.78mi |
| 14207 Poke Ridge Dr Riverview, FL | 3.0 | 3.0 | 1897 | $2,350 | $1.24 | 23d | 1 | 0.79mi |
| 13625 Silver Charm Ct Riverview, FL | 4.0 | 2.5 | 1907 | $2,350 | $1.23 | 24d | 1 | 0.79mi |
| 11412 Misty Isle Ln Riverview, FL | 5.0 | 4.0 | 2523 | $3,200 | $1.27 | 24d | 1 | 0.80mi |
| 11164 Golden Silence Dr Riverview, FL | 3.0 | 2.0 | 1930 | $2,050 | $1.06 | 24d | 1 | 0.80mi |
| 14217 Poke Ridge Dr Riverview, FL | 3.0 | 2.5 | 1913 | $2,511 | $1.31 | 4d | 1 | 0.81mi |
| 11424 Misty Isle Ln Riverview, FL | 3.0 | 2.0 | 1839 | $2,165 | $1.18 | 12d | 1 | 0.84mi |
| 11176 Leland Groves Dr Riverview, FL | 4.0 | 2.5 | 2318 | $2,700 | $1.16 | 4d | 1 | 0.85mi |
| 11427 Misty Isle Ln Riverview, FL | 4.0 | 2.0 | 1916 | $2,310 | $1.21 | 4d | 1 | 0.87mi |
| 11167 Leland Groves Dr Riverview, FL | 5.0 | 3.0 | 2526 | $3,500 | $1.39 | 24d | 1 | 0.89mi |
| 13924 Arbor Pines Dr Riverview, FL | 4.0 | 2.5 | 1920 | $2,545 | $1.33 | 24d | 1 | 0.90mi |
| 13263 Evening Sunset Ln Riverview, FL | 4.0 | 2.0 | 1959 | $2,200 | $1.12 | 4d | 1 | 0.92mi |
| 11201 Hudson Hills Ln Riverview, FL | 5.0 | 2.5 | 2254 | $2,450 | $1.09 | 14d | 1 | 0.95mi |
| 11025 Golden Silence Dr Riverview, FL | 3.0 | 2.5 | 1785 | $2,210 | $1.24 | 13d | 1 | 0.95mi |
| 14153 Arbor Pines Dr Riverview, FL | 5.0 | 2.5 | 2889 | $3,586 | $1.24 | 24d | 1 | 0.97mi |
| 11009 Golden Silence Dr Riverview, FL | 4.0 | 2.5 | 2154 | $2,800 | $1.30 | 24d | 1 | 1.01mi |
| 11218 Scotchwood Dr Riverview, FL | 3.0 | 2.0 | 1546 | $2,150 | $1.39 | 14d | 1 | 1.08mi |
| 11838 Blackeyed Susan Dr Riverview, FL | 4.0 | 2.0 | 1816 | $2,800 | $1.54 | 20d | 1 | 1.13mi |
| 11025 Whittney Chase Dr Riverview, FL | 4.0 | 2.0 | 1544 | $2,235 | $1.45 | 2d | 1 | 1.17mi |
| 13204 Waterleaf Garden Cir Riverview, FL | 4.0 | 2.0 | 2046 | $3,600 | $1.76 | 4d | 1 | 1.18mi |
| 10925 Subtle Trail Dr Riverview, FL | 3.0 | 2.0 | 1716 | $2,000 | $1.17 | 24d | 1 | 1.19mi |
| 13515 Palmera Vista Dr Riverview, FL | 4.0 | 2.0 | 1850 | $3,800 | $2.05 | 17d | 1 | 1.21mi |
| 13515 Palmera Vista Dr Riverview, FL | 4.0 | 2.0 | 1832 | $3,600 | $1.97 | 4d | 1 | 1.21mi |
| 10805 Australian Pine Dr Riverview, FL | 3.0 | 2.0 | 1897 | $2,350 | $1.24 | 24d | 1 | 1.24mi |
| 11736 Dumaine Valley Rd Riverview, FL | 3.0 | 2.5 | 1670 | $2,000 | $1.20 | 14d | 1 | 1.27mi |
| 13456 Palmera Vista Dr Riverview, FL | 3.0 | 2.0 | 1752 | $2,500 | $1.43 | 17d | 1 | 1.29mi |
| 13016 Prestwick Dr Riverview, FL | 4.0 | 3.0 | 2506 | $3,500 | $1.40 | 24d | 1 | 1.32mi |
| 11810 Tetrafin Dr Riverview, FL | 4.0 | 2.0 | 2184 | $2,750 | $1.26 | 24d | 1 | 1.33mi |
| 11322 Torrey Pines Dr Riverview, FL | 4.0 | 2.0 | 2194 | $2,300 | $1.05 | 24d | 1 | 1.38mi |
| 10904 Summerton Dr Riverview, FL | 4.0 | 3.0 | 2977 | $3,150 | $1.06 | 3d | 1 | 1.42mi |
HOA detail
- Monthly dues
- $12 · $144/yr
- Likely covers
- water
Listing history 2 events
-
2026-05-17status Pending 1491-char remark
-
2026-05-06$369,000 Active 1491-char remark
ⓘ Source: listings_history table (triggers on properties + properties_extension) + one-shot
backfill from property_details.listing_events for pre-trigger history.
Tax reassessment forecast FL · Resets to sale price
- Current annual tax
- $6,042 · $504/mo
- Projected year-2 tax
- $6,042 · $504/mo
- Expected delta
- $0/yr ($0/mo · 0.0%)
ⓘ Screening estimate from a state-policy table — verify with the county assessor before closing.
Climate risk First Street
- Flood 1/10 Low FEMA zone X (unshaded) · 0% chance over 30 yrs
- Wildfire 5/10 Major
- Heat 10/10 Extreme 7 d/yr ≥109°F today · 28 d/yr by 30 yrs out
- Wind 9/10 Extreme 99% chance of damaging wind over 30 yrs
- Air quality 3/10 Moderate 3 unhealthy d/yr today · 3 by 30 yrs out
Nearby sold comps map
Loading sold comps map…
Walkable amenities ~0.75 mi
Loading nearby amenities…
Taxation est. · year 1
- Rental income
- $35,109
- − Mortgage interest
- −$20,670
- − Property taxes
- −$6,042
- − Insurance
- −$1,845
- − Repairs & maintenance
- −$2,809
- − Management
- −$2,809
- − HOA
- −$144
- − Depreciation
- −$10,735
- Taxable loss
- −$9,945
- Est. tax savings @ 24.0%
- +$2,387
- After-tax cash flow
- $-1,130/yr
For passive investors: Depreciation is non-cash, so a rental often shows a tax loss while cash-flowing — sheltering income. Rental losses are passive: they offset passive income freely, and up to $25,000/yr can offset ordinary (W-2) income if you actively participate and your MAGI is under $100k (phasing out to $0 by $150k); unused losses carry forward. On sale, claimed depreciation is recaptured at up to 25%, and gains may owe capital-gains tax (a 1031 exchange can defer both). Figures are a year-1 estimate at your 24.0% rate — not tax advice; consult a CPA.
Schools (NCES district)
- District
- Hillsborough
- NCES district ID
- 1200870
- Math proficiency
- 47% ▼ -8.00%
- Reading proficiency
- 50% ▼ -4.00%
- Median HH income
- $50,622
- Composite
- 41.6/100
- National rank
- #3435
- State rank
- #41 of 73 in FL
Livability — Riverview
- Score
- 79/100
- State rank
- #134
- US rank
- #2000
Category grades
Schools grade is shown separately in the Schools card above.
Census & demographics
- Census place
- Riverview, FL
- County
- Hillsborough County · 1,540,968 people
- City population
- 137,988
- Metro
- Tampa-St. Petersburg-Clearwater, FL
- Population (ZIP)
- 49,470
- Household income
- $116,134
- Rent vs Own
- Severe rent burden
- 258.0
Population outlook (Hillsborough County) Hauer SSP2
- Today (2025)
- 1,607,022 people
- By 2030
- 1,733,968 · +7.9%
- By 2040
- 1,979,565 · +23.2%
- By 2050
- 2,203,427 · +37.1%
- By 2075
- 2,667,893 · +66.0%
- By 2100
- 2,891,558 · +79.9%
Race, ethnicity, and origin ACS 2023
- Neighborhood character
- Highly diverse neighborhood (Simpson 0.71)
- Race & ethnicity
- White 42% Hispanic / Latino 25% Black 24% Two or more races 19% Asian 5%
- Hispanic origin (detail)
- Mexican 3% Puerto Rican 12% Cuban 3% Dominican 1%
- Common ancestry
- Hispanic 1% British 1% Romanian 1%
- Foreign-born
- 17% · Canada, Jamaica, China
- Languages at home
- 73% English-only · Spanish 19% Other Indo-European 2% French/Haitian/Cajun 1%
Political lean MEDSL · Hillsborough
- 2024 margin
- Toss-up / Even · D 47.8% · R 50.9% · Other 1.3%
- 2008→2024 swing
- -10.2pp toward R · 2008: 7.1pp · 2024: -3.1pp
- All cycles
- 2024: R+3.1 2020: D+6.9 2016: D+6.8 2012: D+6.7 2008: D+7.1
Not yet ingested
- Civics
- —
Market trends
- HPI YoY
- ▼ -1.42%
- Current HPI
- 240.5825
- Rent YoY
- ▲ 1.18%
- Metro
- Tampa-St. Petersburg-Clearwater, FL
- State GDP YoY
- ▲ 3.28%
- F500 in state
- 36
Industry mix (Fortune 500 HQ in FL)
| Industry | F500 HQs | Revenue |
|---|---|---|
| Industrial Technology | 2 | $29B |
|
||
| Insurance | 2 | $17B |
|
||
| Retail | 1 | $60B |
|
||
| Technology Distribution | 1 | $58B |
|
||
| Homebuilding | 1 | $35B |
|
||
| Technology Manufacturing | 1 | $35B |
|
||
Price history
2 events — show timeline
- 2026-05-17 Pending — Stellar MLS as Distributed by MLS Grid
- 2026-05-06 Listed $369,000 Stellar MLS as Distributed by MLS Grid
Property tax history
+9.9%/yrLatest (2025): $6,042 · +6.4% YoY. Source: county tax records.
Cash-flow waterfall
monthlySold comps — $/sqft
last 12 mo · ≤1 miLoading sold comps…