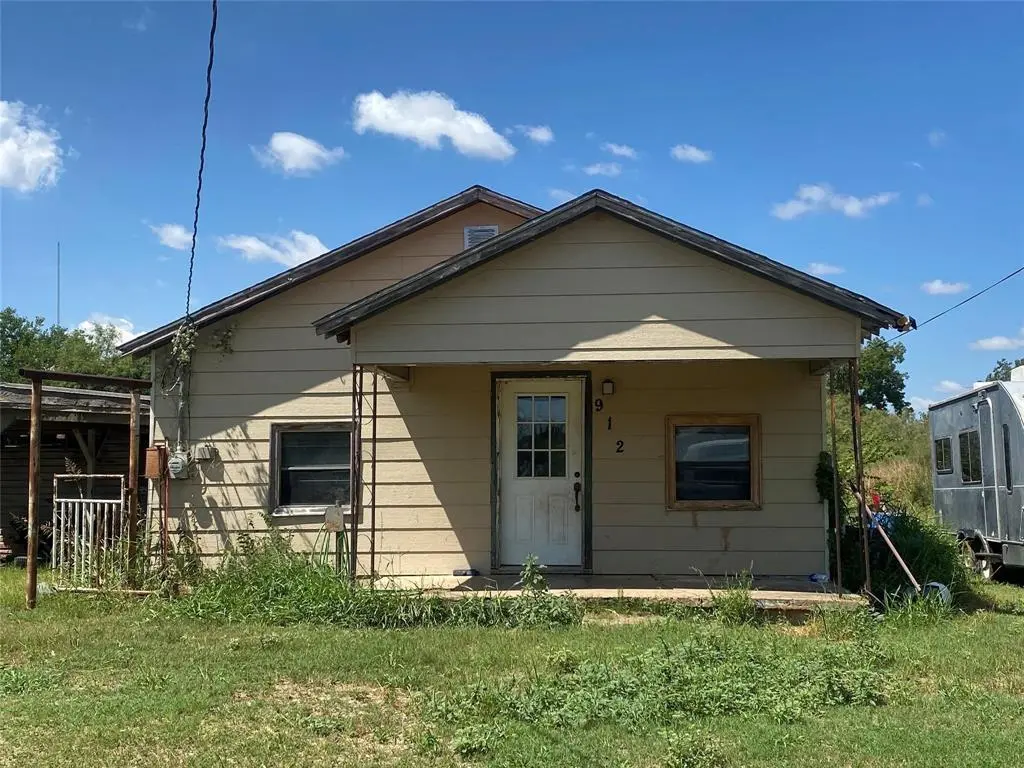
912 Taylor Ave · Rule, TX
Flood risk No data
- FEMA flood zone
- —
- Chance of flooding over 30 yrs
- —
- Est. flood insurance / yr
- —
Fire risk No data
- Est. fire insurance / yr
- —
Heat risk No data
- Hot days now (above threshold)
- —
- Hot days in 30 yrs
- —
Wind risk No data
- Chance of severe wind over 30 yrs
- —
Air-quality risk No data
- Unhealthy air days now
- —
- Unhealthy air days in 30 yrs
- —
Risk factors via First Street. Map © Google.
Why this score? — see what drove the B- grade
The composite is a weighted blend of 9 inputs, each scored 0–100. Each bar is that input's sub-score; the figure is the points it added to the 100-point composite (weight × sub-score).
- Cash flow +30.0/30.0
- DSCR +10.0/10.0
- 1% rule +8.5/10.0
- Appreciation +5.1/10.0
- Schools +3.4/10.0
- Livability +3.0/5.0
- Rent growth +2.5/5.0
- Condition / age +2.5/5.0
- ARV discount +2.3/15.0
$79,900
🖨 Deal sheet 📄 Offer letter ✓ Due diligence
Listing remarks MLS
Opportunity awaits, located on approx. 3 acres of semi secluded property in Rule Texas sets this 3 bedrooms, 2bath home. This property offers so many possibilities. It's most recent update includes: new roof, exterior siding, windows and master bathroom. Don’t miss out!
Key facts
- Hobby farm
- Full rv hookup
- 4.13 acre lot
Tags
Property features AI
Finance
- Other: Lot size approximately 4.13 acres; Parcel ID: R06205; Subdivision: May Add Town Of Rule; County: Haskell; Country: United States
- Financial info: Treat as clear loan type; No second mortgage
- HOA & community: No association
Exterior
- Parking: Covered carport with 2 spaces
- Utilities: City water; City sewer; Electricity available; No municipal utility district
- Home design: Single family residence; Residential property; One story
- Construction: Frame construction; Built in 1945
- Exterior features: Acreage lot; Agricultural lot features; Directions: Access the property from the south side off Branner St (do not GPS)
Interior
- Kitchen: Other appliances
- Bedrooms: 3 bedrooms (all on level 1)
- Bathrooms: 1 full bath; 1 half bath
- Heating & cooling: Wall/window air conditioning units; Other heating
- Interior features: One-level layout; 4 total rooms; 1 living area; No fireplace; Other interior features
- Laundry & utility: Other (laundry/utility information not specified)
Neighborhood map
What this means for you Summary
Snapshot
- This is a 3-bed/1.5-bath single-family listed at $80k.
Deal economics
- At list price, monthly cash flow is $321 ($4k/yr) — positive.
- The deal already cash-flows at list — no discount required.
- Meets the 1% rule at list price ($1k rent vs $80k).
- Recommended offer: $78k (3.0% below list) — sets the bar for market timing.
Location & tenants
- Location reads 60/100 on livability (#1,048 in TX) — a middle-class / working-renter tenant base. Strengths: cost of living A+, housing A+; Watch: health & safety C-, schools F, crime F.
- Rule ISD (rural): math 30% / reading 45% proficiency, ranked #855 of 1,141 in TX (top 75%) — families likely to look elsewhere, expect single-tenant / working-renter base with shorter leases; 63% free/reduced lunch — lower-income household profile, screen leases tightly.
- Market conditions: 14 active listings in the ZIP.
Forward outlook
- In year one you build about $785 of equity ($552 loan paydown + $233 appreciation (0.3% local appreciation)).
- Haskell County population projected at +6% by 2050 — modest demand growth; plan on rents tracking national, not racing it.
- At projected returns (0.3% appreciation + 3.0% rent growth), your $22k cash investment doubles in ~5 years — after that, you're playing with house money.
Negotiation context
- It's been on market 35 days — a 3% lower offer ($78k) is reasonable based on typical stale-listing flexibility.
- 5 sale attempts since 6y ago with the ask held roughly flat each time — persistent listings suggest the price (not the market) is what's stuck; bring a comps-based counter.
Risks & watch-outs
- Watch-outs: built in 1945 — expect roof / HVAC / electrical / plumbing capex.
Questions for the listing agent
- It's been on market 35 days. Have you received any prior offers? Is the seller open to a 3% concession, seller financing, or rate buy-down credit?
- Built in 1945 — when were the roof, HVAC, electrical panel, plumbing, and water heater last replaced?
- Is there a deadline driving the sale (1031 exchange, divorce, estate, relocation)? That informs how much negotiation room exists.
- Schools are F-rated, which usually means shorter tenancies and higher turnover. Who's the typical renter profile here, and what's been the actual vacancy rate?
- Crime grade is F in this area — have there been break-ins, vandalism, or insurance claims at this property in the last 3 years? What carrier currently insures it and at what premium?
- What's the average days-on-market for RENTAL listings here right now (not sales)? A rising rental-DOM trend means longer vacancies and softer asking-rent achievability than the comps imply.
- What's the recent tenant-quality profile in this submarket — average credit score on applications, eviction rate, late-payment / NSF rate, and stable-employment percentage? A property-management company in the area should have these aggregated.
- How much new for-sale + rental construction is in the pipeline within 1–3 miles? Heavy new supply typically softens prices + rents 12–24 months out; constrained supply supports both.
Investment metrics
- 1% rule
- 1.35% ✓
- Cap rate
- 11.12%
- Cash-on-cash
- 17.23%
- DSCR
- 1.77
- GRM
- 6.2
CMA / ARV
- ARV (median comp)
- $71,561
- List price
- $79,900
- Delta
- 11.65%
- Verdict
- OVERPRICED
- Comps
- 10 within 1.0 mi
Show comp detail 1 sale within ~0.75 mi
| Address | Dist | Beds/Ba | Sqft | Sold | Price | $/sf | Match |
|---|---|---|---|---|---|---|---|
| 1209 Union Ave | 0.32mi | 2/1.0 (-1) | 1,196 (+13%) | 13mo | $80,000 | $67 | 45 |
Match score weights: distance 35% · size 25% · config 20% · recency 20%. Top-matched comps best support the ARV.
Projected returns pro-forma
0.29% appreciation · 3.0% rent growth · sell at horizon
- IRR
- 17.5%
- Equity multiple
- 1.86×
- Total profit
- $19,236
- Equity at exit
- $24,374
- IRR
- 21.6%
- Equity multiple
- 3.45×
- Total profit
- $54,866
- Equity at exit
- $30,253
Cash invested: $22,372 (down + closing). Projections, not guarantees.
Landlord ↔ Tenant lean methodology
- Overall (STATE)
- 87 Strongly Landlord-Friendly
- State Texas
- 87 Strongly Landlord-Friendly · R+5
- County
- — inherits STATE
- City
- — inherits STATE
ZIP-level market 79547
- Home prices YoY
- 0.3%
- Active inventory
- 14
- Price-to-rent
- 6.2×
Monthly cashflow live
- Estimated rent
- $1,083 medium interval (Pro) →
- Mortgage (P&I)
- −$419
- Tax from tax record
- −$82 /mo · $979/yr
- Insurance
- −$33
- HOA
- −$0
- Vacancy / Maint / Mgmt
- −$227
- Net cashflow
- $321
Break-even live
UW: 25.0% down · 7.5% · 30yr · 1.5% tax · 5.0% vac · 8.0% maint · 8.0% mgmt
Financing live
Cash to close
- Down payment
- $19,975
- Closing costs
- $2,397
- Reserves months
- —
- Total cash needed
- —
Loan-product check · same deal, 3 products live
Conventional
25% down · 7.5% · 30yr
- Down + closing
- —
- Monthly P&I
- —
- Monthly cashflow
- —
- DSCR
- —
- Eligible?
- —
Personal DTI + credit; lowest rate.
DSCR
20% down · 8.5% · 30yr
- Down + closing
- —
- Monthly P&I
- —
- Monthly cashflow
- —
- DSCR
- —
- Eligible?
- —
No personal income docs; deal must DSCR.
Hard money
10% down · 12.0% · 12mo
- Down + closing
- —
- Monthly P&I
- —
- Monthly cashflow
- —
- DSCR
- —
- Eligible?
- —
Short-term bridge; refi at stabilization.
Listing history 27 events
-
2026-06-18days on market $79,900 Active 35 DOM
-
2026-06-17days on market $79,900 Active 34 DOM
-
2026-06-16days on market $79,900 Active 33 DOM
-
2026-06-15days on market $79,900 Active 32 DOM
-
2026-06-15days on market $79,900 Active 31 DOM
-
2026-06-13days on market $79,900 Active 30 DOM
-
2026-06-12days on market $79,900 Active 29 DOM
-
2026-06-09days on market $79,900 Active 26 DOM
-
2026-06-08days on market $79,900 Active 25 DOM
-
2026-06-08days on market $79,900 Active 24 DOM
-
2026-06-07days on market $79,900 Active 23 DOM
-
2026-06-03days on market $79,900 Active 20 DOM
-
2026-06-02days on market $79,900 Active 19 DOM
-
2026-06-01days on market $79,900 Active 18 DOM
-
2026-05-31days on market $79,900 Active 17 DOM
-
2026-05-14$79,900 Active 842-char remark
-
2026-02-25historical
-
2025-09-02$99,900 Active
-
2022-05-20soldstatus Closed
Show marketing remark (276 chars)
Opportunity awaits, located on approx. 3 acres of semi secluded property in Rule Texas sets this 3 bedrooms, 2bath home. This property offers so many possibilities. It's most recent update includes: new roof, exterior siding, windows and master bathroom. Don’t miss out!
-
2022-04-28historical Active Contingent
Show marketing remark (276 chars)
Opportunity awaits, located on approx. 3 acres of semi secluded property in Rule Texas sets this 3 bedrooms, 2bath home. This property offers so many possibilities. It's most recent update includes: new roof, exterior siding, windows and master bathroom. Don’t miss out!
-
2022-03-29$69,900 Active
Show marketing remark (276 chars)
Opportunity awaits, located on approx. 3 acres of semi secluded property in Rule Texas sets this 3 bedrooms, 2bath home. This property offers so many possibilities. It's most recent update includes: new roof, exterior siding, windows and master bathroom. Don’t miss out!
-
2021-07-26historical
-
2021-06-18status Active
-
2021-06-09historical Active Option Contract
-
2021-03-02price $32,500
-
2021-01-20price $34,900
-
2020-12-09$37,500 Active
ⓘ Source: listings_history table (triggers on properties + properties_extension) + one-shot
backfill from property_details.listing_events for pre-trigger history.
Tax reassessment forecast TX · Resets to sale price
- Current annual tax
- $979 · $82/mo
- Projected year-2 tax
- $1,462 · $122/mo
- Expected delta
- +$483/yr (+$40/mo · 49.3%)
ⓘ Screening estimate from a state-policy table — verify with the county assessor before closing.
Nearby sold comps map
Loading sold comps map…
Walkable amenities ~0.75 mi
Loading nearby amenities…
Taxation est. · year 1
- Rental income
- $12,991
- − Mortgage interest
- −$4,476
- − Property taxes
- −$979
- − Insurance
- −$400
- − Repairs & maintenance
- −$1,039
- − Management
- −$1,039
- − Depreciation
- −$2,324
- Taxable income
- $2,733
- Est. tax owed @ 24.0%
- −$656
- After-tax cash flow
- $3,200/yr
For passive investors: Depreciation is non-cash, so a rental often shows a tax loss while cash-flowing — sheltering income. Rental losses are passive: they offset passive income freely, and up to $25,000/yr can offset ordinary (W-2) income if you actively participate and your MAGI is under $100k (phasing out to $0 by $150k); unused losses carry forward. On sale, claimed depreciation is recaptured at up to 25%, and gains may owe capital-gains tax (a 1031 exchange can defer both). Figures are a year-1 estimate at your 24.0% rate — not tax advice; consult a CPA.
Schools (NCES district)
- District
- Rule ISD
- NCES district ID
- 4838280
- Math proficiency
- 30% ▲ 5.00%
- Reading proficiency
- 45% ▲ 10.00%
- Median HH income
- $35,293
- Composite
- 33.52/100
- National rank
- #10510
- State rank
- #855 of 1141 in TX
Livability — Rule
- Score
- 60/100
- State rank
- #1048
- US rank
- #18650
Category grades
Schools grade is shown separately in the Schools card above.
Census & demographics
- Census place
- Rule, TX
- Population (ZIP)
- 869
Population outlook (Haskell County) Hauer SSP2
- Today (2025)
- 5,679 people
- By 2030
- 5,693 · +0.2%
- By 2040
- 5,769 · +1.6%
- By 2050
- 6,012 · +5.9%
- By 2075
- 6,792 · +19.6%
- By 2100
- 6,531 · +15.0%
Race, ethnicity, and origin ACS 2023
- Neighborhood character
- Majority White (64%)
- Race & ethnicity
- White 64% Hispanic / Latino 29% Two or more races 14% Black 4%
- Hispanic origin (detail)
- Mexican 28%
- Common ancestry
- Serbian 8% Lithuanian 4% German 3%
- Foreign-born
- 3% · Canada
- Languages at home
- 83% English-only · Spanish 16%
Political lean MEDSL · Haskell
- 2024 margin
- Solid R (+71.5) · D 13.9% · R 85.4%
- 2008→2024 swing
- -38.9pp toward R · 2008: -32.6pp · 2024: -71.5pp
- All cycles
- 2024: R+71.5 2020: R+67.2 2016: R+61.7 2012: R+43.4 2008: R+32.6
Not yet ingested
- Civics
- —
Market trends
- HPI YoY
- ▲ 0.29%
- Current HPI
- 90.0549
- Rent YoY
- —
- Metro
- —
- State GDP YoY
- ▲ 3.95%
- F500 in state
- 110
Industry mix (Fortune 500 HQ in TX)
| Industry | F500 HQs | Revenue |
|---|---|---|
| Energy | 16 | $1,198B |
|
||
| Technology | 5 | $198B |
|
||
| Engineering / Construction | 4 | $72B |
|
||
| Energy Services | 3 | $60B |
|
||
| Utilities | 3 | $41B |
|
||
| Healthcare | 2 | $330B |
|
||
Price history
+113.1% since first listed12 events — show timeline
- 2026-05-14 Listed $79,900 NTREIS
- 2026-02-25 Listing Removed — NTREIS
- 2025-09-02 Listed $99,900 NTREIS
- 2022-05-20 Sold (MLS) — NTREIS
- 2022-04-28 Contingent — NTREIS
- 2022-03-29 Listed $69,900 NTREIS
- 2021-07-26 Listing Removed — NTREIS
- 2021-06-18 Relisted — NTREIS
- 2021-06-09 Contingent — NTREIS
- 2021-03-02 Price Changed $32,500 NTREIS
- 2021-01-20 Price Changed $34,900 NTREIS
- 2020-12-09 Listed $37,500 NTREIS
Property tax history
+18.3%/yrLatest (2025): $979 · +3.6% YoY. Source: county tax records.
Cash-flow waterfall
monthlySold comps — $/sqft
last 12 mo · ≤1 miLoading sold comps…