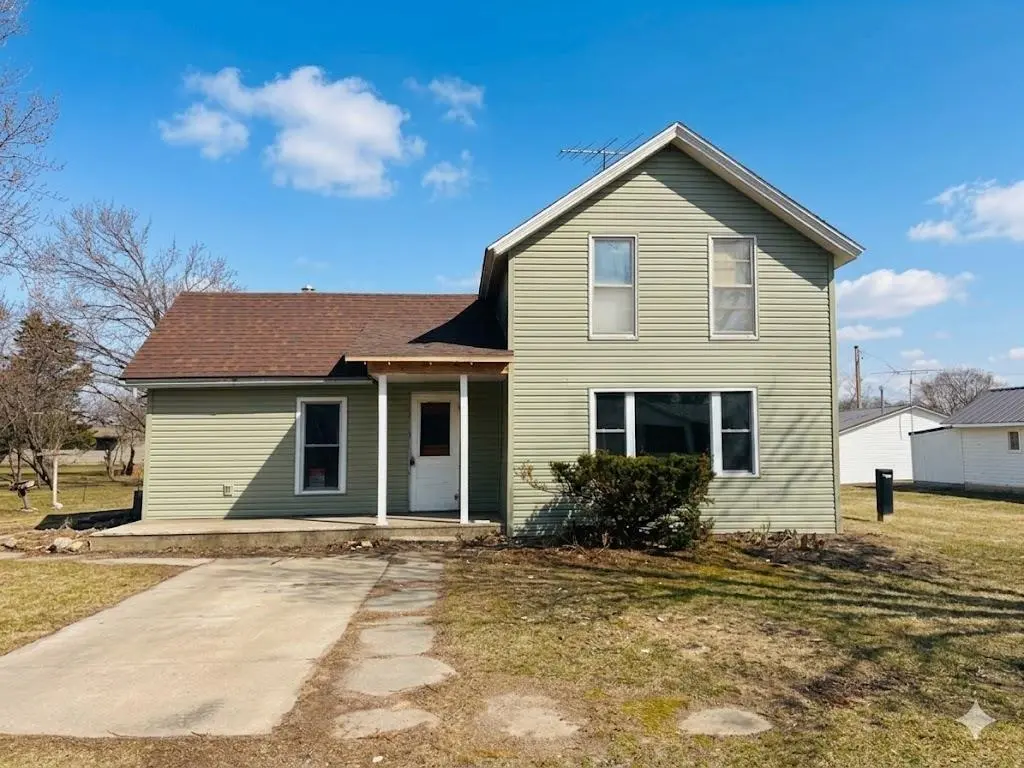
204 S Madison St · Hazleton, IA
Flood risk 1/10 · Minimal
- FEMA flood zone
- X (unshaded)
- Chance of flooding over 30 yrs
- 0.0%
- Est. flood insurance / yr
- $507 – $1,088
Fire risk 4/10 · Minor
- Est. fire insurance / yr
- $902 – $1,676
Heat risk 2/10 · Minimal
- Hot days now (above 100°F)
- 7 days/yr
- Hot days in 30 yrs
- 15 days/yr
Wind risk 2/10 · Minimal
- Chance of severe wind over 30 yrs
- —
Air-quality risk 1/10 · Minimal
- Unhealthy air days now
- 0 days/yr
- Unhealthy air days in 30 yrs
- 0 days/yr
Risk factors via First Street. Map © Google.
Why this score? — see what drove the D- grade
The composite is a weighted blend of 9 inputs, each scored 0–100. Each bar is that input's sub-score; the figure is the points it added to the 100-point composite (weight × sub-score).
- Cash flow +11.1/30.0
- Appreciation +6.2/10.0
- Schools +4.3/10.0
- 1% rule +3.2/10.0
- DSCR +3.2/10.0
- Livability +3.0/5.0
- Rent growth +2.5/5.0
- Condition / age +2.5/5.0
- ARV discount +0.2/15.0
$145,000
🖨 Deal sheet (PDF) 📄 Offer letter ✓ Due diligence
Listing remarks MLS
Great Investment Property! 2 BR, 1 BA, 1640 SQ FT. 1st Floor Laundry. Appliances and wood burner included! Low taxes! Owner will consider selling on Contract! Call Today !
Key facts
- Plumbing updated
- Refrigerator updated
- Siding updated
Tags
Property features AI
Exterior
- Parking: No designated parking
- Utilities: Public water; Public sewer
- Home design: Single-family residence; 2 stories
- Construction: Vinyl siding; Asphalt shingle roof
- Exterior features: Lot dimensions approximately 75 x 150; Quarter-acre lot; R-1 zoning
Interior
- Bathrooms: 1 full bathroom
- Heating & cooling: Baseboard heating; Forced air heating; Natural gas heating; Ceiling fans for cooling
- Interior features: No fireplace; Partially finished concrete basement
Neighborhood map
What this means for you Summary
Snapshot
- This is a 3-bed/1.0-bath single-family listed at $145k.
Deal economics
- At list price, monthly cash flow is $-57 ($-686/yr) — negative.
- To cash-flow at today's rent, offer at most $137k (5.7% below list).
- To meet the 1% rule (rent ≥ 1% of price), the offer needs to be $120k (17.5% below list).
- Recommended offer: $120k (17.5% below list) — sets the bar for 1% rule.
Location & tenants
- Location reads 60/100 on livability (#813 in IA) — a middle-class / working-renter tenant base. Strengths: cost of living A+, housing A+; Watch: amenities F, commute F, employment F.
- Oelwein Community School District (town): math 47% / reading 55% proficiency, ranked #281 of 289 in IA (top 97%) — acceptable for families but not a draw, mixed tenant base, ~2y average lease.
- Zoned schools: Wings Park Elementary School (math 52% / reading 47%, grade D, #514 of 616 statewide, top 85%, 345 students, 64% FRL); Oelwein Middle School (math 44% / reading 54%, grade C-, #219 of 246 statewide, top 90%, 359 students, 60% FRL); Oelwein High School (math 46% / reading 62%, grade C-, #293 of 336 statewide, top 87%, 314 students, 46% FRL).
- Market conditions: 5 active listings in the ZIP; 19 units permitted in Buchanan County in 2024 (0 in 5+ unit buildings).
Forward outlook
- In year one you build about $5k of equity ($1k loan paydown + $4k appreciation (2.5% local appreciation)).
- Buchanan County population projected to shrink 9% by 2050 — rents likely to lag national; underwrite the cash flow, not the appreciation.
- At projected returns (2.5% appreciation + 3.0% rent growth), your $41k cash investment doubles in ~8 years — after that, you're playing with house money.
- By year 8, paydown + projected appreciation supports a ~$34k cash-out refi (75% LTV) — recoverable capital for the next deal without selling this one.
Negotiation context
- It's been on market 38 days — a 3% lower offer ($141k) is reasonable based on typical stale-listing flexibility.
- 2 sale attempts since 7y ago with the ask held roughly flat each time — persistent listings suggest the price (not the market) is what's stuck; bring a comps-based counter.
- Current owner paid $15k; list at $145k implies a 867% gain — meaningful room to come down on a strong offer.
Risks & watch-outs
- Watch-outs: built in 1900 — expect roof / HVAC / electrical / plumbing capex.
Questions for the listing agent
- What do current leases actually rent for vs. the listed asking? Can we see a recent rent roll and the last 12 months of T-12 income?
- It's been on market 38 days. Have you received any prior offers? Is the seller open to a 18% concession, seller financing, or rate buy-down credit?
- Built in 1900 — when were the roof, HVAC, electrical panel, plumbing, and water heater last replaced?
- Is there a deadline driving the sale (1031 exchange, divorce, estate, relocation)? That informs how much negotiation room exists.
- Schools are F-rated, which usually means shorter tenancies and higher turnover. Who's the typical renter profile here, and what's been the actual vacancy rate?
- The area grade is low — what's the realistic commute time and amenity access for the typical tenant pool here? Any planned neighborhood developments (good or bad) we should know about?
- What's the average days-on-market for RENTAL listings here right now (not sales)? A rising rental-DOM trend means longer vacancies and softer asking-rent achievability than the comps imply.
- What's the recent tenant-quality profile in this submarket — average credit score on applications, eviction rate, late-payment / NSF rate, and stable-employment percentage? A property-management company in the area should have these aggregated.
- How much new for-sale + rental construction is in the pipeline within 1–3 miles? Heavy new supply typically softens prices + rents 12–24 months out; constrained supply supports both.
Investment metrics
- 1% rule
- 0.82% ✗
- Cap rate
- 5.82%
- Cash-on-cash
- -1.69%
- DSCR
- 0.92
- GRM
- 10.1
CMA / ARV
- ARV (median comp)
- $124,872
- List price
- $145,000
- Delta
- 16.12%
- Verdict
- OVERPRICED
- Comps
- 20 within 1.0 mi
Show comp detail 6 sales within ~0.75 mi
| Address | Dist | Beds/Ba | Sqft | Sold | Price | $/sf | Match |
|---|---|---|---|---|---|---|---|
| 203 E Benton St | 0.32mi | 3/2.0 | 1,565 (-5%) | 1mo | $176,500 | $113 | 72 |
| 201 Westline Dr | 0.40mi | 3/2.0 | 1,648 (+0%) | 6mo | $125,000 | $76 | 72 |
| 209 E Hayes St | 0.20mi | 4/1.0 (+1) | 1,618 (-1%) | 15mo | $92,700 | $57 | 71 |
| 105 1st St. St N | 0.23mi | 2/1.5 (-1) | 1,749 (+7%) | 11mo | $119,000 | $68 | 62 |
| 404 Hayes St E | 0.22mi | 4/1.0 (+1) | 1,862 (+14%) | 15mo | $65,000 | $35 | 50 |
| 307 E Hayes St. St | 0.21mi | 2/2.0 (-1) | 1,429 (-13%) | 16mo | $113,000 | $79 | 46 |
Match score weights: distance 35% · size 25% · config 20% · recency 20%. Top-matched comps best support the ARV.
Projected returns pro-forma
2.49% appreciation · 3.0% rent growth · sell at horizon
- IRR
- 4.4%
- Equity multiple
- 1.25×
- Total profit
- $9,958
- Equity at exit
- $61,063
- IRR
- 7.8%
- Equity multiple
- 2.12×
- Total profit
- $45,534
- Equity at exit
- $91,009
Cash invested: $40,600 (down + closing). Projections, not guarantees.
Landlord ↔ Tenant lean methodology
- Overall (STATE)
- 83 Strongly Landlord-Friendly
- State Iowa
- 83 Strongly Landlord-Friendly · R+6
- County
- — inherits STATE
- City
- — inherits STATE
ZIP-level market 50641
- Home prices YoY
- 1.3%
- Active inventory
- 5
- Price-to-rent
- 10.1×
Monthly cashflow live
- Estimated rent
- $1,196 medium interval (Pro) →
- Mortgage (P&I)
- −$760
- Tax est. 1.5%
- −$181 /mo · $2,175/yr
- Insurance
- −$60
- HOA
- −$0
- Vacancy / Maint / Mgmt
- −$251
- Net cashflow
- $-57
Break-even live
Sensitivity live
| Price | -10% $43 | -5% $-7 | +0% $-57 | +5% $-107 | +10% $-157 |
|---|---|---|---|---|---|
| Rent | -10% $-152 | -5% $-104 | +0% $-57 | +5% $-10 | +10% $37 |
| Rate | -1.0pp $16 | -0.5pp $-20 | base $-57 | +0.5pp $-95 | +1.0pp $-133 |
UW: 25.0% down · 7.5% · 30yr · 1.5% tax · 5.0% vac · 8.0% maint · 8.0% mgmt
Financing live
Cash to close
- Down payment
- $36,250
- Closing costs
- $4,350
- Reserves months
- —
- Total cash needed
- —
Loan-product check · same deal, 3 products live
Conventional
25% down · 7.5% · 30yr
- Down + closing
- —
- Monthly P&I
- —
- Monthly cashflow
- —
- DSCR
- —
- Eligible?
- —
Personal DTI + credit; lowest rate.
DSCR
20% down · 8.5% · 30yr
- Down + closing
- —
- Monthly P&I
- —
- Monthly cashflow
- —
- DSCR
- —
- Eligible?
- —
No personal income docs; deal must DSCR.
Hard money
10% down · 12.0% · 12mo
- Down + closing
- —
- Monthly P&I
- —
- Monthly cashflow
- —
- DSCR
- —
- Eligible?
- —
Short-term bridge; refi at stabilization.
Listing history 21 events
-
2026-06-22days on market $145,000 Active 38 DOM
-
2026-06-21days on market $145,000 Active 37 DOM
-
2026-06-21days on market $145,000 Active 36 DOM
-
2026-06-18days on market $145,000 Active 34 DOM
-
2026-06-17days on market $145,000 Active 33 DOM
-
2026-06-16days on market $145,000 Active 32 DOM
-
2026-06-15days on market $145,000 Active 31 DOM
-
2026-06-13days on market $145,000 Active 29 DOM
-
2026-06-12days on market $145,000 Active 28 DOM
-
2026-06-09days on market $145,000 Active 25 DOM
-
2026-06-08days on market $145,000 Active 24 DOM
-
2026-06-07days on market $145,000 Active 23 DOM
-
2026-06-07days on market $145,000 Active 22 DOM
-
2026-06-04days on market $145,000 Active 19 DOM
-
2026-06-02days on market $145,000 Active 18 DOM
-
2026-06-01days on market $145,000 Active 17 DOM
-
2026-05-31days on market $145,000 Active 16 DOM
-
2026-05-31days on market $145,000 Active 15 DOM
-
2026-05-15$145,000 Active 425-char remark
-
2020-08-15soldstatus $15,000 172-char remark
Show marketing remark (172 chars)
Great Investment Property! 2 BR, 1 BA, 1640 SQ FT. 1st Floor Laundry. Appliances and wood burner included! Low taxes! Owner will consider selling on Contract! Call Today !
-
2019-06-19$20,000 172-char remark
Show marketing remark (172 chars)
Great Investment Property! 2 BR, 1 BA, 1640 SQ FT. 1st Floor Laundry. Appliances and wood burner included! Low taxes! Owner will consider selling on Contract! Call Today !
ⓘ Source: listings_history table (triggers on properties + properties_extension) + one-shot
backfill from property_details.listing_events for pre-trigger history.
Climate risk First Street
- Flood 1/10 Low FEMA zone X (unshaded) · 0% chance over 30 yrs
- Wildfire 4/10 Moderate
- Heat 2/10 Low 7 d/yr ≥100°F today · 15 d/yr by 30 yrs out
- Wind 2/10 Low
- Air quality 1/10 Low 0 unhealthy d/yr today · 0 by 30 yrs out
Nearby sold comps map
Loading sold comps map…
Walkable amenities ~0.75 mi
Loading nearby amenities…
Taxation est. · year 1
- Rental income
- $14,353
- − Mortgage interest
- −$8,122
- − Property taxes
- −$2,175
- − Insurance
- −$725
- − Repairs & maintenance
- −$1,148
- − Management
- −$1,148
- − Depreciation
- −$4,218
- Taxable loss
- −$3,184
- Est. tax savings @ 24.0%
- +$764
- After-tax cash flow
- $78/yr
For passive investors: Depreciation is non-cash, so a rental often shows a tax loss while cash-flowing — sheltering income. Rental losses are passive: they offset passive income freely, and up to $25,000/yr can offset ordinary (W-2) income if you actively participate and your MAGI is under $100k (phasing out to $0 by $150k); unused losses carry forward. On sale, claimed depreciation is recaptured at up to 25%, and gains may owe capital-gains tax (a 1031 exchange can defer both). Figures are a year-1 estimate at your 24.0% rate — not tax advice; consult a CPA.
Schools (NCES district)
- District
- Oelwein Community School District
- NCES district ID
- 1921630
- Math proficiency
- 47% ▼ -5.00%
- Reading proficiency
- 55% ▲ 5.00%
- Median HH income
- $39,812
- Composite
- 42.61/100
- National rank
- #3189
- State rank
- #281 of 289 in IA
Livability — Hazleton
- Score
- 60/100
- State rank
- #813
- US rank
- #18681
Category grades
Schools grade is shown separately in the Schools card above.
Census & demographics
- Census place
- Hazleton, IA
- Population (ZIP)
- 1,665
Population outlook (Buchanan County) Hauer SSP2
- Today (2025)
- 20,892 people
- By 2030
- 20,578 · -1.5%
- By 2040
- 19,906 · -4.7%
- By 2050
- 19,024 · -8.9%
- By 2075
- 16,289 · -22.0%
- By 2100
- 12,561 · -39.9%
Race, ethnicity, and origin ACS 2023
- Neighborhood character
- Predominantly White (94%)
- Race & ethnicity
- White 94% Two or more races 4% Hispanic / Latino 1%
- Common ancestry
- Iranian 3% Portuguese 2% Lithuanian 1%
- Foreign-born
- 1% · Canada
- Languages at home
- 78% English-only · German/W. Germanic 21% Spanish 1%
Political lean MEDSL · Buchanan
- 2024 margin
- Strong R (+28.2) · D 35.1% · R 63.4% · Other 1.5%
- 2008→2024 swing
- -46.7pp toward R · 2008: 18.5pp · 2024: -28.2pp
- All cycles
- 2024: R+28.2 2020: R+20.9 2016: R+15.2 2012: D+13.9 2008: D+18.5
Not yet ingested
- Civics
- —
Market trends
- HPI YoY
- ▲ 2.49%
- Current HPI
- 196.7411
- Rent YoY
- —
- Metro
- —
- State GDP YoY
- ▲ 2.48%
- F500 in state
- 4
Industry mix (Fortune 500 HQ in IA)
| Industry | F500 HQs | Revenue |
|---|---|---|
| Financial Services | 1 | $16B |
|
||
| Retail / Convenience | 1 | $15B |
|
||
Price history
+625.0% since first listed3 events — show timeline
- 2026-05-15 Listed $145,000 NEIRBR as distributed by MLS GRID
- 2020-08-15 Sold (MLS) $15,000 NEIRBR as distributed by MLS GRID
- 2019-06-19 Listed $20,000 NEIRBR as distributed by MLS GRID
Cash-flow waterfall
monthlySold comps — $/sqft
last 12 mo · ≤1 miLoading sold comps…