 🏷️ Likely Rental
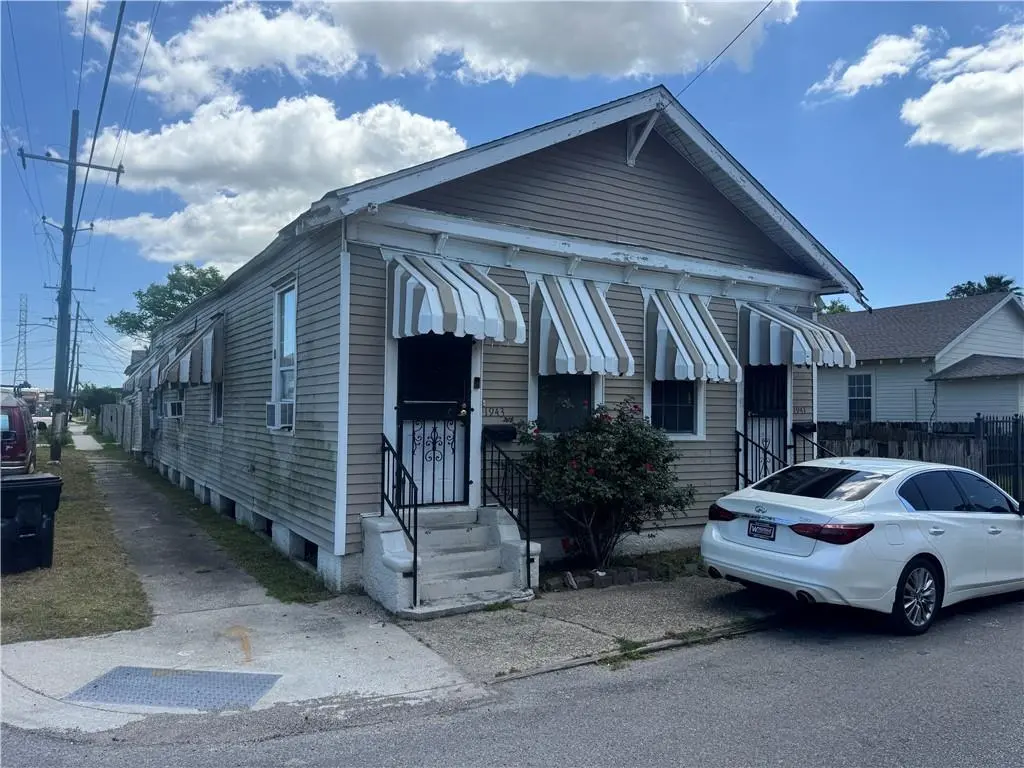
1941 Port St · New Orleans, LA
Flood risk 8/10 · Major
- FEMA flood zone
- X (shaded)
- Chance of flooding over 30 yrs
- 0.6%
- Est. flood insurance / yr
- $507 – $1,088
Fire risk 1/10 · Minimal
- Est. fire insurance / yr
- $1,269 – $2,357
Heat risk 10/10 · Severe
- Hot days now (above 108°F)
- 7 days/yr
- Hot days in 30 yrs
- 21 days/yr
Wind risk 10/10 · Severe
- Chance of severe wind over 30 yrs
- 99.0%
Air-quality risk 3/10 · Minor
- Unhealthy air days now
- 3 days/yr
- Unhealthy air days in 30 yrs
- 3 days/yr
Risk factors via First Street. Map © Google.
Why this score? — see what drove the B- grade
The composite is a weighted blend of 9 inputs, each scored 0–100. Each bar is that input's sub-score; the figure is the points it added to the 100-point composite (weight × sub-score).
- Cash flow +30.0/30.0
- 1% rule +10.0/10.0
- DSCR +10.0/10.0
- ARV discount +7.5/15.0
- Livability +4.0/5.0
- Rent growth +3.1/5.0
- Condition / age +2.5/5.0
- Schools +1.6/10.0
- Appreciation +0.0/10.0
$109,000
🖨 Deal sheet 📄 Offer letter ✓ Due diligence
Multi-family units
County records classify this as Multi-Family (2-4 Unit). Listing-text estimate: 2 units. confirmed
Listing remarks MLS
Duplex on a corner lot located at 1941-43 Port Street in New Orleans, offering a great opportunity for both investors and owner-occupants. One unit is currently leased for $1,100/month, providing immediate income, while the second unit is vacant and ready for updates--allowing for value-add potential or owner occupancy. Property features separate utilities with 2 electric and 2 water meters for added convenience. A covered garage provides off-street parking or additional storage. Whether you're looking to live in one unit and rent the other, or renovate and maximize rental potential, this property offers flexibility and upside at an attractive price point.
Key facts
- Separate utilities
- Covered garage
- Off-street parking
Tags
Neighborhood map
What this means for you Summary
Snapshot
- This is a 2 × 2-bed/1.0-bath units multifamily listed at $109k.
Deal economics
- At list price, monthly cash flow is $1k ($17k/yr) — positive. Per door: $694/mo.
- The deal already cash-flows at list — no discount required.
- Meets the 1% rule at list price ($3k rent vs $109k).
- Recommended offer: $102k (6.0% below list) — sets the bar for market timing.
- Cap rate 22.3% vs local median 4.4% in New Orleans — top-decile yield for the area; either an underpriced asset or a hidden risk that comps aren't pricing in. Stress-test before assuming the spread holds.
Location & tenants
- Location reads 81/100 on livability (#3 in LA, #1,383 nationally) — a professional / high-income tenant draw. Strengths: amenities A+, commute A+, health & safety A+; Watch: crime C-, employment D.
- Orleans Parish (urban): math 11% / reading 27% proficiency, ranked #69 of 98 in LA (top 70%) — low school quality limits family demand, transient renter base, plan for 1-2y turnover; 68% free/reduced lunch — lower-income household profile, screen leases tightly.
- Market conditions: Rents rising (+2.5%/yr); 581 active listings in the ZIP; 40 comparable units currently listed for rent nearby; rentals at typical pace (median 24d on market — plan ~3-4 weeks tenant-placement turnaround); 710 units permitted in Orleans Parish in 2024 (244 in 5+ unit buildings).
- At $2,921/mo this rent would consume 77% of the median local household income ($46k/yr) (locally 1988% of renters already pay >50% of income on rent) — very limited rent-growth headroom before tenants either downsize or default.
Forward outlook
- Local home prices are declining (-3.0%/yr); year-one equity from $754 of loan paydown is wiped out by about $3k of value loss. Plan a longer hold.
- Orleans County population projected at +61% by 2050 — long-run rental-demand tailwind backs the buy-and-hold thesis.
- At projected returns (-3.0% appreciation + 2.5% rent growth), your $31k cash investment doubles in ~3 years — after that, you're playing with house money.
Negotiation context
- It's been on market 66 days — a 6% lower offer ($102k) is reasonable based on typical stale-listing flexibility.
- 2 sale attempts; this cycle's ask has dropped $16k (13%) from the opening price — seller is motivated, your offer sets the floor, not the list.
- Current owner paid $20k; list at $109k implies a 432% gain — meaningful room to come down on a strong offer.
Risks & watch-outs
- Watch-outs: property tax is 2.6% of price; flood insurance adds $66/mo.
- Climate carrying-cost: severe flood risk; severe wind risk, 99% chance of damaging wind over 30y; extreme-heat days projected 7→21/yr by 2055 (HVAC capex compounding) — expect insurance premiums to compound above CPI over the hold.
Questions for the listing agent
- It's been on market 66 days. Have you received any prior offers? Is the seller open to a 6% concession, seller financing, or rate buy-down credit?
- Can we see the unit-by-unit rent roll, current vacancy, and any below-market leases? What's the average tenancy length?
- What capital expenditures (roof, boiler, parking lot, exteriors) have been made in the last 5 years, and what's planned in the next 2?
- Built in 1960 — when were the roof, HVAC, electrical panel, plumbing, and water heater last replaced?
- Property tax is high relative to price — has the assessment been appealed recently, and will the sale trigger a re-assessment?
- What's the actual annual flood-insurance premium (NFIP or private), and is the property in a SFHA with mandatory coverage?
- Why hasn't it sold? Are there any deal-killer items the seller is aware of (foundation, flood, title, zoning, code violations)?
- Is there a deadline driving the sale (1031 exchange, divorce, estate, relocation)? That informs how much negotiation room exists.
- What's the average days-on-market for RENTAL listings here right now (not sales)? A rising rental-DOM trend means longer vacancies and softer asking-rent achievability than the comps imply.
- What's the recent tenant-quality profile in this submarket — average credit score on applications, eviction rate, late-payment / NSF rate, and stable-employment percentage? A property-management company in the area should have these aggregated.
- How much new apartment / multifamily construction is in the pipeline within 1–3 miles? Heavy new supply (>2% of stock underway) typically softens rents 12–24 months out; light construction supports rent growth.
Investment metrics
- 1% rule
- 2.68% ✓
- Cap rate
- 22.31%
- Cash-on-cash
- 57.22%
- DSCR
- 3.55
- GRM
- 3.1
CMA / ARV
- ARV (median comp)
- $221,064
- List price
- $109,000
- Delta
- -50.69%
- Verdict
- UNDERPRICED
- Comps
- 20 within 1.0 mi
Show comp detail 12 sales within ~0.75 mi
| Address | Dist | Beds/Ba | Sqft | Sold | Price | $/sf | Match |
|---|---|---|---|---|---|---|---|
| 3129 31 N Claiborne Ave | 0.43mi | 4/2.0 | 1,806 (+4%) | 3mo | $267,150 | $148 | 71 |
| 1727 29 Marigny St | 0.60mi | 4/2.0 | 1,716 (-1%) | 1mo | $285,000 | $166 | 70 |
| 2105 07 Arts St | 0.28mi | 4/3.0 | 1,598 (-8%) | 3mo | $265,000 | $166 | 67 |
| 1537-1539 Louisa St | 0.51mi | 4/2.0 | 1,778 (+2%) | 6mo | $329,000 | $185 | 67 |
| 1805 07 St Roch Ave | 0.37mi | 4/2.0 | 1,914 (+10%) | 1mo | $290,000 | $152 | 65 |
| 2211 13 Mandeville St | 0.55mi | 4/2.0 | 1,644 (-5%) | 2mo | $195,000 | $119 | 64 |
| 2421 Feliciana St | 0.42mi | 4/2.0 | 1,572 (-9%) | 2mo | $113,900 | $72 | 63 |
| 2630 N Rampart St | 0.75mi | 4/2.0 | 1,680 (-3%) | 4mo | $387,500 | $231 | 57 |
| 2467/2469 N Tonti St | 0.43mi | 4/2.0 | 1,475 (-15%) | 2mo | $175,000 | $119 | 53 |
| 1834 36 Marigny St | 0.62mi | 4/2.0 | 1,508 (-13%) | 2mo | $215,000 | $143 | 48 |
| 2929 Saint Claude Ave | 0.65mi | 4/2.0 | 1,507 (-13%) | 1mo | $155,000 | $103 | 47 |
| 1734 Spain St | 0.49mi | 5/3.0 (+1) | 1,985 (+14%) | 1mo | $100,000 | $50 | 43 |
Match score weights: distance 35% · size 25% · config 20% · recency 20%. Top-matched comps best support the ARV.
Projected returns pro-forma
-3.0% appreciation · 2.49% rent growth · sell at horizon
- IRR
- 52.2%
- Equity multiple
- 3.28×
- Total profit
- $69,441
- Equity at exit
- $16,252
- IRR
- 57.3%
- Equity multiple
- 6.53×
- Total profit
- $168,896
- Equity at exit
- $9,424
Cash invested: $30,520 (down + closing). Projections, not guarantees.
Landlord ↔ Tenant lean methodology
- Overall (STATE)
- 90 Strongly Landlord-Friendly
- State Louisiana
- 90 Strongly Landlord-Friendly · R+12
- County
- — inherits STATE
- City
- — inherits STATE
ZIP-level market 70117
- Rents YoY
- 2.5%
- Active inventory
- 581
- Price-to-rent
- 6.2×
Monthly cashflow live
- Estimated rent
- $2,921 high interval (Pro) →
- Mortgage (P&I)
- −$572
- Tax from tax record
- −$235 /mo · $2,824/yr
- Insurance
- −$45
- Flood insurance flood zone
- −$66 /mo · $798/yr
- HOA
- −$0
- Vacancy / Maint / Mgmt
- −$613
- Net cashflow
- $1,389
Break-even live
2-unit breakdown (identical units grouped — click to expand)
| Units | Beds | Baths | Est. rent |
|---|---|---|---|
| 2× units | 2 | 1 | $2,922 |
| #1 | 2 | 1 | $1,461 |
| #2 | 2 | 1 | $1,461 |
| Total (2 units) | $2,921 | ||
UW: 25.0% down · 7.5% · 30yr · 1.5% tax · 5.0% vac · 8.0% maint · 8.0% mgmt
Financing live
Cash to close
- Down payment
- $27,250
- Closing costs
- $3,270
- Reserves months
- —
- Total cash needed
- —
Loan-product check · same deal, 3 products live
Conventional
25% down · 7.5% · 30yr
- Down + closing
- —
- Monthly P&I
- —
- Monthly cashflow
- —
- DSCR
- —
- Eligible?
- —
Personal DTI + credit; lowest rate.
DSCR
20% down · 8.5% · 30yr
- Down + closing
- —
- Monthly P&I
- —
- Monthly cashflow
- —
- DSCR
- —
- Eligible?
- —
No personal income docs; deal must DSCR.
Hard money
10% down · 12.0% · 12mo
- Down + closing
- —
- Monthly P&I
- —
- Monthly cashflow
- —
- DSCR
- —
- Eligible?
- —
Short-term bridge; refi at stabilization.
Rent comps 40 comps
| Address | Beds | Baths | Sqft | Rent | $/sqft | DOM | Units | Dist |
|---|---|---|---|---|---|---|---|---|
| 2114 Feliciana St Unit A New Orleans, LA | 3.0 | 2.0 | 1134 | $1,500 | $1.32 | 16d | 1 | 0.24mi |
| 2114 Feliciana St Unit A New Orleans, LA | 3.0 | 2.0 | 1134 | $1,500 | $1.32 | 23d | 1 | 0.24mi |
| 2524 N Galvez St New Orleans, LA | 3.0 | 2.5 | 1102 | $1,800 | $1.63 | 17d | 1 | 0.25mi |
| 2522 N Galvez St New Orleans, LA | 3.0 | 2.0 | 1105 | $1,675 | $1.52 | 23d | 1 | 0.25mi |
| 2515 N Galvez St New Orleans, LA | 4.0 | 2.0 | 1200 | $1,200 | $1.00 | 10d | 1 | 0.27mi |
| 2515 N Galvez St Unit 2515 New Orleans, LA | 4.0 | 2.0 | 1200 | $1,900 | $1.58 | 23d | 1 | 0.27mi |
| 2556 N Tonti St New Orleans, LA | 3.0 | 2.0 | 1100 | $1,850 | $1.68 | 16d | 1 | 0.33mi |
| 2331 Feliciana St New Orleans, LA | 3.0 | 2.0 | 1250 | $1,850 | $1.48 | 23d | 1 | 0.36mi |
| 1839 Louisa St New Orleans, LA | 3.0 | 2.0 | 1500 | $2,095 | $1.40 | 16d | 1 | 0.41mi |
| 1835 Louisa St New Orleans, LA | 3.0 | 2.5 | 1800 | $2,350 | $1.31 | 3d | 1 | 0.42mi |
| 1942 Piety St New Orleans, LA | 3.0 | 1.0 | 1100 | $1,500 | $1.36 | 23d | 1 | 0.44mi |
| 1822 Piety St New Orleans, LA | 3.0 | 1.5 | 1200 | $1,500 | $1.25 | 16d | 1 | 0.45mi |
| 2028 Desire St New Orleans, LA | 3.0 | 1.0 | 1300 | $1,300 | $1.00 | 23d | 1 | 0.50mi |
| 1904 Desire St New Orleans, LA | 3.0 | 1.0 | 1200 | $1,400 | $1.17 | 10d | 1 | 0.50mi |
| 2115 Mandeville St New Orleans, LA | 3.0 | 2.0 | 1400 | $1,650 | $1.18 | 23d | 1 | 0.54mi |
| 2129 Desire St Unit 1B New Orleans, LA | 3.0 | 1.0 | 1105 | $1,200 | $1.09 | 2d | 1 | 0.54mi |
| 2129 Desire St Unit 1B New Orleans, LA | 3.0 | 1.0 | 1105 | $1,200 | $1.09 | 3d | 1 | 0.54mi |
| 2019 Gallier St New Orleans, LA | 4.0 | 2.0 | 1400 | $2,200 | $1.57 | 23d | 1 | 0.58mi |
| 1231 Feliciana St New Orleans, LA | 3.0 | 2.5 | 1869 | $2,750 | $1.47 | 43d | 1 | 0.60mi |
| 5624-5626 Saint Claude ST New Orleans, LA | 4.0 | 3.0 | 1521 | $2,300 | $1.51 | 23d | 1 | 0.61mi |
| 2220 N Prieur St New Orleans, LA | 3.0 | 2.0 | 1334 | $2,000 | $1.50 | 23d | 1 | 0.65mi |
| 1710 Marigny St New Orleans, LA | 3.0 | 2.0 | 1120 | $1,750 | $1.56 | 23d | 1 | 0.65mi |
| 2107 Elysian Fields Ave New Orleans, LA | 4.0 | 2.0 | 1794 | $1,650 | $0.92 | 3d | 1 | 0.68mi |
| 2115 Elysian Fields Ave Unit 2115 New Orleans, LA | 3.0 | 1.0 | 1100 | $1,450 | $1.32 | 23d | 1 | 0.68mi |
| 1437 Gallier St New Orleans, LA | 3.0 | 2.0 | 1451 | $1,875 | $1.29 | 21d | 1 | 0.70mi |
| 1038 Montegut St New Orleans, LA | 3.0 | 2.5 | 2250 | $4,200 | $1.87 | 43d | 1 | 0.71mi |
| 1038 Montegut St New Orleans, LA | 3.0 | 2.5 | 2250 | $4,200 | $1.87 | 23d | 1 | 0.71mi |
| 3221 Saint Claude Ave New Orleans, LA | 3.0 | 1.0 | 1900 | $1,650 | $0.87 | 23d | 1 | 0.77mi |
| 1837 Touro St New Orleans, LA | 3.0 | 1.0 | 1994 | $2,000 | $1.00 | 23d | 1 | 0.83mi |
| 882 Montegut St New Orleans, LA | 1.0–3.0 | 1.0–2.0 | 826 | $2,575 | $3.12 | 43d | 7 | 0.85mi |
| 1628 Bartholomew St New Orleans, LA | 3.0 | 2.0 | 1050 | $1,600 | $1.52 | 23d | 1 | 0.85mi |
| 1325 Pauline St New Orleans, LA | 3.0 | 2.0 | 1792 | $2,250 | $1.26 | 3d | 1 | 0.87mi |
| 1325 Pauline St New Orleans, LA | 3.0 | 2.0 | 1792 | $2,250 | $1.26 | 2d | 1 | 0.87mi |
| 1323 Pauline St New Orleans, LA | 3.0 | 2.0 | 1792 | $2,250 | $1.26 | 3d | 1 | 0.88mi |
| 2317 N Rampart St Unit 1272378P New Orleans, LA | 3.0–6.0 | 2.0–4.0 | 1581 | $4,154 | $2.63 | 3d | 2 | 0.89mi |
| 3134 Burgundy St New Orleans, LA | 3.0 | 2.0 | 1887 | $2,900 | $1.54 | 23d | 1 | 0.90mi |
| 1923 N Robertson St New Orleans, LA | 3.0 | 2.0 | 1051 | $1,950 | $1.86 | 3d | 1 | 0.93mi |
| 2920 Pauger St New Orleans, LA | 4.0 | 2.0 | 1882 | $1,995 | $1.06 | 23d | 1 | 0.95mi |
| 2322 Burgundy St Unit C New Orleans, LA | 3.0 | 2.0 | 1250 | $2,200 | $1.76 | 23d | 1 | 0.95mi |
| 4222 N Johnson St New Orleans, LA | 3.0 | 2.0 | 1100 | $1,895 | $1.72 | 23d | 1 | 0.98mi |
Listing history 19 events
-
2026-06-18days on market $109,000 Active 66 DOM
-
2026-06-17days on market $109,000 Active 65 DOM
-
2026-06-16days on market $109,000 Active 64 DOM
-
2026-06-15days on market $109,000 Active 63 DOM
-
2026-06-13days on market $109,000 Active 61 DOM
-
2026-06-10days on market $109,000 Active 58 DOM
-
2026-06-09days on market $109,000 Active 57 DOM
-
2026-06-08pricedays on market $109,000 Active 56 DOM
-
2026-06-07days on market $114,500 Active 55 DOM
-
2026-06-05days on market $114,500 Active 52 DOM
-
2026-06-03days on market $114,500 Active 51 DOM
-
2026-06-02days on market $114,500 Active 50 DOM
-
2026-06-01days on market $114,500 Active 49 DOM
-
2026-05-31days on market $114,500 Active 48 DOM
-
2026-04-30price $114,500 664-char remark
Show marketing remark (681 chars)
Duplex on a corner lot located at 1941–43 Port Street in New Orleans, offering a great opportunity for both investors and owner-occupants. One unit is currently leased for $1,100/month, providing immediate income, while the second unit is vacant and ready for updates—allowing for value-add potential or owner occupancy. Property features separate utilities with 2 electric and 2 water meters for added convenience. A covered garage provides off-street parking or additional storage. Whether you’re looking to live in one unit and rent the other, or renovate and maximize rental potential, this property offers flexibility and upside at an attractive price point.
-
2026-04-30price $114,500 681-char remark
Show marketing remark (681 chars)
Duplex on a corner lot located at 1941–43 Port Street in New Orleans, offering a great opportunity for both investors and owner-occupants. One unit is currently leased for $1,100/month, providing immediate income, while the second unit is vacant and ready for updates—allowing for value-add potential or owner occupancy. Property features separate utilities with 2 electric and 2 water meters for added convenience. A covered garage provides off-street parking or additional storage. Whether you’re looking to live in one unit and rent the other, or renovate and maximize rental potential, this property offers flexibility and upside at an attractive price point.
-
2026-04-06$125,000 Active 664-char remark
Show marketing remark (681 chars)
Duplex on a corner lot located at 1941–43 Port Street in New Orleans, offering a great opportunity for both investors and owner-occupants. One unit is currently leased for $1,100/month, providing immediate income, while the second unit is vacant and ready for updates—allowing for value-add potential or owner occupancy. Property features separate utilities with 2 electric and 2 water meters for added convenience. A covered garage provides off-street parking or additional storage. Whether you’re looking to live in one unit and rent the other, or renovate and maximize rental potential, this property offers flexibility and upside at an attractive price point.
-
2026-04-06$125,000 Active 681-char remark
Show marketing remark (681 chars)
Duplex on a corner lot located at 1941–43 Port Street in New Orleans, offering a great opportunity for both investors and owner-occupants. One unit is currently leased for $1,100/month, providing immediate income, while the second unit is vacant and ready for updates—allowing for value-add potential or owner occupancy. Property features separate utilities with 2 electric and 2 water meters for added convenience. A covered garage provides off-street parking or additional storage. Whether you’re looking to live in one unit and rent the other, or renovate and maximize rental potential, this property offers flexibility and upside at an attractive price point.
-
1997-07-03soldstatus $20,500
ⓘ Source: listings_history table (triggers on properties + properties_extension) + one-shot
backfill from property_details.listing_events for pre-trigger history.
Tax reassessment forecast LA · Resets to sale price
- Current annual tax
- $2,824 · $235/mo
- Projected year-2 tax
- $2,824 · $235/mo
- Expected delta
- $0/yr ($0/mo · 0.0%)
ⓘ Screening estimate from a state-policy table — verify with the county assessor before closing.
Climate risk First Street
- Flood 8/10 Severe FEMA zone X (shaded) · 60% chance over 30 yrs
- Wildfire 1/10 Low
- Heat 10/10 Extreme 7 d/yr ≥108°F today · 21 d/yr by 30 yrs out
- Wind 10/10 Extreme 99% chance of damaging wind over 30 yrs
- Air quality 3/10 Moderate 3 unhealthy d/yr today · 3 by 30 yrs out
Nearby sold comps map
Loading sold comps map…
Walkable amenities ~0.75 mi
Loading nearby amenities…
Taxation est. · year 1
- Rental income
- $35,052
- − Mortgage interest
- −$6,106
- − Property taxes
- −$2,824
- − Insurance
- −$1,342
- − Repairs & maintenance
- −$2,804
- − Management
- −$2,804
- − Depreciation
- −$3,171
- Taxable income
- $16,000
- Est. tax owed @ 24.0%
- −$3,840
- After-tax cash flow
- $12,825/yr
For passive investors: Depreciation is non-cash, so a rental often shows a tax loss while cash-flowing — sheltering income. Rental losses are passive: they offset passive income freely, and up to $25,000/yr can offset ordinary (W-2) income if you actively participate and your MAGI is under $100k (phasing out to $0 by $150k); unused losses carry forward. On sale, claimed depreciation is recaptured at up to 25%, and gains may owe capital-gains tax (a 1031 exchange can defer both). Figures are a year-1 estimate at your 24.0% rate — not tax advice; consult a CPA.
Schools (NCES district)
- District
- Orleans Parish
- NCES district ID
- 2201170
- Math proficiency
- 11% ▼ -52.00%
- Reading proficiency
- 27% ▼ -46.00%
- Median HH income
- $37,011
- Composite
- 15.78/100
- National rank
- #9271
- State rank
- #69 of 98 in LA
Livability — New Orleans
- Score
- 81/100
- State rank
- #3
- US rank
- #1383
Category grades
Schools grade is shown separately in the Schools card above.
Census & demographics
- Census place
- New Orleans, LA
- County
- Orleans Parish · 338,817 people
- City population
- 338,817
- Metro
- New Orleans-Metairie, LA
- Population (ZIP)
- 25,652
- Household income
- $45,764
- Rent vs Own
- Severe rent burden
- 1988.0
Population outlook (Orleans County) Hauer SSP2
- Today (2025)
- 513,025 people
- By 2030
- 575,781 · +12.2%
- By 2040
- 700,174 · +36.5%
- By 2050
- 826,541 · +61.1%
- By 2075
- 1,123,374 · +119.0%
- By 2100
- 1,355,609 · +164.2%
Race, ethnicity, and origin ACS 2023
- Neighborhood character
- Majority Black (60%)
- Race & ethnicity
- Black 60% White 30% Two or more races 6% Hispanic / Latino 5%
- Common ancestry
- Lithuanian 5% Italian 1% Romanian 1%
- Foreign-born
- 5% · Canada, South Korea
- Languages at home
- 93% English-only · Spanish 3% Other Indo-European 1% French/Haitian/Cajun 1%
Political lean MEDSL · Orleans
- 2024 margin
- Solid D (+67.0) · D 82.2% · R 15.2% · Other 2.7%
- 2008→2024 swing
- +6.7pp toward D · 2008: 60.3pp · 2024: 67.0pp
- All cycles
- 2024: D+67.0 2020: D+68.2 2016: D+66.2 2012: D+62.5 2008: D+60.3
Not yet ingested
- Civics
- —
Market trends
- HPI YoY
- ▼ -177.22%
- Current HPI
- 184.6061
- Rent YoY
- ▲ 2.49%
- Metro
- New Orleans-Metairie, LA
- State GDP YoY
- ▲ 3.29%
- F500 in state
- 10
Industry mix (Fortune 500 HQ in LA)
| Industry | F500 HQs | Revenue |
|---|---|---|
| Telecommunications | 2 | $23B |
|
||
| Utilities | 1 | $12B |
|
||
| Wholesale / Distribution | 1 | $5B |
|
||
| Advertising | 1 | $2B |
|
||
Price history
+458.5% since first listed5 events — show timeline
- 2026-04-30 Price Changed $114,500 AcadianaMLS
- 2026-04-30 Price Changed $114,500 GSREIN
- 2026-04-06 Listed $125,000 GSREIN
- 2026-04-06 Listed $125,000 AcadianaMLS
- 1997-07-03 Sold (Public Records) $20,500 Public Records
Property tax history
+6.2%/yrLatest (2026): $2,824 · -5.4% YoY. Source: county tax records.
Cash-flow waterfall
monthlySold comps — $/sqft
last 12 mo · ≤1 miLoading sold comps…