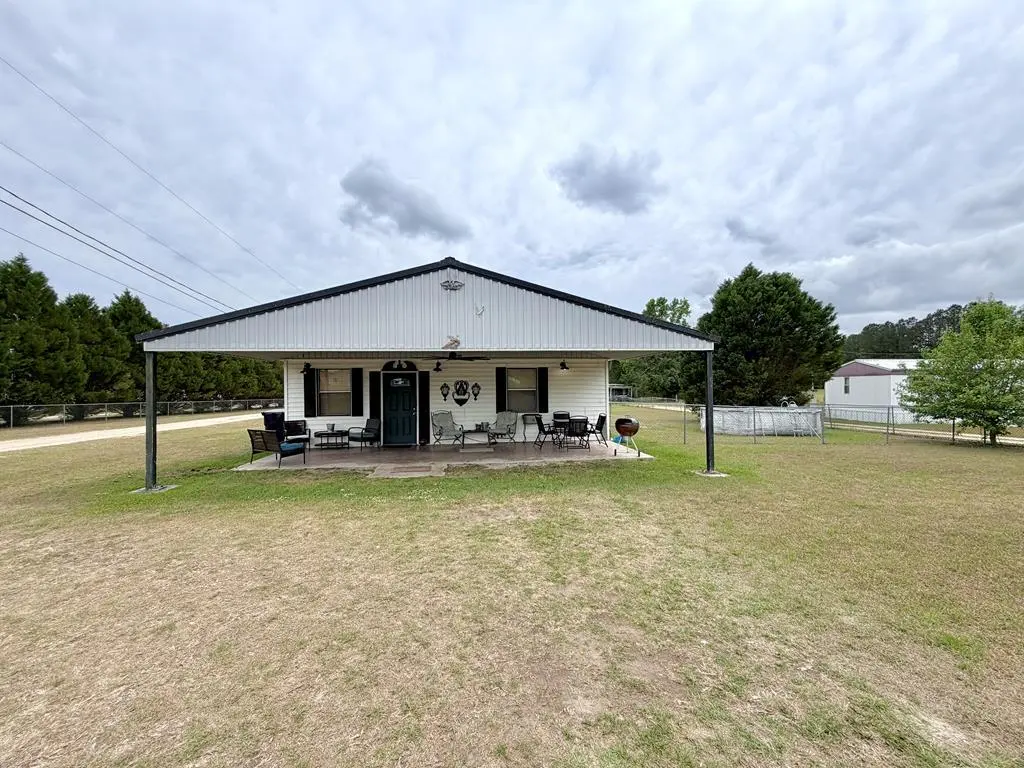
4064 Jordon Ave · Cowarts, AL
Flood risk 1/10 · Minimal
- FEMA flood zone
- X (unshaded)
- Chance of flooding over 30 yrs
- 0.0%
- Est. flood insurance / yr
- $507 – $1,088
Fire risk 5/10 · Moderate
- Est. fire insurance / yr
- $916 – $1,700
Heat risk 8/10 · Major
- Hot days now (above 107°F)
- 7 days/yr
- Hot days in 30 yrs
- 19 days/yr
Wind risk 8/10 · Major
- Chance of severe wind over 30 yrs
- 99.0%
Air-quality risk 2/10 · Minimal
- Unhealthy air days now
- 1 days/yr
- Unhealthy air days in 30 yrs
- 1 days/yr
Risk factors via First Street. Map © Google.
Why this score? — see what drove the B+ grade
The composite is a weighted blend of 9 inputs, each scored 0–100. Each bar is that input's sub-score; the figure is the points it added to the 100-point composite (weight × sub-score).
- Cash flow +30.0/30.0
- 1% rule +10.0/10.0
- DSCR +10.0/10.0
- ARV discount +7.5/15.0
- Appreciation +6.3/10.0
- Livability +3.3/5.0
- Schools +3.1/10.0
- Rent growth +2.5/5.0
- Condition / age +2.5/5.0
$116,000
🖨 Deal sheet 📄 Offer letter ✓ Due diligence
Listing remarks MLS
Adorable One Bedroom Home close to the heart of Cowarts. Tile flooring, new shower, LARGE closet. Efficient and affordable home.
Key facts
- Covered front porch
- Spacious kitchen
- Tile flooring
Tags
Property features AI
Exterior
- Parking: No garage
- Utilities: Public water; Public sewer; Water available; Sewer available
- Home design: Single-family residence; One level
- Construction: Vinyl siding
- Exterior features: Covered porch; Above-ground private pool
Interior
- Kitchen: Dishwasher; Microwave; Range; Range hood; Refrigerator
- Flooring: Tile
- Bathrooms: 1 full bathroom; 1 half bathroom
- Interior features: Ceiling fans; Walk-in closets; Aluminum-framed windows
- Laundry & utility: Laundry located inside
Neighborhood map
What this means for you Summary
Snapshot
- This is a 1-bed/1.5-bath single-family listed at $116k.
Deal economics
- At list price, monthly cash flow is $834 ($10k/yr) — positive.
- The deal already cash-flows at list — no discount required.
- Meets the 1% rule at list price ($2k rent vs $116k).
- Recommended offer: $113k (3.0% below list) — sets the bar for market timing.
Location & tenants
- Location reads 66/100 on livability (#112 in AL) — a middle-class / working-renter tenant base. Strengths: crime A+, cost of living A+, housing A+; Watch: employment D+, health & safety D, amenities F.
- Houston County (rural): math 25% / reading 49% proficiency, ranked #38 of 129 in AL (top 30%) — families likely to look elsewhere, expect single-tenant / working-renter base with shorter leases.
- Zoned schools: Ashford Elementary School (math 21% / reading 51%, grade F, #286 of 627 statewide, top 46%, 625 students, 68% FRL); Ashford Middle School (293 students, 67% FRL); Ashford High School (math 9% / reading 32%, grade F, #159 of 305 statewide, top 53%, 399 students, 62% FRL).
- Market conditions: 16 active listings in the ZIP; 463 units permitted in Houston County in 2024 (96 in 5+ unit buildings).
Forward outlook
- In year one you build about $4k of equity ($802 loan paydown + $3k appreciation (2.7% local appreciation)).
- Houston County population projected at +7% by 2050 — modest demand growth; plan on rents tracking national, not racing it.
- At projected returns (2.7% appreciation + 3.0% rent growth), your $32k cash investment doubles in ~3 years — after that, you're playing with house money.
- By year 9, paydown + projected appreciation supports a ~$33k cash-out refi (75% LTV) — recoverable capital for the next deal without selling this one.
Negotiation context
- It's been on market 54 days — a 3% lower offer ($113k) is reasonable based on typical stale-listing flexibility.
- 4 sale attempts since 5y ago; this cycle's ask has dropped $8k (6%) from the opening price — seller is motivated, your offer sets the floor, not the list.
- Current owner paid $90k; 30% above their basis — modest negotiation headroom, anchor on the comps not their cost.
Risks & watch-outs
- Climate carrying-cost: severe wind risk, 99% chance of damaging wind over 30y; moderate wildfire risk; extreme-heat days projected 7→19/yr by 2055 (HVAC capex compounding) — expect insurance premiums to compound above CPI over the hold.
Questions for the listing agent
- It's been on market 54 days. Have you received any prior offers? Is the seller open to a 3% concession, seller financing, or rate buy-down credit?
- Is there a deadline driving the sale (1031 exchange, divorce, estate, relocation)? That informs how much negotiation room exists.
- Schools are F-rated, which usually means shorter tenancies and higher turnover. Who's the typical renter profile here, and what's been the actual vacancy rate?
- What's the average days-on-market for RENTAL listings here right now (not sales)? A rising rental-DOM trend means longer vacancies and softer asking-rent achievability than the comps imply.
- What's the recent tenant-quality profile in this submarket — average credit score on applications, eviction rate, late-payment / NSF rate, and stable-employment percentage? A property-management company in the area should have these aggregated.
- How much new for-sale + rental construction is in the pipeline within 1–3 miles? Heavy new supply typically softens prices + rents 12–24 months out; constrained supply supports both.
Investment metrics
- 1% rule
- 1.65% ✓
- Cap rate
- 14.92%
- Cash-on-cash
- 30.80%
- DSCR
- 2.37
- GRM
- 5.1
CMA / ARV
- ARV (median comp)
- $75,963
- List price
- $116,000
- Delta
- 52.71%
- Verdict
- OVERPRICED
- Comps
- 5 within 2.0 mi
Projected returns pro-forma
2.66% appreciation · 3.0% rent growth · sell at horizon
- IRR
- 36.0%
- Equity multiple
- 3.00×
- Total profit
- $64,938
- Equity at exit
- $49,937
- IRR
- 36.5%
- Equity multiple
- 5.91×
- Total profit
- $159,338
- Equity at exit
- $75,274
Cash invested: $32,480 (down + closing). Projections, not guarantees.
Landlord ↔ Tenant lean methodology
- Overall (STATE)
- 90 Strongly Landlord-Friendly
- State Alabama
- 90 Strongly Landlord-Friendly · R+15
- County
- — inherits STATE
- City
- — inherits STATE
ZIP-level market 36321
- Home prices YoY
- 1.3%
- Active inventory
- 16
- Price-to-rent
- 5.1×
Monthly cashflow live
- Estimated rent
- $1,911 medium interval (Pro) →
- Mortgage (P&I)
- −$608
- Tax from tax record
- −$19 /mo · $232/yr
- Insurance
- −$48
- HOA
- −$0
- Vacancy / Maint / Mgmt
- −$401
- Net cashflow
- $834
Break-even live
UW: 25.0% down · 7.5% · 30yr · 1.5% tax · 5.0% vac · 8.0% maint · 8.0% mgmt
Financing live
Cash to close
- Down payment
- $29,000
- Closing costs
- $3,480
- Reserves months
- —
- Total cash needed
- —
Loan-product check · same deal, 3 products live
Conventional
25% down · 7.5% · 30yr
- Down + closing
- —
- Monthly P&I
- —
- Monthly cashflow
- —
- DSCR
- —
- Eligible?
- —
Personal DTI + credit; lowest rate.
DSCR
20% down · 8.5% · 30yr
- Down + closing
- —
- Monthly P&I
- —
- Monthly cashflow
- —
- DSCR
- —
- Eligible?
- —
No personal income docs; deal must DSCR.
Hard money
10% down · 12.0% · 12mo
- Down + closing
- —
- Monthly P&I
- —
- Monthly cashflow
- —
- DSCR
- —
- Eligible?
- —
Short-term bridge; refi at stabilization.
Listing history 23 events
-
2026-06-19days on market $116,000 Active 54 DOM
-
2026-06-18days on market $116,000 Active 53 DOM
-
2026-06-17days on market $116,000 Active 52 DOM
-
2026-06-16days on market $116,000 Active 51 DOM
-
2026-06-15days on market $116,000 Active 50 DOM
-
2026-06-14days on market $116,000 Active 48 DOM
-
2026-06-12days on market $116,000 Active 47 DOM
-
2026-06-09days on market $116,000 Active 44 DOM
-
2026-06-08days on market $116,000 Active 43 DOM
-
2026-06-07days on market $116,000 Active 42 DOM
-
2026-06-05days on market $116,000 Active 39 DOM
-
2026-06-03days on market $116,000 Active 38 DOM
-
2026-06-03price $116,000 Active 37 DOM
-
2026-06-02days on market $124,000 Active 37 DOM
-
2026-06-01days on market $124,000 Active 36 DOM
-
2026-05-31days on market $124,000 Active 35 DOM
-
2026-05-30days on market $124,000 Active 34 DOM
-
2026-04-27$124,000 Active 1229-char remark
-
2026-04-02$115,000 Active 128-char remark
Show marketing remark (128 chars)
Adorable One Bedroom Home close to the heart of Cowarts. Tile flooring, new shower, LARGE closet. Efficient and affordable home.
-
2024-06-10soldstatus $89,500
-
2023-09-19soldstatus $66,600
-
2021-01-10$68,900
-
2021-01-10$68,900
ⓘ Source: listings_history table (triggers on properties + properties_extension) + one-shot
backfill from property_details.listing_events for pre-trigger history.
Tax reassessment forecast AL · Resets to sale price
- Current annual tax
- $232 · $19/mo
- Projected year-2 tax
- $476 · $40/mo
- Expected delta
- +$243/yr (+$20/mo · 104.7%)
ⓘ Screening estimate from a state-policy table — verify with the county assessor before closing.
Climate risk First Street
- Flood 1/10 Low FEMA zone X (unshaded) · 0% chance over 30 yrs
- Wildfire 5/10 Major
- Heat 8/10 Severe 7 d/yr ≥107°F today · 19 d/yr by 30 yrs out
- Wind 8/10 Severe 99% chance of damaging wind over 30 yrs
- Air quality 2/10 Low 1 unhealthy d/yr today · 1 by 30 yrs out
Nearby sold comps map
Loading sold comps map…
Walkable amenities ~0.75 mi
Loading nearby amenities…
Taxation est. · year 1
- Rental income
- $22,933
- − Mortgage interest
- −$6,498
- − Property taxes
- −$232
- − Insurance
- −$580
- − Repairs & maintenance
- −$1,835
- − Management
- −$1,835
- − Depreciation
- −$3,375
- Taxable income
- $8,579
- Est. tax owed @ 24.0%
- −$2,059
- After-tax cash flow
- $7,946/yr
For passive investors: Depreciation is non-cash, so a rental often shows a tax loss while cash-flowing — sheltering income. Rental losses are passive: they offset passive income freely, and up to $25,000/yr can offset ordinary (W-2) income if you actively participate and your MAGI is under $100k (phasing out to $0 by $150k); unused losses carry forward. On sale, claimed depreciation is recaptured at up to 25%, and gains may owe capital-gains tax (a 1031 exchange can defer both). Figures are a year-1 estimate at your 24.0% rate — not tax advice; consult a CPA.
Schools (NCES district)
- District
- Houston County
- NCES district ID
- 0101770
- Math proficiency
- 25% ▼ -33.00%
- Reading proficiency
- 49% ▼ -1.00%
- Median HH income
- $40,530
- Composite
- 31.01/100
- National rank
- #6092
- State rank
- #38 of 129 in AL
Livability — Cowarts
- Score
- 66/100
- State rank
- #112
- US rank
- #12159
Category grades
Schools grade is shown separately in the Schools card above.
Census & demographics
- Census place
- Cowarts, AL
- City population
- 2,159
- Population (ZIP)
- 2,159
Population outlook (Houston County) Hauer SSP2
- Today (2025)
- 110,280 people
- By 2030
- 112,668 · +2.2%
- By 2040
- 116,149 · +5.3%
- By 2050
- 117,805 · +6.8%
- By 2075
- 118,577 · +7.5%
- By 2100
- 110,940 · +0.6%
Race, ethnicity, and origin ACS 2023
- Neighborhood character
- Predominantly White (77%)
- Race & ethnicity
- White 77% Black 10% Two or more races 7% Hispanic / Latino 5% Native American 1%
- Common ancestry
- Italian 1% Lithuanian 1% Portuguese 1%
- Foreign-born
- 2% · Canada
- Languages at home
- 97% English-only · Spanish 3%
Political lean MEDSL · Houston
- 2024 margin
- Solid R (+47.8) · D 25.7% · R 73.5%
- 2008→2024 swing
- -7.0pp toward R · 2008: -40.8pp · 2024: -47.8pp
- All cycles
- 2024: R+47.8 2020: R+42.7 2016: R+47.6 2012: R+40.3 2008: R+40.8
Not yet ingested
- Civics
- —
Market trends
- HPI YoY
- ▲ 2.66%
- Current HPI
- 201.1624
- Rent YoY
- —
- Metro
- —
- State GDP YoY
- ▲ 2.94%
- F500 in state
- 4
Industry mix (Fortune 500 HQ in AL)
| Industry | F500 HQs | Revenue |
|---|---|---|
| Financial Services | 1 | $8B |
|
||
| Healthcare | 1 | $5B |
|
||
Price history
+68.4% since first listed7 events — show timeline
- 2026-06-02 Price Changed $116,000 SAMLS
- 2026-04-27 Listed $124,000 SAMLS
- 2026-04-02 Listed $115,000 Fizber.com
- 2024-06-10 Sold (Public Records) $89,500 Public Records
- 2023-09-19 Sold (Public Records) $66,600 Public Records
- 2021-01-10 Listed $68,900 WBR
- 2021-01-10 Listed $68,900 MAAR
Property tax history
-3.8%/yrLatest (2025): $232 · -54.3% YoY. Source: county tax records.
Cash-flow waterfall
monthlySold comps — $/sqft
last 12 mo · ≤1 miLoading sold comps…