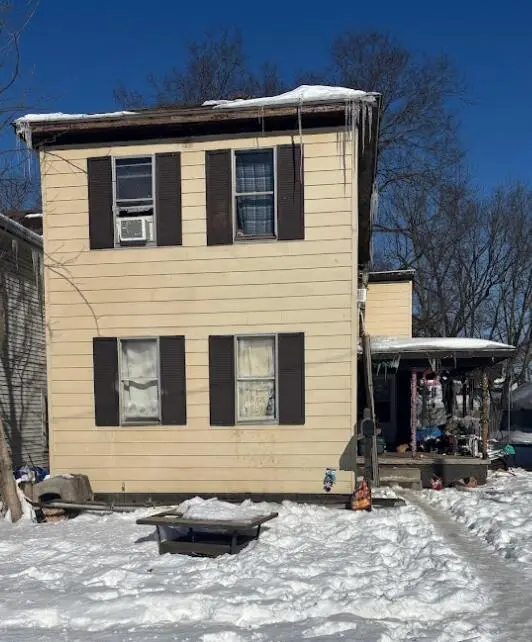
1828 W Washington St · Springfield, OH
Flood risk 1/10 · Minimal
- FEMA flood zone
- X (unshaded)
- Chance of flooding over 30 yrs
- 0.0%
- Est. flood insurance / yr
- $473 – $860
Fire risk 1/10 · Minimal
- Est. fire insurance / yr
- $713 – $1,323
Heat risk 3/10 · Minor
- Hot days now (above 100°F)
- 7 days/yr
- Hot days in 30 yrs
- 18 days/yr
Wind risk 2/10 · Minimal
- Chance of severe wind over 30 yrs
- —
Air-quality risk 3/10 · Minor
- Unhealthy air days now
- 2 days/yr
- Unhealthy air days in 30 yrs
- 3 days/yr
Risk factors via First Street. Map © Google.
Why this score? — see what drove the B grade
The composite is a weighted blend of 9 inputs, each scored 0–100. Each bar is that input's sub-score; the figure is the points it added to the 100-point composite (weight × sub-score).
- Cash flow +30.0/30.0
- ARV discount +15.0/15.0
- 1% rule +10.0/10.0
- DSCR +10.0/10.0
- Livability +2.8/5.0
- Rent growth +2.5/5.0
- Condition / age +2.5/5.0
- Schools +1.9/10.0
- Appreciation +0.0/10.0
$59,000
🖨 Deal sheet (PDF) 📄 Offer letter ✓ Due diligence
Listing remarks MLS
Great investment opportunity with this 3 bedroom home currently being rented so please do not disturb the tenants. This property can be sold individually or as part of a package. Please contact agent for details.
Key facts
- 5,662 sq ft lot
- Built 1891
- Listed 123 days
Neighborhood map
What this means for you Summary
Snapshot
- This is a 3-bed/1.0-bath single-family listed at $59k.
Deal economics
- At list price, monthly cash flow is $895 ($11k/yr) — positive.
- The deal already cash-flows at list — no discount required.
- Meets the 1% rule at list price ($2k rent vs $59k).
- Recommended offer: $52k (12.0% below list) — sets the bar for market timing.
- Cap rate 24.5% vs local median 4.7% in Springfield — top-decile yield for the area; either an underpriced asset or a hidden risk that comps aren't pricing in. Stress-test before assuming the spread holds.
Location & tenants
- Location reads 56/100 on livability (#1,108 in OH) — a working-class tenant base; expect higher turnover. Strengths: cost of living A+, housing A+; Watch: crime F, amenities F, commute F.
- Springfield City School District (urban): math 20% / reading 27% proficiency, ranked #616 of 656 in OH (top 94%) — low school quality limits family demand, transient renter base, plan for 1-2y turnover; 75% free/reduced lunch — lower-income household profile, screen leases tightly.
- Zoned schools: Snyder Park Elementary School (math 27% / reading 32%, grade F, #1,158 of 1,584 statewide, top 75%, 301 students, 0% FRL); Hayward Middle School (math 15% / reading 14%, grade F, #630 of 654 statewide, top 97%, 339 students, 0% FRL); Springfield High School (math 17% / reading 31%, grade F, #665 of 781 statewide, top 85%, 1,516 students, 0% FRL) — zoned schools average 0% FRL vs 75% district-wide (75 pts lower); this property's tenant base skews higher-income than the district average.
- Market conditions: 45 active listings in the ZIP; 8 comparable units currently listed for rent nearby; rentals leasing fast (median 13d on market — plan ~1-2 weeks tenant-placement turnaround); lower-income renter base — watch delinquency; 232 units permitted in Clark County in 2024 (116 in 5+ unit buildings).
- At $1,649/mo this rent would consume 47% of the median local household income ($42k/yr) (locally 684% of renters already pay >50% of income on rent) — very limited rent-growth headroom before tenants either downsize or default.
Forward outlook
- Local home prices are declining (-3.0%/yr); year-one equity from $408 of loan paydown is wiped out by about $2k of value loss. Plan a longer hold.
- Clark County population projected at -16% by 2050 — secular population decline; favor cash flow + early exit over multi-decade hold.
- At projected returns (-3.0% appreciation + 3.0% rent growth), your $17k cash investment doubles in ~2 years — after that, you're playing with house money.
Negotiation context
- It's been on market 124 days — a 12% lower offer ($52k) is reasonable based on typical stale-listing flexibility.
- 4 sale attempts since 21y ago; this cycle's ask has dropped $6k (9%) from the opening price — seller is motivated, your offer sets the floor, not the list.
- Current owner paid $12k; list at $59k implies a 413% gain — meaningful room to come down on a strong offer.
Risks & watch-outs
- Watch-outs: built in 1891 — expect roof / HVAC / electrical / plumbing capex.
Questions for the listing agent
- It's been on market 124 days. Have you received any prior offers? Is the seller open to a 12% concession, seller financing, or rate buy-down credit?
- Built in 1891 — when were the roof, HVAC, electrical panel, plumbing, and water heater last replaced?
- Why hasn't it sold? Are there any deal-killer items the seller is aware of (foundation, flood, title, zoning, code violations)?
- Is there a deadline driving the sale (1031 exchange, divorce, estate, relocation)? That informs how much negotiation room exists.
- Crime grade is F in this area — have there been break-ins, vandalism, or insurance claims at this property in the last 3 years? What carrier currently insures it and at what premium?
- What's the average days-on-market for RENTAL listings here right now (not sales)? A rising rental-DOM trend means longer vacancies and softer asking-rent achievability than the comps imply.
- What's the recent tenant-quality profile in this submarket — average credit score on applications, eviction rate, late-payment / NSF rate, and stable-employment percentage? A property-management company in the area should have these aggregated.
- How much new for-sale + rental construction is in the pipeline within 1–3 miles? Heavy new supply typically softens prices + rents 12–24 months out; constrained supply supports both.
Investment metrics
- 1% rule
- 2.79% ✓
- Cap rate
- 24.50%
- Cash-on-cash
- 65.03%
- DSCR
- 3.89
- GRM
- 3.0
CMA / ARV
- ARV (median comp)
- $92,403
- List price
- $59,000
- Delta
- -36.15%
- Verdict
- UNDERPRICED
- Comps
- 20 within 1.0 mi
Show comp detail 12 sales within ~0.75 mi
| Address | Dist | Beds/Ba | Sqft | Sold | Price | $/sf | Match |
|---|---|---|---|---|---|---|---|
| 106 Walter St | 0.10mi | 3/1.5 | 1,536 (-5%) | 1mo | $45,000 | $29 | 84 |
| 1417 W Main St | 0.35mi | 3/1.0 | 1,668 (+4%) | 3mo | $142,500 | $85 | 75 |
| 1537 W Pleasant St | 0.34mi | 3/1.0 | 1,463 (-9%) | 2mo | $74,000 | $51 | 67 |
| 1708 W High St | 0.13mi | 4/2.0 (+1) | 1,512 (-6%) | 10mo | $149,500 | $99 | 67 |
| 317 Seever St | 0.19mi | 4/2.0 (+1) | 1,509 (-6%) | 7mo | $85,000 | $56 | 66 |
| 1618 W Pleasant St | 0.28mi | 3/1.5 | 1,432 (-11%) | 1mo | $78,000 | $54 | 65 |
| 1815 Broadway St | 0.44mi | 3/2.0 | 1,650 (+2%) | 8mo | $155,000 | $94 | 65 |
| 1374 W Mulberry St | 0.40mi | 4/1.0 (+1) | 1,519 (-6%) | 2mo | $70,000 | $46 | 65 |
| 1865 Overlook Dr | 0.50mi | 3/2.0 | 1,627 (+1%) | 9mo | $165,000 | $101 | 63 |
| 1933 Maiden Ln | 0.37mi | 3/2.0 | 1,418 (-12%) | 9mo | $165,000 | $116 | 51 |
| 1951 Harshman Blvd | 0.51mi | 2/1.0 (-1) | 1,394 (-14%) | 1mo | $175,000 | $126 | 48 |
| 1230 W Pleasant St | 0.54mi | 4/2.5 (+1) | 1,804 (+12%) | 3mo | $159,900 | $89 | 42 |
Match score weights: distance 35% · size 25% · config 20% · recency 20%. Top-matched comps best support the ARV.
Projected returns pro-forma
-3.0% appreciation · 3.0% rent growth · sell at horizon
- IRR
- 64.2%
- Equity multiple
- 3.87×
- Total profit
- $47,484
- Equity at exit
- $8,797
- IRR
- 68.6%
- Equity multiple
- 7.95×
- Total profit
- $114,870
- Equity at exit
- $5,101
Cash invested: $16,520 (down + closing). Projections, not guarantees.
Landlord ↔ Tenant lean methodology
- Overall (STATE)
- 73 Landlord-Friendly
- State Ohio
- 73 Landlord-Friendly · R+6
- County
- — inherits STATE
- City
- — inherits STATE
ZIP-level market 45506
- Home prices YoY
- -14.1%
- Active inventory
- 45
- Price-to-rent
- 3.0×
Monthly cashflow live
- Estimated rent
- $1,649 high interval (Pro) →
- Mortgage (P&I)
- −$309
- Tax from tax record
- −$73 /mo · $878/yr
- Insurance
- −$25
- HOA
- −$0
- Vacancy / Maint / Mgmt
- −$346
- Net cashflow
- $895
Break-even live
Sensitivity live
| Price | -10% $929 | -5% $912 | +0% $895 | +5% $879 | +10% $862 |
|---|---|---|---|---|---|
| Rent | -10% $765 | -5% $830 | +0% $895 | +5% $960 | +10% $1,026 |
| Rate | -1.0pp $925 | -0.5pp $910 | base $895 | +0.5pp $880 | +1.0pp $864 |
UW: 25.0% down · 7.5% · 30yr · 1.5% tax · 5.0% vac · 8.0% maint · 8.0% mgmt
Financing live
Cash to close
- Down payment
- $14,750
- Closing costs
- $1,770
- Reserves months
- —
- Total cash needed
- —
Loan-product check · same deal, 3 products live
Conventional
25% down · 7.5% · 30yr
- Down + closing
- —
- Monthly P&I
- —
- Monthly cashflow
- —
- DSCR
- —
- Eligible?
- —
Personal DTI + credit; lowest rate.
DSCR
20% down · 8.5% · 30yr
- Down + closing
- —
- Monthly P&I
- —
- Monthly cashflow
- —
- DSCR
- —
- Eligible?
- —
No personal income docs; deal must DSCR.
Hard money
10% down · 12.0% · 12mo
- Down + closing
- —
- Monthly P&I
- —
- Monthly cashflow
- —
- DSCR
- —
- Eligible?
- —
Short-term bridge; refi at stabilization.
Rent comps 8 comps
| Address | Beds | Baths | Sqft | Rent | $/sqft | DOM | Units | Dist |
|---|---|---|---|---|---|---|---|---|
| 307 N Isabella St Unit 309 Springfield, OH | 3.0 | 1.5 | 1300 | $1,400 | $1.08 | 4d | 1 | 0.65mi |
| 356 S Yellow Springs St Springfield, OH | 4.0 | 2.0 | 1606 | $1,825 | $1.14 | 13d | 1 | 1.10mi |
| 302 S Yellow Springs St Springfield, OH | 4.0 | 2.0 | 1456 | $1,845 | $1.27 | 13d | 1 | 1.11mi |
| 523 W Mulberry St Springfield, OH | 4.0 | 2.0 | 1456 | $1,825 | $1.25 | 13d | 1 | 1.12mi |
| 220 S Yellow Springs St Springfield, OH | 4.0 | 2.0 | 1456 | $1,645 | $1.13 | 25d | 1 | 1.13mi |
| 524 W Pleasant St Springfield, OH | 4.0 | 2.0 | 1456 | $1,645 | $1.13 | 13d | 1 | 1.13mi |
| 306 S Plum St Springfield, OH | 4.0 | 2.0 | 1352 | $1,700 | $1.26 | 45d | 1 | 1.25mi |
| 545 W Grand Ave Springfield, OH | 4.0 | 2.0 | 1456 | $1,595 | $1.10 | 5d | 1 | 1.25mi |
Listing history 26 events
-
2026-06-22days on market $59,000 Active 124 DOM
-
2026-06-19days on market $59,000 Active 121 DOM
-
2026-06-18days on market $59,000 Active 120 DOM
-
2026-06-17days on market $59,000 Active 119 DOM
-
2026-06-16days on market $59,000 Active 118 DOM
-
2026-06-15days on market $59,000 Active 117 DOM
-
2026-06-14days on market $59,000 Active 115 DOM
-
2026-06-12days on market $59,000 Active 114 DOM
-
2026-06-09days on market $59,000 Active 111 DOM
-
2026-06-08days on market $59,000 Active 110 DOM
-
2026-06-07days on market $59,000 Active 109 DOM
-
2026-06-05days on market $59,000 Active 106 DOM
-
2026-06-02days on market $59,000 Active 104 DOM
-
2026-06-01pricedays on market $59,000 Active 103 DOM
-
2026-05-31days on market $60,000 Active 102 DOM
-
2026-05-30days on market $60,000 Active 101 DOM
-
2026-03-08price $60,000 212-char remark
Show marketing remark (212 chars)
Great investment opportunity with this 3 bedroom home currently being rented so please do not disturb the tenants. This property can be sold individually or as part of a package. Please contact agent for details.
-
2026-03-02status Active 212-char remark
Show marketing remark (212 chars)
Great investment opportunity with this 3 bedroom home currently being rented so please do not disturb the tenants. This property can be sold individually or as part of a package. Please contact agent for details.
-
2026-02-20status Pending 212-char remark
Show marketing remark (212 chars)
Great investment opportunity with this 3 bedroom home currently being rented so please do not disturb the tenants. This property can be sold individually or as part of a package. Please contact agent for details.
-
2026-02-08$65,000 Active 212-char remark
Show marketing remark (212 chars)
Great investment opportunity with this 3 bedroom home currently being rented so please do not disturb the tenants. This property can be sold individually or as part of a package. Please contact agent for details.
-
2018-03-01soldstatus $11,500 125-char remark
Show marketing remark (125 chars)
Wonderful fixer-upper oozing with potential. This property is perfect for an investor or first time home buyer with a vision.
-
2018-02-14$11,500 125-char remark
Show marketing remark (125 chars)
Wonderful fixer-upper oozing with potential. This property is perfect for an investor or first time home buyer with a vision.
-
2016-11-04historical
-
2005-04-22$25,900
-
1995-06-26soldstatus $28,000
-
1995-06-26soldstatus $28,000
ⓘ Source: listings_history table (triggers on properties + properties_extension) + one-shot
backfill from property_details.listing_events for pre-trigger history.
Tax reassessment forecast OH · Partial reset (capped growth)
- Current annual tax
- $878 · $73/mo
- Projected year-2 tax
- $899 · $75/mo
- Expected delta
- +$21/yr (+$2/mo · 2.4%)
ⓘ Screening estimate from a state-policy table — verify with the county assessor before closing.
Climate risk First Street
- Flood 1/10 Low FEMA zone X (unshaded) · 0% chance over 30 yrs
- Wildfire 1/10 Low
- Heat 3/10 Moderate 7 d/yr ≥100°F today · 18 d/yr by 30 yrs out
- Wind 2/10 Low
- Air quality 3/10 Moderate 2 unhealthy d/yr today · 3 by 30 yrs out
Nearby sold comps map
Loading sold comps map…
Walkable amenities ~0.75 mi
Loading nearby amenities…
Taxation est. · year 1
- Rental income
- $19,783
- − Mortgage interest
- −$3,305
- − Property taxes
- −$878
- − Insurance
- −$295
- − Repairs & maintenance
- −$1,583
- − Management
- −$1,583
- − Depreciation
- −$1,716
- Taxable income
- $10,424
- Est. tax owed @ 24.0%
- −$2,502
- After-tax cash flow
- $8,241/yr
For passive investors: Depreciation is non-cash, so a rental often shows a tax loss while cash-flowing — sheltering income. Rental losses are passive: they offset passive income freely, and up to $25,000/yr can offset ordinary (W-2) income if you actively participate and your MAGI is under $100k (phasing out to $0 by $150k); unused losses carry forward. On sale, claimed depreciation is recaptured at up to 25%, and gains may owe capital-gains tax (a 1031 exchange can defer both). Figures are a year-1 estimate at your 24.0% rate — not tax advice; consult a CPA.
Schools (NCES district)
- District
- Springfield City School District
- NCES district ID
- 3904481
- Math proficiency
- 20% ▼ -16.00%
- Reading proficiency
- 27% ▼ -12.00%
- Median HH income
- $32,541
- Composite
- 19.12/100
- National rank
- #8834
- State rank
- #616 of 656 in OH
Livability — Springfield
- Score
- 56/100
- State rank
- #1108
- US rank
- #22551
Category grades
Schools grade is shown separately in the Schools card above.
Census & demographics
- Census place
- Springfield, OH
- County
- Clark County · 33,261 people
- City population
- 33,261
- Metro
- Springfield, OH
- Population (ZIP)
- 13,435
- Household income
- $42,104
- Rent vs Own
- Severe rent burden
- 684.0
Population outlook (Clark County) Hauer SSP2
- Today (2025)
- 130,703 people
- By 2030
- 126,952 · -2.9%
- By 2040
- 118,344 · -9.5%
- By 2050
- 109,590 · -16.2%
- By 2075
- 89,464 · -31.6%
- By 2100
- 68,810 · -47.4%
Race, ethnicity, and origin ACS 2023
- Neighborhood character
- Diverse neighborhood (Simpson 0.62)
- Race & ethnicity
- White 53% Black 30% Two or more races 10% Hispanic / Latino 8%
- Hispanic origin (detail)
- Mexican 4% Puerto Rican 1%
- Common ancestry
- Serbian 2% Romanian 1% Iranian 1%
- Foreign-born
- 4% · Canada
- Languages at home
- 95% English-only · Spanish 4% Other Asian/Pacific 1%
Political lean MEDSL · Clark
- 2024 margin
- Strong R (+29.5) · D 34.8% · R 64.3%
- 2008→2024 swing
- -27.0pp toward R · 2008: -2.5pp · 2024: -29.5pp
- All cycles
- 2024: R+29.5 2020: R+23.3 2016: R+19.5 2012: R+1.8 2008: R+2.5
Not yet ingested
- Civics
- —
Market trends
- HPI YoY
- ▼ -46.97%
- Current HPI
- 286.2883
- Rent YoY
- —
- Metro
- Springfield, OH
- State GDP YoY
- ▲ 1.98%
- F500 in state
- 48
Industry mix (Fortune 500 HQ in OH)
| Industry | F500 HQs | Revenue |
|---|---|---|
| Insurance | 3 | $145B |
|
||
| Industrial Machinery | 3 | $49B |
|
||
| Financial Services | 3 | $24B |
|
||
| Consumer Goods | 2 | $93B |
|
||
| Aerospace / Defense | 2 | $47B |
|
||
| Utilities | 2 | $33B |
|
||
Price history
+114.3% since first listed10 events — show timeline
- 2026-03-08 Price Changed $60,000 WRIST
- 2026-03-02 Relisted — WRIST
- 2026-02-20 Pending — WRIST
- 2026-02-08 Listed $65,000 WRIST
- 2018-03-01 Sold (MLS) $11,500 WRIST
- 2018-02-14 Listed $11,500 WRIST
- 2016-11-04 Listing Removed — WRIST
- 2005-04-22 Listed $25,900 WRIST
- 1995-06-26 Sold (Public Records) $28,000 Public Records
- 1995-06-26 Sold (Public Records) $28,000 Public Records
Property tax history
+1.3%/yrLatest (2025): $878 · +14.7% YoY. Source: county tax records.
Cash-flow waterfall
monthlySold comps — $/sqft
last 12 mo · ≤1 miLoading sold comps…