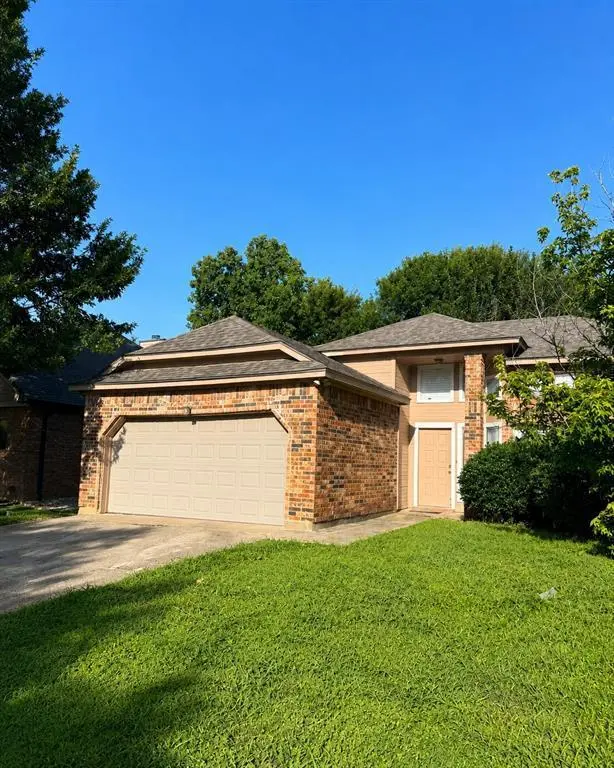
6014 Fern Meadow Rd · Arlington, TX
Flood risk 1/10 · Minimal
- FEMA flood zone
- X (unshaded)
- Chance of flooding over 30 yrs
- 0.0%
- Est. flood insurance / yr
- $507 – $1,088
Fire risk 2/10 · Minimal
- Est. fire insurance / yr
- $1,222 – $2,270
Heat risk 7/10 · Major
- Hot days now (above 110°F)
- 7 days/yr
- Hot days in 30 yrs
- 24 days/yr
Wind risk 6/10 · Moderate
- Chance of severe wind over 30 yrs
- 27.0%
Air-quality risk 3/10 · Minor
- Unhealthy air days now
- 2 days/yr
- Unhealthy air days in 30 yrs
- 3 days/yr
Risk factors via First Street. Map © Google.
Why this score? — see what drove the C+ grade
The composite is a weighted blend of 9 inputs, each scored 0–100. Each bar is that input's sub-score; the figure is the points it added to the 100-point composite (weight × sub-score).
- Cash flow +21.0/30.0
- ARV discount +15.0/15.0
- DSCR +6.7/10.0
- 1% rule +6.6/10.0
- Schools +4.6/10.0
- Livability +3.9/5.0
- Condition / age +2.5/5.0
- Rent growth +2.3/5.0
- Appreciation +0.0/10.0
$185,000
🖨 Deal sheet 📄 Offer letter ✓ Due diligence
Listing remarks MLS
HOME IS A FORECLOSURE. BUYER TO VERIFY ALL MEASUREMENTS AND SCHOOLS. HOME IS AS-IS NO SELLERS DISCLOSURE OR SURVEY. SPLLIT BEDROOMS AND VAULTED CEILING IN LIVING ROOM. COVERED PATIO IN BACKYARD.
Key facts
- Spacious backyard
- Roof replaced
- Conveniently located
Tags
Property features AI
Finance
- Financial info: Listing terms: Cash
- HOA & community: No association
Exterior
- Parking: Attached 2-car garage; 2 covered parking spaces; Garage faces front
- Utilities: City water; City sewer; Concrete; Curbs
- Home design: Single family residence; Residential property; Entry level: One; Subdivision: Green Leaf Add
- Construction: Brick construction; Composition roof; Slab foundation; Built in 1985
- Exterior features: Covered porch(es)
Interior
- Kitchen: Dishwasher; Gas range; Microwave; Refrigerator
- Bedrooms: Primary bedroom on main level (approx. 14 x 12); Total of 3 bedrooms
- Flooring: Carpet; Tile
- Bathrooms: 2 full bathrooms
- Heating & cooling: Central air; Ceiling fan(s)
- Interior features: High-speed internet available; 1 living area; 1 dining area; One-level layout; Fireplace with brick surround
- Laundry & utility: Full-size washer/dryer area
Neighborhood map
What this means for you Summary
Snapshot
- This is a 3-bed/2.0-bath single-family listed at $185k.
Deal economics
- At list price, monthly cash flow is $262 ($3k/yr) — positive.
- The deal already cash-flows at list — no discount required.
- Meets the 1% rule at list price ($2k rent vs $185k).
- Cap rate 8.0% vs local median 3.7% in Arlington — top-decile yield for the area; either an underpriced asset or a hidden risk that comps aren't pricing in. Stress-test before assuming the spread holds.
Location & tenants
- Location reads 78/100 on livability (#75 in TX, #2,697 nationally) — a middle-class / working-renter tenant base. Strengths: amenities A+, cost of living A+, housing A+; Watch: crime F, commute F.
- Mansfield ISD (suburban): math 47% / reading 53% proficiency, ranked #125 of 826 in TX (top 15%) — acceptable for families but not a draw, mixed tenant base, ~2y average lease.
- Zoned schools: Glenn Harmon El (math 17% / reading 22%, grade F, #3,583 of 4,322 statewide, top 86%, 430 students, 87% FRL) — zoned schools average 87% FRL vs 35% district-wide (52 pts higher); higher-poverty schools than district average — tighter screening recommended.
- Zoned-school proficiency averages 20% at this address vs 50% district-wide (-30 pts) — the specific schools serving this property underperform the Mansfield ISD average; the district grade overstates school quality for this exact location.
- Market conditions: Rents soft (-0.8%/yr); 205 active listings in the ZIP; 40 comparable units currently listed for rent nearby; rentals at typical pace (median 23d on market — plan ~3-4 weeks tenant-placement turnaround); solid renter incomes; 18,938 units permitted in Tarrant County in 2024 (8,336 in 5+ unit buildings).
Forward outlook
- Local home prices are declining (-3.0%/yr); year-one equity from $1k of loan paydown is wiped out by about $6k of value loss. Plan a longer hold.
- Tarrant County population projected at +41% by 2050 — long-run rental-demand tailwind backs the buy-and-hold thesis.
Negotiation context
- Only 1 days on market — expect competitive offers; lowballing is unlikely to land.
- 3 sale attempts since 21y ago with the ask held roughly flat each time — persistent listings suggest the price (not the market) is what's stuck; bring a comps-based counter.
Risks & watch-outs
- Watch-outs: property tax is 2.5% of price.
- Climate carrying-cost: major wind risk, 27% chance of damaging wind over 30y; extreme-heat days projected 7→24/yr by 2055 (HVAC capex compounding) — expect insurance premiums to compound above CPI over the hold.
Questions for the listing agent
- Property tax is high relative to price — has the assessment been appealed recently, and will the sale trigger a re-assessment?
- Is there a deadline driving the sale (1031 exchange, divorce, estate, relocation)? That informs how much negotiation room exists.
- Schools are D-rated, which usually means shorter tenancies and higher turnover. Who's the typical renter profile here, and what's been the actual vacancy rate?
- Crime grade is F in this area — have there been break-ins, vandalism, or insurance claims at this property in the last 3 years? What carrier currently insures it and at what premium?
- What's the average days-on-market for RENTAL listings here right now (not sales)? A rising rental-DOM trend means longer vacancies and softer asking-rent achievability than the comps imply.
- What's the recent tenant-quality profile in this submarket — average credit score on applications, eviction rate, late-payment / NSF rate, and stable-employment percentage? A property-management company in the area should have these aggregated.
- How much new for-sale + rental construction is in the pipeline within 1–3 miles? Heavy new supply typically softens prices + rents 12–24 months out; constrained supply supports both.
Investment metrics
- 1% rule
- 1.16% ✓
- Cap rate
- 7.99%
- Cash-on-cash
- 6.08%
- DSCR
- 1.27
- GRM
- 7.2
CMA / ARV
- ARV (on-the-fly)
- $283,608
- Comps found
- 12
Show comp detail 12 sales within ~0.75 mi
| Address | Dist | Beds/Ba | Sqft | Sold | Price | $/sf | Match |
|---|---|---|---|---|---|---|---|
| 945 Tennessee Trl | 0.32mi | 3/2.0 | 1,408 (+0%) | 1mo | $285,000 | $202 | 84 |
| 6111 Maple Leaf Dr | 0.11mi | 3/2.0 | 1,546 (+10%) | 2mo | $349,990 | $226 | 76 |
| 920 Danforth Pl | 0.21mi | 3/2.0 | 1,518 (+8%) | 0mo | $270,000 | $178 | 76 |
| 6115 Meadowside Trl | 0.11mi | 3/2.0 | 1,595 (+14%) | 1mo | $249,900 | $157 | 72 |
| 304 Valley Forge Ln | 0.59mi | 3/2.0 | 1,393 (-1%) | 1mo | $299,500 | $215 | 70 |
| 800 Wyndham Pl | 0.34mi | 3/2.5 | 1,496 (+7%) | 2mo | $275,000 | $184 | 70 |
| 6207 Patriotic Ct | 0.43mi | 3/2.0 | 1,301 (-7%) | 2mo | $285,000 | $219 | 66 |
| 702 W Lynn Creek Dr | 0.55mi | 3/2.0 | 1,335 (-5%) | 1mo | $269,900 | $202 | 65 |
| 950 White Dove Dr | 0.52mi | 3/2.0 | 1,318 (-6%) | 1mo | $289,400 | $220 | 64 |
| 115 Moss Hill Dr | 0.35mi | 3/2.0 | 1,588 (+13%) | 1mo | $275,000 | $173 | 61 |
| 819 Lovingham Dr | 0.25mi | 3/6.5 | 1,578 (+12%) | 0mo | $249,000 | $158 | 49 |
| 508 Valley Mills Dr | 0.75mi | 3/2.0 | 1,211 (-14%) | 2mo | $285,000 | $235 | 41 |
Match score weights: distance 35% · size 25% · config 20% · recency 20%. Top-matched comps best support the ARV.
Projected returns pro-forma
-3.0% appreciation · 0.0% rent growth · sell at horizon
- IRR
- -10.7%
- Equity multiple
- 0.62×
- Total profit
- $-19,431
- Equity at exit
- $27,584
- IRR
- -6.8%
- Equity multiple
- 0.63×
- Total profit
- $-19,190
- Equity at exit
- $15,995
Cash invested: $51,800 (down + closing). Projections, not guarantees.
Landlord ↔ Tenant lean methodology
- Overall (STATE)
- 87 Strongly Landlord-Friendly
- State Texas
- 87 Strongly Landlord-Friendly · R+5
- County
- — inherits STATE
- City
- — inherits STATE
ZIP-level market 76017
- Rents YoY
- -0.8%
- Active inventory
- 205
- Price-to-rent
- 7.2×
Monthly cashflow live
- Estimated rent
- $2,146 high interval (Pro) →
- Mortgage (P&I)
- −$970
- Tax from tax record
- −$385 /mo · $4,626/yr
- Insurance
- −$77
- HOA
- −$0
- Vacancy / Maint / Mgmt
- −$451
- Net cashflow
- $262
Break-even live
UW: 25.0% down · 7.5% · 30yr · 1.5% tax · 5.0% vac · 8.0% maint · 8.0% mgmt
Financing live
Cash to close
- Down payment
- $46,250
- Closing costs
- $5,550
- Reserves months
- —
- Total cash needed
- —
Loan-product check · same deal, 3 products live
Conventional
25% down · 7.5% · 30yr
- Down + closing
- —
- Monthly P&I
- —
- Monthly cashflow
- —
- DSCR
- —
- Eligible?
- —
Personal DTI + credit; lowest rate.
DSCR
20% down · 8.5% · 30yr
- Down + closing
- —
- Monthly P&I
- —
- Monthly cashflow
- —
- DSCR
- —
- Eligible?
- —
No personal income docs; deal must DSCR.
Hard money
10% down · 12.0% · 12mo
- Down + closing
- —
- Monthly P&I
- —
- Monthly cashflow
- —
- DSCR
- —
- Eligible?
- —
Short-term bridge; refi at stabilization.
Rent comps 40 comps
| Address | Beds | Baths | Sqft | Rent | $/sqft | DOM | Units | Dist |
|---|---|---|---|---|---|---|---|---|
| 6014 Hollyleaf Dr Arlington, TX | 3.0 | 2.5 | 1389 | $2,145 | $1.54 | 2d | 1 | 0.11mi |
| 6036 Maple Leaf Dr Arlington, TX | 4.0 | 2.0 | 1673 | $2,000 | $1.20 | 13d | 1 | 0.12mi |
| 916 Ashmount Ln Arlington, TX | 3.0 | 2.0 | 1185 | $1,899 | $1.60 | 44d | 1 | 0.15mi |
| 822 Foxridge Dr Arlington, TX | 3.0 | 2.5 | 1679 | $2,089 | $1.24 | 44d | 1 | 0.17mi |
| 920 Tennessee Trl Arlington, TX | 3.0 | 2.0 | 1500 | $2,095 | $1.40 | 2d | 1 | 0.25mi |
| 6463 Blue Trl Arlington, TX | 3.0 | 2.5 | 1661 | $2,399 | $1.44 | 22d | 1 | 0.26mi |
| 780 Bonnet Trl Arlington, TX | 3.0 | 2.5 | 1661 | $2,350 | $1.41 | 24d | 1 | 0.27mi |
| 911 Pinion Dr Arlington, TX | 3.0 | 2.0 | 1299 | $1,400 | $1.08 | 44d | 1 | 0.28mi |
| 763 Bonnet Trl Arlington, TX | 3.0 | 2.5 | 1666 | $1,200 | $0.72 | 13d | 1 | 0.28mi |
| 5907 Lovingham Ct Unit 5907 Arlington, TX | 3.0 | 2.0 | 1200 | $2,050 | $1.71 | 44d | 1 | 0.28mi |
| 760 Bonnet Trl Arlington, TX | 3.0 | 2.5 | 1624 | $2,349 | $1.45 | 22d | 1 | 0.31mi |
| 816 W Colony Dr Arlington, TX | 3.0 | 2.0 | 1296 | $2,025 | $1.56 | 19d | 1 | 0.31mi |
| 734 Bonnet Trl Arlington, TX | 2.0 | 2.5 | 1636 | $2,199 | $1.34 | 22d | 1 | 0.31mi |
| 746 Bonnet Trl Arlington, TX | 2.0 | 2.0 | 1416 | $2,175 | $1.54 | 24d | 1 | 0.32mi |
| 805 Hillbrooke Dr Arlington, TX | 3.0 | 3.0 | 1873 | $2,200 | $1.17 | 44d | 1 | 0.35mi |
| 6301 Fairlane Dr Arlington, TX | 3.0 | 2.0 | 1420 | $1,900 | $1.34 | 24d | 1 | 0.37mi |
| 6216 Fairlane Dr Arlington, TX | 3.0 | 2.0 | 1270 | $1,966 | $1.55 | 22d | 1 | 0.38mi |
| 6216 Fairlane Dr Arlington, TX | 3.0 | 2.0 | 1270 | $1,900 | $1.50 | 13d | 1 | 0.38mi |
| 1009 Danforth Ct Arlington, TX | 3.0 | 2.0 | 1436 | $2,050 | $1.43 | 3d | 1 | 0.40mi |
| 736 W Colony Dr Arlington, TX | 3.0 | 2.0 | 1575 | $2,070 | $1.31 | 2d | 1 | 0.40mi |
| 863 Valleybrooke Dr Arlington, TX | 3.0 | 2.0 | 1123 | $1,950 | $1.74 | 44d | 1 | 0.41mi |
| 101 Colony Dr Arlington, TX | 3.0 | 2.0 | 1400 | $2,055 | $1.47 | 44d | 1 | 0.43mi |
| 216 Caprock Dr Arlington, TX | 3.0 | 2.0 | 1211 | $1,850 | $1.53 | 17d | 1 | 0.48mi |
| 216 Caprock Dr Arlington, TX | 3.0 | 2.0 | 1211 | $1,850 | $1.53 | 4d | 1 | 0.48mi |
| 6406 Mercedes Dr Arlington, TX | 3.0 | 2.0 | 1495 | $2,395 | $1.60 | 44d | 1 | 0.49mi |
| 914 Pierce Arrow Dr Arlington, TX | 3.0 | 2.0 | 1301 | $2,000 | $1.54 | 44d | 1 | 0.49mi |
| 6501 Topaz Dr Arlington, TX | 3.0 | 2.0 | 1130 | $1,995 | $1.77 | 24d | 1 | 0.52mi |
| 6504 Eldorado Dr Arlington, TX | 3.0 | 2.0 | 1690 | $2,125 | $1.26 | 13d | 1 | 0.54mi |
| 6504 Eldorado Dr Arlington, TX | 3.0 | 2.0 | 1690 | $2,125 | $1.26 | 7d | 1 | 0.54mi |
| 1043 Cheddar Ct Arlington, TX | 3.0 | 2.5 | 1590 | $1,970 | $1.24 | 24d | 1 | 0.56mi |
| 1105 Cloudcrest Ct Arlington, TX | 2.0 | 2.0 | 1513 | $1,700 | $1.12 | 44d | 1 | 0.60mi |
| 325 Angelina Dr Arlington, TX | 3.0 | 2.0 | 1441 | $1,900 | $1.32 | 7d | 1 | 0.60mi |
| 323 Moss Hill Dr Arlington, TX | 3.0 | 2.0 | 1053 | $1,900 | $1.80 | 7d | 1 | 0.61mi |
| 6000 Lavaca Dr Arlington, TX | 3.0 | 2.0 | 1559 | $2,046 | $1.31 | 7d | 1 | 0.62mi |
| 865 W Lynn Creek Dr Arlington, TX | 3.0 | 2.0 | 1696 | $2,050 | $1.21 | 18d | 1 | 0.62mi |
| 327 Moss Hill Dr Arlington, TX | 3.0 | 2.0 | 1575 | $2,079 | $1.32 | 44d | 1 | 0.63mi |
| 6306 Pilgrim Ln Arlington, TX | 3.0 | 2.0 | 1197 | $1,885 | $1.57 | 44d | 1 | 0.64mi |
| 6322 Woolwich Dr Arlington, TX | 3.0 | 2.0 | 1728 | $2,200 | $1.27 | 21d | 1 | 0.64mi |
| 5540 White Dove Dr Arlington, TX | 3.0 | 2.0 | 1636 | $3,350 | $2.05 | 44d | 1 | 0.76mi |
| 805 Greenridge Dr Arlington, TX | 3.0 | 2.0 | 1361 | $2,050 | $1.51 | 20d | 1 | 0.76mi |
Listing history 2 events
-
2026-06-18remarks 586-char remark
-
2026-06-18$185,000 Active 1 DOM
ⓘ Source: listings_history table (triggers on properties + properties_extension) + one-shot
backfill from property_details.listing_events for pre-trigger history.
Tax reassessment forecast TX · Resets to sale price
- Current annual tax
- $4,626 · $385/mo
- Projected year-2 tax
- $4,626 · $385/mo
- Expected delta
- $0/yr ($0/mo · 0.0%)
ⓘ Screening estimate from a state-policy table — verify with the county assessor before closing.
Climate risk First Street
- Flood 1/10 Low FEMA zone X (unshaded) · 0% chance over 30 yrs
- Wildfire 2/10 Low
- Heat 7/10 Severe 7 d/yr ≥110°F today · 24 d/yr by 30 yrs out
- Wind 6/10 Major 27% chance of damaging wind over 30 yrs
- Air quality 3/10 Moderate 2 unhealthy d/yr today · 3 by 30 yrs out
Nearby sold comps map
Loading sold comps map…
Walkable amenities ~0.75 mi
Loading nearby amenities…
Taxation est. · year 1
- Rental income
- $25,747
- − Mortgage interest
- −$10,363
- − Property taxes
- −$4,626
- − Insurance
- −$925
- − Repairs & maintenance
- −$2,060
- − Management
- −$2,060
- − Depreciation
- −$5,382
- Taxable income
- $333
- Est. tax owed @ 24.0%
- −$80
- After-tax cash flow
- $3,068/yr
For passive investors: Depreciation is non-cash, so a rental often shows a tax loss while cash-flowing — sheltering income. Rental losses are passive: they offset passive income freely, and up to $25,000/yr can offset ordinary (W-2) income if you actively participate and your MAGI is under $100k (phasing out to $0 by $150k); unused losses carry forward. On sale, claimed depreciation is recaptured at up to 25%, and gains may owe capital-gains tax (a 1031 exchange can defer both). Figures are a year-1 estimate at your 24.0% rate — not tax advice; consult a CPA.
Schools (NCES district)
- District
- Mansfield ISD
- NCES district ID
- 4828920
- Math proficiency
- 47% ▼ -17.00%
- Reading proficiency
- 53% ▼ -6.00%
- Median HH income
- $81,934
- Composite
- 45.82/100
- National rank
- #2558
- State rank
- #125 of 826 in TX
Livability — Arlington
- Score
- 78/100
- State rank
- #75
- US rank
- #2697
Category grades
Schools grade is shown separately in the Schools card above.
Census & demographics
- Census place
- Arlington, TX
- County
- Tarrant County · 2,033,669 people
- City population
- 366,588
- Metro
- Dallas-Fort Worth-Arlington, TX
- Population (ZIP)
- 47,074
- Household income
- $90,083
- Rent vs Own
- Severe rent burden
- 1311.0
Population outlook (Tarrant County) Hauer SSP2
- Today (2025)
- 2,380,417 people
- By 2030
- 2,578,900 · +8.3%
- By 2040
- 2,974,995 · +25.0%
- By 2050
- 3,350,489 · +40.8%
- By 2075
- 4,216,909 · +77.2%
- By 2100
- 4,741,527 · +99.2%
Race, ethnicity, and origin ACS 2023
- Neighborhood character
- Diverse neighborhood (Simpson 0.68)
- Race & ethnicity
- White 48% Black 21% Hispanic / Latino 20% Two or more races 11% Asian 6%
- Hispanic origin (detail)
- Mexican 15% Puerto Rican 2%
- Common ancestry
- Italian 2% Slovak 2% Romanian 1%
- Foreign-born
- 13% · Canada, Vietnam, China
- Languages at home
- 78% English-only · Spanish 12% Vietnamese 2% Other Indo-European 2%
Political lean MEDSL · Tarrant
- 2024 margin
- Lean R (+5.1) · D 46.7% · R 51.9% · Other 1.4%
- 2008→2024 swing
- +6.6pp toward D · 2008: -11.7pp · 2024: -5.1pp
- All cycles
- 2024: R+5.1 2020: D+0.2 2016: R+8.7 2012: R+15.7 2008: R+11.7
Not yet ingested
- Civics
- —
Market trends
- HPI YoY
- ▼ -184.11%
- Current HPI
- 268.3139
- Rent YoY
- ▼ -0.80%
- Metro
- Dallas-Fort Worth-Arlington, TX
- State GDP YoY
- ▲ 3.95%
- F500 in state
- 110
Industry mix (Fortune 500 HQ in TX)
| Industry | F500 HQs | Revenue |
|---|---|---|
| Energy | 16 | $1,198B |
|
||
| Technology | 5 | $198B |
|
||
| Engineering / Construction | 4 | $72B |
|
||
| Energy Services | 3 | $60B |
|
||
| Utilities | 3 | $41B |
|
||
| Healthcare | 2 | $330B |
|
||
Price history
+105.6% since first listed9 events — show timeline
- 2026-06-18 Listed $185,000 NTREIS
- 2008-10-07 Sold (MLS) — NTREIS
- 2008-08-19 Listing Removed — NTREIS
- 2008-06-27 Listed $69,900 NTREIS
- 2006-02-03 Sold (Public Records) — Public Records
- 2006-01-31 Sold (MLS) — NTREIS
- 2006-01-02 Listing Removed — NTREIS
- 2005-10-17 Listed $90,000 NTREIS
- 1985-10-11 Sold (Public Records) — Public Records
Property tax history
+4.2%/yrLatest (2025): $4,626 · -6.9% YoY. Source: county tax records.
Cash-flow waterfall
monthlySold comps — $/sqft
last 12 mo · ≤1 miLoading sold comps…