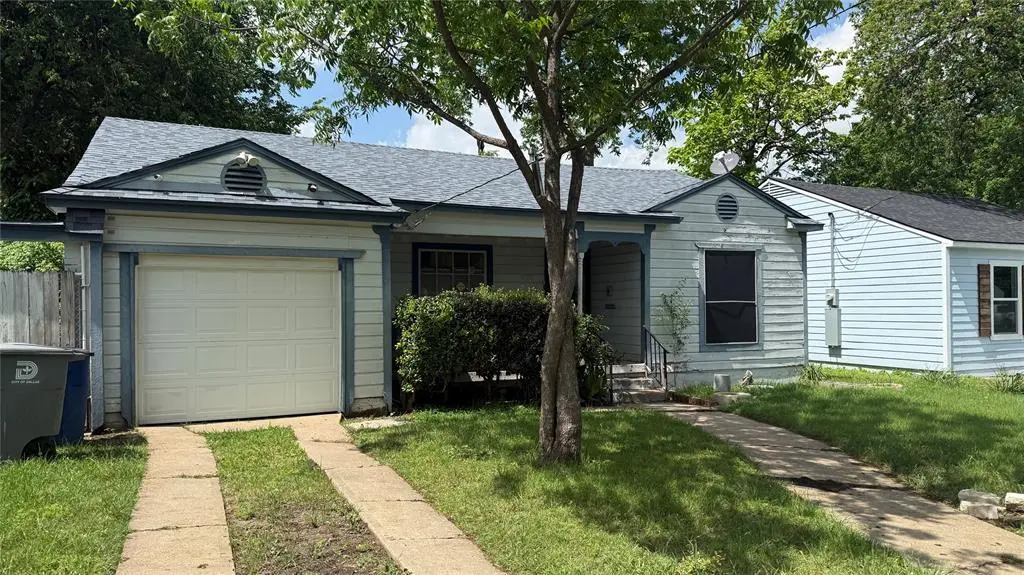
2319 Kathleen Ave · Dallas, TX
Flood risk 1/10 · Minimal
- FEMA flood zone
- X (unshaded)
- Chance of flooding over 30 yrs
- 0.0%
- Est. flood insurance / yr
- $507 – $1,088
Fire risk 1/10 · Minimal
- Est. fire insurance / yr
- $1,222 – $2,270
Heat risk 7/10 · Major
- Hot days now (above 109°F)
- 7 days/yr
- Hot days in 30 yrs
- 24 days/yr
Wind risk 6/10 · Moderate
- Chance of severe wind over 30 yrs
- 27.0%
Air-quality risk 2/10 · Minimal
- Unhealthy air days now
- 1 days/yr
- Unhealthy air days in 30 yrs
- 2 days/yr
Risk factors via First Street. Map © Google.
Why this score? — see what drove the C+ grade
The composite is a weighted blend of 9 inputs, each scored 0–100. Each bar is that input's sub-score; the figure is the points it added to the 100-point composite (weight × sub-score).
- Cash flow +22.2/30.0
- ARV discount +15.0/15.0
- 1% rule +7.4/10.0
- DSCR +7.1/10.0
- Livability +4.0/5.0
- Rent growth +3.6/5.0
- Schools +2.8/10.0
- Condition / age +2.5/5.0
- Appreciation +0.0/10.0
$125,000
🖨 Deal sheet 📄 Offer letter ✓ Due diligence
Listing remarks
Charming 3-bedroom cottage in the established Easterview neighborhood, offering classic 1948 character and a home that is in pretty good shape overall. This cozy property features inviting archways, hardwood flooring, a functional kitchen with a built-in gas range, a dedicated laundry room, and a versatile room above the garage—ideal for storage, hobby space, or potential third bedroom. The large, level backyard provides plenty of room to enjoy outdoor living, complemented by mature trees and a covered front porch. The home includes a 1-car attached garage and additional on-street or open parking. Interior highlights include decorative lighting, built-ins, ceiling fans, and available
Key facts
- Hardwood flooring
- Functional kitchen
- Versatile room
Tags
Property features AI
Finance
- Other: Property classified as single family residence; Accessory unit not present; Not in a municipal utility district
- HOA & community: No association
Exterior
- Parking: One covered space (attached garage); Garage: attached, 1-car (approx. 10' wide x 15' long x 10' high); On-street parking and open/outside parking available
- Security: Burglar alarm/security features
- Utilities: City water; City sewer; Electricity available and connected; Cable available; Phone available; Sewer available; Curbs and sidewalk
- Home design: Single family residence; Residential property; Two-story; Not attached to another property
- Construction: Built in 1948 (preowned); Siding and wood construction; Composition roof; Pillar/post/pier foundation
- Exterior features: Covered porch(es); Landscaped yard; Large backyard with grass; Few trees; Interior lot; Subdivision setting; Chain link and wood fencing
Interior
- Kitchen: Galley kitchen with built-in cabinets; Built-in gas range
- Bedrooms: Three bedrooms (primary and two additional; one bedroom on second level)
- Flooring: Carpet; Ceramic tile; Wood
- Bathrooms: One full bathroom
- Heating & cooling: Ceiling fans; Electric cooling; Window unit(s); Natural gas heating; Space heater; Wall furnace
- Interior features: Built-in features; Cable TV available; Chandelier; Decorative lighting; High speed internet available; One living area; One dining area; Total room count: 8; Two levels
- Laundry & utility: First-floor laundry
Neighborhood map
What this means for you Summary
Snapshot
- This is a 2-bed/1.0-bath single-family listed at $125k.
Deal economics
- At list price, monthly cash flow is $204 ($2k/yr) — positive.
- The deal already cash-flows at list — no discount required.
- Meets the 1% rule at list price ($2k rent vs $125k).
- Recommended offer: $121k (3.0% below list) — sets the bar for market timing.
- Cap rate 8.3% vs local median 2.3% in Dallas — top-decile yield for the area; either an underpriced asset or a hidden risk that comps aren't pricing in. Stress-test before assuming the spread holds.
Location & tenants
- Location reads 81/100 on livability (#24 in TX, #1,380 nationally) — a professional / high-income tenant draw. Strengths: amenities A+, commute A+, housing A+; Watch: crime F.
- Dallas ISD (urban): math 31% / reading 36% proficiency, ranked #559 of 826 in TX (top 68%) — families likely to look elsewhere, expect single-tenant / working-renter base with shorter leases; 83% free/reduced lunch — lower-income household profile, screen leases tightly.
- Zoned schools: John Neely Bryan El (math 17% / reading 22%, grade F, #3,583 of 4,322 statewide, top 86%, 379 students, 97% FRL).
- Zoned-school proficiency averages 20% at this address vs 34% district-wide (-14 pts) — the specific schools serving this property underperform the Dallas ISD average; the district grade overstates school quality for this exact location.
- Market conditions: Rents rising fast (+4.2%/yr); 249 active listings in the ZIP; 23 comparable units currently listed for rent nearby; rentals at typical pace (median 20d on market — plan ~3-4 weeks tenant-placement turnaround); lower-income renter base — watch delinquency; 12,577 units permitted in Dallas County in 2024 (6,829 in 5+ unit buildings).
- This rent runs 45% of the median local income ($41k/yr) — at the standard rent-burdened threshold; future hikes will face affordability resistance.
Forward outlook
- Local home prices are declining (-3.0%/yr); year-one equity from $864 of loan paydown is wiped out by about $4k of value loss. Plan a longer hold.
- Dallas County population projected at +35% by 2050 — long-run rental-demand tailwind backs the buy-and-hold thesis.
Negotiation context
- It's been on market 55 days — a 3% lower offer ($121k) is reasonable based on typical stale-listing flexibility.
- 2 sale attempts; this cycle's ask has dropped $40k (24%) from the opening price — seller is motivated, your offer sets the floor, not the list.
Risks & watch-outs
- Watch-outs: property tax is 3.0% of price; built in 1948 — expect roof / HVAC / electrical / plumbing capex.
- Climate carrying-cost: major wind risk, 27% chance of damaging wind over 30y; extreme-heat days projected 7→24/yr by 2055 (HVAC capex compounding) — expect insurance premiums to compound above CPI over the hold.
Questions for the listing agent
- It's been on market 55 days. Have you received any prior offers? Is the seller open to a 3% concession, seller financing, or rate buy-down credit?
- Built in 1948 — when were the roof, HVAC, electrical panel, plumbing, and water heater last replaced?
- Property tax is high relative to price — has the assessment been appealed recently, and will the sale trigger a re-assessment?
- Is there a deadline driving the sale (1031 exchange, divorce, estate, relocation)? That informs how much negotiation room exists.
- Crime grade is F in this area — have there been break-ins, vandalism, or insurance claims at this property in the last 3 years? What carrier currently insures it and at what premium?
- What's the average days-on-market for RENTAL listings here right now (not sales)? A rising rental-DOM trend means longer vacancies and softer asking-rent achievability than the comps imply.
- What's the recent tenant-quality profile in this submarket — average credit score on applications, eviction rate, late-payment / NSF rate, and stable-employment percentage? A property-management company in the area should have these aggregated.
- How much new for-sale + rental construction is in the pipeline within 1–3 miles? Heavy new supply typically softens prices + rents 12–24 months out; constrained supply supports both.
Investment metrics
- 1% rule
- 1.24% ✓
- Cap rate
- 8.25%
- Cash-on-cash
- 6.99%
- DSCR
- 1.31
- GRM
- 6.7
CMA / ARV
- ARV (median comp)
- $185,638
- List price
- $125,000
- Delta
- -32.66%
- Verdict
- UNDERPRICED
- Comps
- 20 within 1.0 mi
Show comp detail 12 sales within ~0.75 mi
| Address | Dist | Beds/Ba | Sqft | Sold | Price | $/sf | Match |
|---|---|---|---|---|---|---|---|
| 2510 Wilhurt Ave | 0.40mi | 2/1.0 | 888 (-2%) | 2mo | $130,000 | $146 | 77 |
| 2541 Fordham Rd | 0.36mi | 2/1.0 | 816 (-10%) | 2mo | $185,000 | $227 | 65 |
| 2023 Custer Dr | 0.42mi | 2/1.0 | 860 (-5%) | 8mo | $145,000 | $169 | 65 |
| 2348 Village Way | 0.42mi | 2/1.0 | 840 (-7%) | 6mo | $125,000 | $149 | 63 |
| 2546 Jennings Ave | 0.36mi | 2/1.0 | 820 (-9%) | 8mo | $185,000 | $226 | 61 |
| 1713 Hemphill Dr | 0.65mi | 2/1.0 | 932 (+3%) | 5mo | $165,000 | $177 | 60 |
| 2239 Exeter Ave | 0.23mi | 3/1.0 (+1) | 1,028 (+14%) | 7mo | $125,000 | $122 | 56 |
| 2323 Deer Path Dr | 0.50mi | 2/1.0 | 790 (-13%) | 1mo | $114,500 | $145 | 55 |
| 2303 Custer Dr | 0.36mi | 2/1.0 | 784 (-13%) | 10mo | $182,000 | $232 | 53 |
| 2437 Stovall Dr | 0.37mi | 2/1.0 | 768 (-15%) | 7mo | $135,000 | $176 | 52 |
| 2646 Scotland Dr | 0.67mi | 2/1.0 | 768 (-15%) | 10mo | $114,000 | $148 | 36 |
| 2731 Fordham Rd | 0.62mi | 3/2.0 (+1) | 1,022 (+13%) | 6mo | $199,000 | $195 | 35 |
Match score weights: distance 35% · size 25% · config 20% · recency 20%. Top-matched comps best support the ARV.
Projected returns pro-forma
-3.0% appreciation · 4.2% rent growth · sell at horizon
- IRR
- -3.9%
- Equity multiple
- 0.85×
- Total profit
- $-5,257
- Equity at exit
- $18,638
- IRR
- 7.3%
- Equity multiple
- 1.59×
- Total profit
- $20,575
- Equity at exit
- $10,808
Cash invested: $35,000 (down + closing). Projections, not guarantees.
Landlord ↔ Tenant lean methodology
- Overall (STATE)
- 87 Strongly Landlord-Friendly
- State Texas
- 87 Strongly Landlord-Friendly · R+5
- County
- — inherits STATE
- City
- — inherits STATE
ZIP-level market 75216
- Home prices YoY
- -29.7%
- Rents YoY
- 4.2%
- Active inventory
- 249
- Price-to-rent
- 6.7×
Monthly cashflow live
- Estimated rent
- $1,547 high interval (Pro) →
- Mortgage (P&I)
- −$656
- Tax from tax record
- −$310 /mo · $3,723/yr
- Insurance
- −$52
- HOA
- −$0
- Vacancy / Maint / Mgmt
- −$325
- Net cashflow
- $204
Break-even live
UW: 25.0% down · 7.5% · 30yr · 1.5% tax · 5.0% vac · 8.0% maint · 8.0% mgmt
Financing live
Cash to close
- Down payment
- $31,250
- Closing costs
- $3,750
- Reserves months
- —
- Total cash needed
- —
Loan-product check · same deal, 3 products live
Conventional
25% down · 7.5% · 30yr
- Down + closing
- —
- Monthly P&I
- —
- Monthly cashflow
- —
- DSCR
- —
- Eligible?
- —
Personal DTI + credit; lowest rate.
DSCR
20% down · 8.5% · 30yr
- Down + closing
- —
- Monthly P&I
- —
- Monthly cashflow
- —
- DSCR
- —
- Eligible?
- —
No personal income docs; deal must DSCR.
Hard money
10% down · 12.0% · 12mo
- Down + closing
- —
- Monthly P&I
- —
- Monthly cashflow
- —
- DSCR
- —
- Eligible?
- —
Short-term bridge; refi at stabilization.
Rent comps 23 comps
| Address | Beds | Baths | Sqft | Rent | $/sqft | DOM | Units | Dist |
|---|---|---|---|---|---|---|---|---|
| 2503 Stovall Dr Dallas, TX | 2.0 | 2.0 | 768 | $2,300 | $2.99 | 43d | 1 | 0.36mi |
| 2538 Stovall Dr Dallas, TX | 3.0 | 1.0 | 986 | $1,625 | $1.65 | 5d | 1 | 0.42mi |
| 2303 Deer Path Dr Dallas, TX | 2.0 | 1.0 | 790 | $1,650 | $2.09 | 7d | 1 | 0.46mi |
| 3206 Kellogg Ave Dallas, TX | 3.0 | 1.5 | 1076 | $1,800 | $1.67 | 43d | 1 | 0.52mi |
| 3320 Mundy Dr Dallas, TX | 3.0 | 2.0 | 1010 | $1,695 | $1.68 | 43d | 1 | 0.57mi |
| 1618 Marfa Ave Dallas, TX | 3.0 | 2.0 | 1100 | $1,900 | $1.73 | 43d | 1 | 0.73mi |
| 4417 S Lancaster Rd Dallas, TX | 2.0 | 1.0–2.0 | 874 | $1,595 | $1.82 | 2d | 1 | 0.80mi |
| 2625 E Illinois Ave Dallas, TX | 2.0 | 1.0 | 750 | $1,050 | $1.40 | 19d | 1 | 0.92mi |
| 2625 E Illinois Ave Dallas, TX | 1.0 | 1.0 | 650 | $950 | $1.46 | 18d | 1 | 0.92mi |
| 2625 E Illinois Ave Dallas, TX | 2.0 | 1.0 | 750 | $1,050 | $1.40 | 3d | 1 | 0.92mi |
| 2625 E Illinois Ave Unit 118 Dallas, TX | 1.0 | 1.0 | 650 | $999 | $1.54 | 19d | 1 | 0.92mi |
| 2625 E Illinois Ave Dallas, TX | 1.0–2.0 | 1.0 | 700 | $1,050 | $1.50 | 12d | 18 | 0.92mi |
| 2625 E Illinois Ave Dallas, TX | 1.0 | 1.0 | 650 | $999 | $1.54 | 24d | 1 | 0.92mi |
| 2625 E Illinois Ave Unit 102 Dallas, TX | 2.0 | 1.0 | 750 | $1,050 | $1.40 | 24d | 1 | 0.93mi |
| 1334 Marfa Ave Dallas, TX | 3.0 | 2.0 | 1100 | $1,475 | $1.34 | 43d | 1 | 0.99mi |
| 2751 E Ledbetter Dr Dallas, TX | 1.0–3.0 | 1.0–1.5 | 794 | $1,186 | $1.49 | 43d | 3 | 1.18mi |
| 4836 Sunnyvale St Dallas, TX | 1.0–3.0 | 1.0–2.0 | 515 | $1,330 | $2.58 | 43d | 7 | 1.21mi |
| 2821 E Kiest Blvd Dallas, TX | 1.0 | 1.0 | 700 | $990 | $1.41 | 7d | 1 | 1.24mi |
| 3015 E Ledbetter Dr Dallas, TX | 2.0–3.0 | 2.0 | 1030 | $1,100 | $1.07 | 3d | 1 | 1.32mi |
| 4934 Kildare Ave Dallas, TX | 3.0 | 2.0 | 1118 | $1,595 | $1.43 | 24d | 1 | 1.33mi |
| 3035 E Ledbetter Dr Dallas, TX | 1.0–2.0 | 1.0 | 643 | $1,275 | $1.98 | 3d | 1 | 1.40mi |
| 2906 E Kiest Blvd Dallas, TX | 2.0–3.0 | 1.0–2.0 | 798 | $1,235 | $1.55 | 1d | 5 | 1.45mi |
| 3608 S Marsalis Ave Dallas, TX | 2.0 | 1.0 | 907 | $1,400 | $1.54 | 43d | 1 | 1.47mi |
Listing history 20 events
-
2026-06-18days on market $125,000 Active 55 DOM
-
2026-06-17days on market $125,000 Active 54 DOM
-
2026-06-16days on market $125,000 Active 53 DOM
-
2026-06-15price $125,000 Active 52 DOM
-
2026-06-15days on market $130,000 Active 52 DOM
-
2026-06-13days on market $130,000 Active 50 DOM
-
2026-06-09days on market $130,000 Active 46 DOM
-
2026-06-08days on market $130,000 Active 45 DOM
-
2026-06-07days on market $130,000 Active 44 DOM
-
2026-06-04days on market $130,000 Active 41 DOM
-
2026-06-03pricedays on market $130,000 Active 40 DOM
-
2026-06-02days on market $135,000 Active 39 DOM
-
2026-06-01days on market $135,000 Active 38 DOM
-
2026-05-31days on market $135,000 Active 37 DOM
-
2026-05-10price $150,000 1173-char remark
-
2026-05-03price $155,000 1173-char remark
-
2026-04-24$165,000 Active 1173-char remark
-
2026-03-17historical
-
2026-02-25price $139,900
-
2025-12-19$144,900 Active
ⓘ Source: listings_history table (triggers on properties + properties_extension) + one-shot
backfill from property_details.listing_events for pre-trigger history.
Tax reassessment forecast TX · Resets to sale price
- Current annual tax
- $3,723 · $310/mo
- Projected year-2 tax
- $3,723 · $310/mo
- Expected delta
- $0/yr ($0/mo · 0.0%)
ⓘ Screening estimate from a state-policy table — verify with the county assessor before closing.
Climate risk First Street
- Flood 1/10 Low FEMA zone X (unshaded) · 0% chance over 30 yrs
- Wildfire 1/10 Low
- Heat 7/10 Severe 7 d/yr ≥109°F today · 24 d/yr by 30 yrs out
- Wind 6/10 Major 27% chance of damaging wind over 30 yrs
- Air quality 2/10 Low 1 unhealthy d/yr today · 2 by 30 yrs out
Nearby sold comps map
Loading sold comps map…
Walkable amenities ~0.75 mi
Loading nearby amenities…
Taxation est. · year 1
- Rental income
- $18,559
- − Mortgage interest
- −$7,002
- − Property taxes
- −$3,723
- − Insurance
- −$625
- − Repairs & maintenance
- −$1,485
- − Management
- −$1,485
- − Depreciation
- −$3,636
- Taxable income
- $603
- Est. tax owed @ 24.0%
- −$145
- After-tax cash flow
- $2,303/yr
For passive investors: Depreciation is non-cash, so a rental often shows a tax loss while cash-flowing — sheltering income. Rental losses are passive: they offset passive income freely, and up to $25,000/yr can offset ordinary (W-2) income if you actively participate and your MAGI is under $100k (phasing out to $0 by $150k); unused losses carry forward. On sale, claimed depreciation is recaptured at up to 25%, and gains may owe capital-gains tax (a 1031 exchange can defer both). Figures are a year-1 estimate at your 24.0% rate — not tax advice; consult a CPA.
Schools (NCES district)
- District
- Dallas ISD
- NCES district ID
- 4816230
- Math proficiency
- 31% ▼ -16.00%
- Reading proficiency
- 36% ▼ -4.00%
- Median HH income
- $42,881
- Composite
- 28.41/100
- National rank
- #6763
- State rank
- #559 of 826 in TX
Livability — Dallas
- Score
- 81/100
- State rank
- #24
- US rank
- #1380
Category grades
Schools grade is shown separately in the Schools card above.
Census & demographics
- Census place
- Dallas, TX
- County
- Dallas County · 2,612,404 people
- City population
- 1,168,437
- Metro
- Dallas-Fort Worth-Arlington, TX
- Population (ZIP)
- 55,894
- Household income
- $41,386
- Rent vs Own
- Severe rent burden
- 2465.0
Population outlook (Dallas County) Hauer SSP2
- Today (2025)
- 2,979,839 people
- By 2030
- 3,191,823 · +7.1%
- By 2040
- 3,619,611 · +21.5%
- By 2050
- 4,026,915 · +35.1%
- By 2075
- 4,957,073 · +66.4%
- By 2100
- 5,508,725 · +84.9%
Race, ethnicity, and origin ACS 2023
- Neighborhood character
- Majority Black (51%)
- Race & ethnicity
- Black 51% Hispanic / Latino 44% Two or more races 14% White 3%
- Hispanic origin (detail)
- Mexican 40%
- Common ancestry
- Hispanic 1%
- Foreign-born
- 17% · Canada
- Languages at home
- 62% English-only · Spanish 37%
Political lean MEDSL · Dallas
- 2024 margin
- Strong D (+22.2) · D 60.2% · R 38.0% · Other 1.8%
- 2008→2024 swing
- +6.9pp toward D · 2008: 15.3pp · 2024: 22.2pp
- All cycles
- 2024: D+22.2 2020: D+31.6 2016: D+26.2 2012: D+15.4 2008: D+15.3
Not yet ingested
- Civics
- —
Market trends
- HPI YoY
- ▼ -126.35%
- Current HPI
- 299.1825
- Rent YoY
- ▲ 4.20%
- Metro
- Dallas-Fort Worth-Arlington, TX
- State GDP YoY
- ▲ 3.95%
- F500 in state
- 110
Industry mix (Fortune 500 HQ in TX)
| Industry | F500 HQs | Revenue |
|---|---|---|
| Energy | 16 | $1,198B |
|
||
| Technology | 5 | $198B |
|
||
| Engineering / Construction | 4 | $72B |
|
||
| Energy Services | 3 | $60B |
|
||
| Utilities | 3 | $41B |
|
||
| Healthcare | 2 | $330B |
|
||
Price history
-13.7% since first listed10 events — show timeline
- 2026-06-15 Price Changed $125,000 NTREIS
- 2026-06-03 Price Changed $130,000 NTREIS
- 2026-05-26 Price Changed $135,000 NTREIS
- 2026-05-19 Price Changed $145,000 NTREIS
- 2026-05-10 Price Changed $150,000 NTREIS
- 2026-05-03 Price Changed $155,000 NTREIS
- 2026-04-24 Listed $165,000 NTREIS
- 2026-03-17 Listing Removed — NTREIS
- 2026-02-25 Price Changed $139,900 NTREIS
- 2025-12-19 Listed $144,900 NTREIS
Property tax history
+8.0%/yrLatest (2025): $3,723 · -0.4% YoY. Source: county tax records.
Cash-flow waterfall
monthlySold comps — $/sqft
last 12 mo · ≤1 miLoading sold comps…