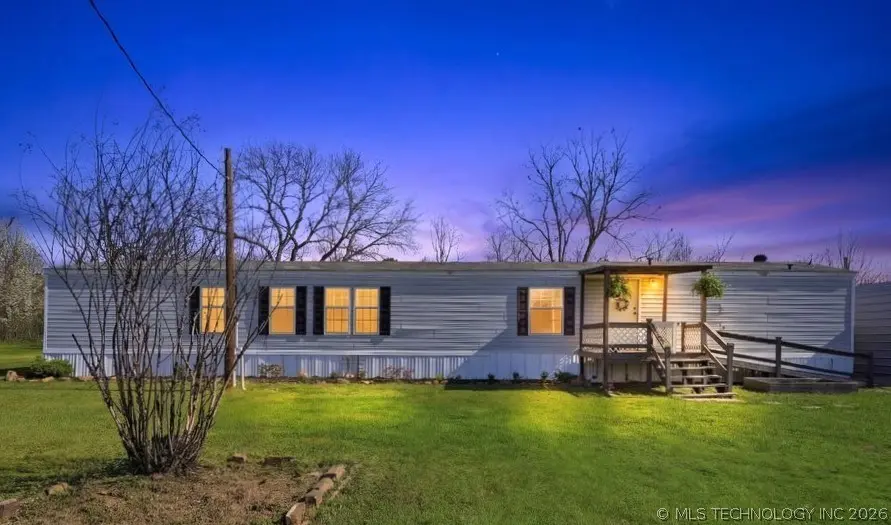
9159 Sahoma Lake Rd · Sapulpa, OK
Flood risk 1/10 · Minimal
- FEMA flood zone
- X (unshaded)
- Chance of flooding over 30 yrs
- 0.0%
- Est. flood insurance / yr
- $507 – $1,088
Fire risk 5/10 · Moderate
- Est. fire insurance / yr
- $2,463 – $4,575
Heat risk 6/10 · Moderate
- Hot days now (above 110°F)
- 7 days/yr
- Hot days in 30 yrs
- 18 days/yr
Wind risk 3/10 · Minor
- Chance of severe wind over 30 yrs
- 4.0%
Air-quality risk 2/10 · Minimal
- Unhealthy air days now
- 0 days/yr
- Unhealthy air days in 30 yrs
- 1 days/yr
Risk factors via First Street. Map © Google.
Why this score? — see what drove the F grade
The composite is a weighted blend of 9 inputs, each scored 0–100. Each bar is that input's sub-score; the figure is the points it added to the 100-point composite (weight × sub-score).
- Cash flow +10.4/30.0
- ARV discount +7.5/15.0
- Livability +3.4/5.0
- DSCR +3.0/10.0
- Rent growth +2.5/5.0
- Condition / age +2.5/5.0
- Schools +2.0/10.0
- 1% rule +1.9/10.0
- Appreciation +0.0/10.0
$178,500
🖨 Deal sheet (PDF) 📄 Offer letter ✓ Due diligence
Listing remarks MLS
MUST SELL!!! A few blocks from Pretty Water Lake & Sahoma Lake. Custom Built, 24 yr roof, plywood floors, upgraded carpet & vinyl floors. 25x30 garage/shop; 2 sheds - 12x16 & 8x12, 2x4 walls. Plenty of room for larger shop/bldg.
Key facts
- Split-bedroom layout
- Large kitchen
- Separate shower
Tags
Property features AI
Exterior
- Parking: Detached garage with shelving; 2 garage spaces
- Security: Smoke detector(s); No safety shelter
- Utilities: Electricity available; Natural gas available; Water available (rural); Aerobic septic system
- Home design: Single wide manufactured home; One story; Faces southwest; Permanent foundation with tie down
- Construction: Built as manufactured home; Vinyl siding; Asphalt/fiberglass roof; Home warranty included
- Exterior features: Covered porch; Dog run; Fire pit; Gravel driveway; Shed(s); Workshop; Mature trees
Interior
- Kitchen: Kitchen with island, breakfast nook and pantry; Dishwasher; Oven; Range/Stove
- Bedrooms: Master bedroom with private bath and walk-in closet (First level); Additional bedrooms on first level
- Flooring: Carpet; Laminate; Vinyl
- Bathrooms: Two full bathrooms; Master bath with bathtub and separate shower; Hall bath with bathtub
- Heating & cooling: Central heating (electric and gas); Central air conditioning
- Interior features: Vinyl windows; Laminate counters; Cable TV available; Ceiling fan(s); Electric range connection; Programmable thermostat; Outside fireplace
- Laundry & utility: Inside utility room (first level); Washer hookup; Electric dryer hookup; Electric water heater
Neighborhood map
What this means for you Summary
Snapshot
- This is a 2-bed/1.0-bath manufactured listed at $178k.
Deal economics
- At list price, monthly cash flow is $-96 ($-1k/yr) — negative.
- To cash-flow at today's rent, offer at most $162k (9.5% below list).
- To meet the 1% rule (rent ≥ 1% of price), the offer needs to be $123k (31.0% below list).
- Recommended offer: $123k (31.0% below list) — sets the bar for 1% rule.
- Cap rate 5.6% vs local median 2.8% in Sapulpa — top-decile yield for the area; either an underpriced asset or a hidden risk that comps aren't pricing in. Stress-test before assuming the spread holds.
Location & tenants
- Location reads 67/100 on livability (#88 in OK) — a middle-class / working-renter tenant base. Strengths: cost of living A+, housing A+, crime B+; Watch: amenities F, commute F, health & safety F.
- Pretty Water (rural): math 15% / reading 20% proficiency, ranked #411 of 513 in OK (top 80%) — low school quality limits family demand, transient renter base, plan for 1-2y turnover.
- Zoned schools: Pretty Water Public School (math 12% / reading 22%, grade F, #540 of 845 statewide, top 68%, 286 students, 0% FRL) — zoned schools average 0% FRL vs 44% district-wide (44 pts lower); this property's tenant base skews higher-income than the district average.
- Market conditions: 197 active listings in the ZIP; 193 units permitted in Creek County in 2024 (76 in 5+ unit buildings).
Forward outlook
- Local home prices are declining (-3.0%/yr); year-one equity from $1k of loan paydown is wiped out by about $5k of value loss. Plan a longer hold.
Negotiation context
- It's been on market 48 days — a 3% lower offer ($173k) is reasonable based on typical stale-listing flexibility.
- 7 sale attempts since 29y ago with the ask held roughly flat each time — persistent listings suggest the price (not the market) is what's stuck; bring a comps-based counter.
- Current owner paid $58k; list at $178k implies a 208% gain — meaningful room to come down on a strong offer.
Risks & watch-outs
- Climate carrying-cost: moderate wildfire risk; extreme-heat days projected 7→18/yr by 2055 (HVAC capex compounding) — expect insurance premiums to compound above CPI over the hold.
Questions for the listing agent
- What do current leases actually rent for vs. the listed asking? Can we see a recent rent roll and the last 12 months of T-12 income?
- It's been on market 48 days. Have you received any prior offers? Is the seller open to a 31% concession, seller financing, or rate buy-down credit?
- Is there a deadline driving the sale (1031 exchange, divorce, estate, relocation)? That informs how much negotiation room exists.
- Schools are F-rated, which usually means shorter tenancies and higher turnover. Who's the typical renter profile here, and what's been the actual vacancy rate?
- The area grade is low — what's the realistic commute time and amenity access for the typical tenant pool here? Any planned neighborhood developments (good or bad) we should know about?
- What's the average days-on-market for RENTAL listings here right now (not sales)? A rising rental-DOM trend means longer vacancies and softer asking-rent achievability than the comps imply.
- What's the recent tenant-quality profile in this submarket — average credit score on applications, eviction rate, late-payment / NSF rate, and stable-employment percentage? A property-management company in the area should have these aggregated.
- How much new for-sale + rental construction is in the pipeline within 1–3 miles? Heavy new supply typically softens prices + rents 12–24 months out; constrained supply supports both.
Investment metrics
- 1% rule
- 0.69% ✗
- Cap rate
- 5.65%
- Cash-on-cash
- -2.31%
- DSCR
- 0.90
- GRM
- 12.1
CMA / ARV
No comps found within radius.
Projected returns pro-forma
-3.0% appreciation · 3.0% rent growth · sell at horizon
- IRR
- -20.2%
- Equity multiple
- 0.30×
- Total profit
- $-35,124
- Equity at exit
- $26,615
- IRR
- -13.4%
- Equity multiple
- 0.22×
- Total profit
- $-38,799
- Equity at exit
- $15,433
Cash invested: $49,980 (down + closing). Projections, not guarantees.
Landlord ↔ Tenant lean methodology
- Overall (STATE)
- 83 Strongly Landlord-Friendly
- State Oklahoma
- 83 Strongly Landlord-Friendly · R+20
- County
- — inherits STATE
- City
- — inherits STATE
ZIP-level market 74066
- Home prices YoY
- -26.3%
- Active inventory
- 197
- Price-to-rent
- 12.1×
Monthly cashflow live
- Estimated rent
- $1,231 medium interval (Pro) →
- Mortgage (P&I)
- −$936
- Tax from tax record
- −$58 /mo · $697/yr
- Insurance
- −$74
- HOA
- −$0
- Vacancy / Maint / Mgmt
- −$259
- Net cashflow
- $-96
Break-even live
Sensitivity live
| Price | -10% $5 | -5% $-46 | +0% $-96 | +5% $-147 | +10% $-197 |
|---|---|---|---|---|---|
| Rent | -10% $-193 | -5% $-145 | +0% $-96 | +5% $-47 | +10% $1 |
| Rate | -1.0pp $-6 | -0.5pp $-51 | base $-96 | +0.5pp $-142 | +1.0pp $-189 |
UW: 25.0% down · 7.5% · 30yr · 1.5% tax · 5.0% vac · 8.0% maint · 8.0% mgmt
Financing live
Cash to close
- Down payment
- $44,625
- Closing costs
- $5,355
- Reserves months
- —
- Total cash needed
- —
Loan-product check · same deal, 3 products live
Conventional
25% down · 7.5% · 30yr
- Down + closing
- —
- Monthly P&I
- —
- Monthly cashflow
- —
- DSCR
- —
- Eligible?
- —
Personal DTI + credit; lowest rate.
DSCR
20% down · 8.5% · 30yr
- Down + closing
- —
- Monthly P&I
- —
- Monthly cashflow
- —
- DSCR
- —
- Eligible?
- —
No personal income docs; deal must DSCR.
Hard money
10% down · 12.0% · 12mo
- Down + closing
- —
- Monthly P&I
- —
- Monthly cashflow
- —
- DSCR
- —
- Eligible?
- —
Short-term bridge; refi at stabilization.
Listing history 18 events
-
2026-05-14status Pending
-
2026-03-27$178,500 Active
-
2020-01-21soldstatus $58,000
-
2014-11-19soldstatus $68,000 245-char remark
Show marketing remark (245 chars)
MUST SELL!!! A few blocks from Pretty Water Lake & Sahoma Lake. Custom Built, 24 yr roof, plywood floors, upgraded carpet & vinyl floors. 25x30 garage/shop; 2 sheds - 12x16 & 8x12, 2x4 walls. Plenty of room for larger shop/bldg.
-
2014-11-19soldstatus $68,000
Show marketing remark (245 chars)
MUST SELL!!! A few blocks from Pretty Water Lake & Sahoma Lake. Custom Built, 24 yr roof, plywood floors, upgraded carpet & vinyl floors. 25x30 garage/shop; 2 sheds - 12x16 & 8x12, 2x4 walls. Plenty of room for larger shop/bldg.
-
2014-10-30historical 245-char remark
Show marketing remark (245 chars)
MUST SELL!!! A few blocks from Pretty Water Lake & Sahoma Lake. Custom Built, 24 yr roof, plywood floors, upgraded carpet & vinyl floors. 25x30 garage/shop; 2 sheds - 12x16 & 8x12, 2x4 walls. Plenty of room for larger shop/bldg.
-
2014-07-16$73,000 245-char remark
Show marketing remark (245 chars)
MUST SELL!!! A few blocks from Pretty Water Lake & Sahoma Lake. Custom Built, 24 yr roof, plywood floors, upgraded carpet & vinyl floors. 25x30 garage/shop; 2 sheds - 12x16 & 8x12, 2x4 walls. Plenty of room for larger shop/bldg.
-
2007-10-08historical
-
2007-05-09$80,000
-
2007-05-05historical
-
2007-04-12$87,555
-
2007-04-01historical
-
2007-03-15$87,555
-
2007-03-01historical
-
2007-01-19$95,500
-
1997-10-23soldstatus $29,500
-
1997-09-06historical
-
1997-03-06$34,000
ⓘ Source: listings_history table (triggers on properties + properties_extension) + one-shot
backfill from property_details.listing_events for pre-trigger history.
Tax reassessment forecast OK · Resets to sale price
- Current annual tax
- $697 · $58/mo
- Projected year-2 tax
- $1,606 · $134/mo
- Expected delta
- +$909/yr (+$76/mo · 130.5%)
ⓘ Screening estimate from a state-policy table — verify with the county assessor before closing.
Climate risk First Street
- Flood 1/10 Low FEMA zone X (unshaded) · 0% chance over 30 yrs
- Wildfire 5/10 Major
- Heat 6/10 Major 7 d/yr ≥110°F today · 18 d/yr by 30 yrs out
- Wind 3/10 Moderate 4% chance of damaging wind over 30 yrs
- Air quality 2/10 Low 0 unhealthy d/yr today · 1 by 30 yrs out
Nearby sold comps map
Loading sold comps map…
Walkable amenities ~0.75 mi
Loading nearby amenities…
Taxation est. · year 1
- Rental income
- $14,772
- − Mortgage interest
- −$9,999
- − Property taxes
- −$697
- − Insurance
- −$892
- − Repairs & maintenance
- −$1,182
- − Management
- −$1,182
- − Depreciation
- −$5,193
- Taxable loss
- −$4,373
- Est. tax savings @ 24.0%
- +$1,049
- After-tax cash flow
- $-103/yr
For passive investors: Depreciation is non-cash, so a rental often shows a tax loss while cash-flowing — sheltering income. Rental losses are passive: they offset passive income freely, and up to $25,000/yr can offset ordinary (W-2) income if you actively participate and your MAGI is under $100k (phasing out to $0 by $150k); unused losses carry forward. On sale, claimed depreciation is recaptured at up to 25%, and gains may owe capital-gains tax (a 1031 exchange can defer both). Figures are a year-1 estimate at your 24.0% rate — not tax advice; consult a CPA.
Schools (NCES district)
- District
- Pretty Water
- NCES district ID
- 4025080
- Math proficiency
- 15% ▼ -5.00%
- Reading proficiency
- 20% ▼ -15.00%
- Median HH income
- $59,975
- Composite
- 20.13/100
- National rank
- #13847
- State rank
- #411 of 513 in OK
Livability — Sapulpa
- Score
- 67/100
- State rank
- #88
- US rank
- #10676
Category grades
Schools grade is shown separately in the Schools card above.
Census & demographics
- County
- Creek County · 32,292 people
- City population
- 32,292
- Metro
- Tulsa, OK
- Population (ZIP)
- 32,292
- Household income
- $64,698
- Rent vs Own
- Severe rent burden
- 716.0
Population outlook (Creek County) Hauer SSP2
- Today (2025)
- 72,706 people
- By 2030
- 73,032 · +0.4%
- By 2040
- 72,788 · +0.1%
- By 2050
- 71,558 · -1.6%
- By 2075
- 69,248 · -4.8%
- By 2100
- 62,722 · -13.7%
Race, ethnicity, and origin ACS 2023
- Neighborhood character
- Predominantly White (71%)
- Race & ethnicity
- White 71% Native American 12% Two or more races 9% Hispanic / Latino 6% Black 3%
- Hispanic origin (detail)
- Mexican 4%
- Common ancestry
- Slovak 2% Lithuanian 2% Italian 2%
- Foreign-born
- 2% · Canada
- Languages at home
- 96% English-only · Spanish 3%
Political lean MEDSL · Creek
- 2024 margin
- Solid R (+55.7) · D 21.2% · R 77.0% · Other 1.8%
- 2008→2024 swing
- -14.1pp toward R · 2008: -41.6pp · 2024: -55.7pp
- All cycles
- 2024: R+55.7 2020: R+54.8 2016: R+54.5 2012: R+45.4 2008: R+41.6
Not yet ingested
- Civics
- —
Market trends
- HPI YoY
- ▼ -89.18%
- Current HPI
- 250.2859
- Rent YoY
- —
- Metro
- Tulsa, OK
- State GDP YoY
- ▲ 1.55%
- F500 in state
- 6
Industry mix (Fortune 500 HQ in OK)
| Industry | F500 HQs | Revenue |
|---|---|---|
| Energy | 3 | $48B |
|
||
Price history
+425.0% since first listed18 events — show timeline
- 2026-05-14 Pending — MLS Technology, Inc.
- 2026-03-27 Listed $178,500 MLS Technology, Inc.
- 2020-01-21 Sold (Public Records) $58,000 Public Records
- 2014-11-19 Sold (Public Records) $68,000 Public Records
- 2014-11-19 Sold (MLS) $68,000 MLS Technology, Inc.
- 2014-10-30 Listing Removed — MLS Technology, Inc.
- 2014-07-16 Listed $73,000 MLS Technology, Inc.
- 2007-10-08 Listing Removed — MLS Technology, Inc.
- 2007-05-09 Listed $80,000 MLS Technology, Inc.
- 2007-05-05 Listing Removed — MLS Technology, Inc.
- 2007-04-12 Listed $87,555 MLS Technology, Inc.
- 2007-04-01 Listing Removed — MLS Technology, Inc.
- 2007-03-15 Listed $87,555 MLS Technology, Inc.
- 2007-03-01 Listing Removed — MLS Technology, Inc.
- 2007-01-19 Listed $95,500 MLS Technology, Inc.
- 1997-10-23 Sold (Public Records) $29,500 Public Records
- 1997-09-06 Listing Removed — MLS Technology, Inc.
- 1997-03-06 Listed $34,000 MLS Technology, Inc.
Property tax history
+4.5%/yrLatest (2025): $697 · -2.1% YoY. Source: county tax records.
Cash-flow waterfall
monthlySold comps — $/sqft
last 12 mo · ≤1 miLoading sold comps…