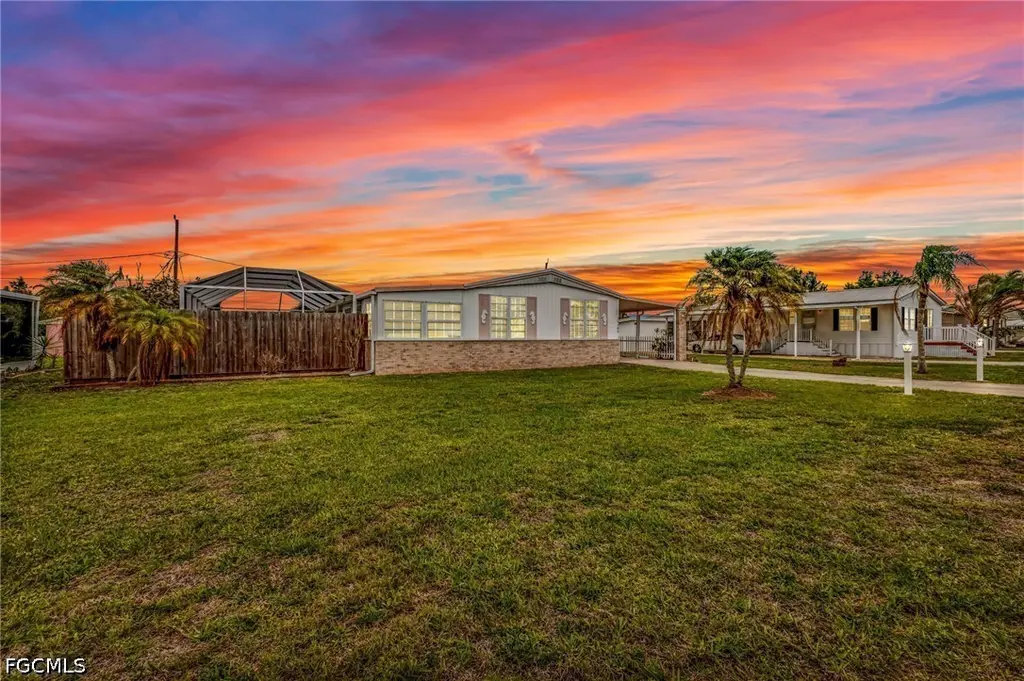
29180 Crawford Ave · Harbour Heights, FL
Flood risk 6/10 · Moderate
- FEMA flood zone
- X (shaded)
- Chance of flooding over 30 yrs
- 0.51%
- Est. flood insurance / yr
- $507 – $1,088
Fire risk 3/10 · Minor
- Est. fire insurance / yr
- $947 – $1,759
Heat risk 10/10 · Severe
- Hot days now (above 108°F)
- 7 days/yr
- Hot days in 30 yrs
- 28 days/yr
Wind risk 10/10 · Severe
- Chance of severe wind over 30 yrs
- 99.0%
Air-quality risk 2/10 · Minimal
- Unhealthy air days now
- 2 days/yr
- Unhealthy air days in 30 yrs
- 2 days/yr
Risk factors via First Street. Map © Google.
Why this score? — see what drove the C grade
The composite is a weighted blend of 9 inputs, each scored 0–100. Each bar is that input's sub-score; the figure is the points it added to the 100-point composite (weight × sub-score).
- Cash flow +21.5/30.0
- ARV discount +7.5/15.0
- DSCR +6.9/10.0
- Schools +4.6/10.0
- 1% rule +4.4/10.0
- Rent growth +3.5/5.0
- Livability +3.2/5.0
- Condition / age +2.5/5.0
- Appreciation +2.4/10.0
$195,000
🖨 Deal sheet 📄 Offer letter ✓ Due diligence
Listing remarks MLS
Welcome to your slice of paradise in Punta Gorda! This charming 2 bed, 2 bath double-wide sits on an oversized lot and offers everything you need to enjoy the Florida lifestyle. Take a dip in your private in-ground pool, relax under the screened pool cage, or unwind in the enclosed porch. The backyard includes a convenient storage shed, and the metal roof provides peace of mind. Don’t miss this opportunity in a beautiful, sought-after location!
Key facts
- Metal roof
- Screened pool cage
- Storage shed
Tags
Property features AI
Finance
- Other: Property is residential on 0.28 acre lot (approx. 1/4 to less than 1/2 acre); Zoned MHC (manufactured home community)
- HOA & community: No association fees
Exterior
- Parking: Carport with 2 spaces
- Utilities: Well water; Septic tank; Electricity connected; Cable connected
- Home design: Manufactured double-wide home; One story; Home faces south; Crawlspace foundation
- Construction: Vinyl siding; Metal roof; Built on crawlspace
- Exterior features: French doors; Wood fencing; Private heated in-ground pool with screen enclosure
Interior
- Kitchen: Range; Microwave; Refrigerator; Dishwasher
- Bedrooms: 2 bedrooms
- Flooring: Carpet; Tile; Vinyl
- Bathrooms: 2 full bathrooms
- Heating & cooling: Central heating; Central air conditioning
- Interior features: Ceiling fans
- Laundry & utility: Washer; Dryer; Outdoor laundry area
Neighborhood map
What this means for you Summary
Snapshot
- This is a 2-bed/2.0-bath manufactured listed at $195k.
Deal economics
- At list price, monthly cash flow is $294 ($4k/yr) — positive.
- The deal already cash-flows at list — no discount required.
- To meet the 1% rule (rent ≥ 1% of price), the offer needs to be $183k (5.9% below list).
- Recommended offer: $183k (6.0% below list) — sets the bar for market timing.
- Cap rate 8.1% vs local median 4.0% in Harbour Heights — top-decile yield for the area; either an underpriced asset or a hidden risk that comps aren't pricing in. Stress-test before assuming the spread holds.
Location & tenants
- Location reads 64/100 on livability (#684 in FL) — a middle-class / working-renter tenant base. Strengths: crime A+, housing A+, employment B; Watch: schools F, amenities F, commute F.
- Charlotte (suburban): math 54% / reading 54% proficiency, ranked #22 of 73 in FL (top 30%) — acceptable for families but not a draw, mixed tenant base, ~2y average lease.
- Market conditions: Rents rising fast (+4.1%/yr); 1037 active listings in the ZIP; 5 comparable units currently listed for rent nearby; rentals leasing fast (median 14d on market — plan ~1-2 weeks tenant-placement turnaround); 4,585 units permitted in Charlotte County in 2024 (703 in 5+ unit buildings).
- This rent runs 30% of the median local income ($72k/yr) — at the standard rent-burdened threshold; future hikes will face affordability resistance.
Forward outlook
- Local home prices are declining (-3.0%/yr); year-one equity from $1k of loan paydown is wiped out by about $6k of value loss. Plan a longer hold.
- Charlotte County population projected at +24% by 2050 — long-run rental-demand tailwind backs the buy-and-hold thesis.
Negotiation context
- It's been on market 67 days — a 6% lower offer ($183k) is reasonable based on typical stale-listing flexibility.
- 2 sale attempts with the ask held roughly flat each time — persistent listings suggest the price (not the market) is what's stuck; bring a comps-based counter.
- Current owner paid $41k; list at $195k implies a 376% gain — meaningful room to come down on a strong offer.
Risks & watch-outs
- Climate carrying-cost: major flood risk; severe wind risk, 99% chance of damaging wind over 30y; extreme-heat days projected 7→28/yr by 2055 (HVAC capex compounding) — expect insurance premiums to compound above CPI over the hold.
Questions for the listing agent
- It's been on market 67 days. Have you received any prior offers? Is the seller open to a 6% concession, seller financing, or rate buy-down credit?
- Why hasn't it sold? Are there any deal-killer items the seller is aware of (foundation, flood, title, zoning, code violations)?
- Is there a deadline driving the sale (1031 exchange, divorce, estate, relocation)? That informs how much negotiation room exists.
- Schools are F-rated, which usually means shorter tenancies and higher turnover. Who's the typical renter profile here, and what's been the actual vacancy rate?
- What's the average days-on-market for RENTAL listings here right now (not sales)? A rising rental-DOM trend means longer vacancies and softer asking-rent achievability than the comps imply.
- What's the recent tenant-quality profile in this submarket — average credit score on applications, eviction rate, late-payment / NSF rate, and stable-employment percentage? A property-management company in the area should have these aggregated.
- How much new for-sale + rental construction is in the pipeline within 1–3 miles? Heavy new supply typically softens prices + rents 12–24 months out; constrained supply supports both.
Investment metrics
- 1% rule
- 0.94% ✗
- Cap rate
- 8.10%
- Cash-on-cash
- 6.45%
- DSCR
- 1.29
- GRM
- 8.9
CMA / ARV
No comps found within radius.
Projected returns pro-forma
-3.0% appreciation · 4.13% rent growth · sell at horizon
- IRR
- -5.3%
- Equity multiple
- 0.80×
- Total profit
- $-10,880
- Equity at exit
- $29,075
- IRR
- 5.5%
- Equity multiple
- 1.42×
- Total profit
- $23,093
- Equity at exit
- $16,860
Cash invested: $54,600 (down + closing). Projections, not guarantees.
Landlord ↔ Tenant lean methodology
- Overall (STATE)
- 87 Strongly Landlord-Friendly
- State Florida
- 87 Strongly Landlord-Friendly · R+3
- County
- — inherits STATE
- City
- — inherits STATE
ZIP-level market 33982
- Home prices YoY
- -1.2%
- Rents YoY
- 4.1%
- Active inventory
- 1037
- Price-to-rent
- 8.9×
Monthly cashflow live
- Estimated rent
- $1,834 high interval (Pro) →
- Mortgage (P&I)
- −$1,023
- Tax from tax record
- −$52 /mo · $619/yr
- Insurance
- −$81
- HOA
- −$0
- Vacancy / Maint / Mgmt
- −$385
- Net cashflow
- $294
Break-even live
UW: 25.0% down · 7.5% · 30yr · 1.5% tax · 5.0% vac · 8.0% maint · 8.0% mgmt
Financing live
Cash to close
- Down payment
- $48,750
- Closing costs
- $5,850
- Reserves months
- —
- Total cash needed
- —
Loan-product check · same deal, 3 products live
Conventional
25% down · 7.5% · 30yr
- Down + closing
- —
- Monthly P&I
- —
- Monthly cashflow
- —
- DSCR
- —
- Eligible?
- —
Personal DTI + credit; lowest rate.
DSCR
20% down · 8.5% · 30yr
- Down + closing
- —
- Monthly P&I
- —
- Monthly cashflow
- —
- DSCR
- —
- Eligible?
- —
No personal income docs; deal must DSCR.
Hard money
10% down · 12.0% · 12mo
- Down + closing
- —
- Monthly P&I
- —
- Monthly cashflow
- —
- DSCR
- —
- Eligible?
- —
Short-term bridge; refi at stabilization.
Rent comps 5 comps
| Address | Beds | Baths | Sqft | Rent | $/sqft | DOM | Units | Dist |
|---|---|---|---|---|---|---|---|---|
| 322 Organ St Unit A Punta Gorda, FL | 2.0 | 1.0 | 925 | $1,350 | $1.46 | 13d | 1 | 1.00mi |
| 29469 Peace River Shores Blvd Punta Gorda, FL | 2.0 | 2.0 | 1045 | $1,495 | $1.43 | 21d | 1 | 1.04mi |
| Organ St , FL | 2.0 | 2.0 | 1000 | $1,500 | $1.50 | 21d | 1 | 1.17mi |
| 114 Organ St Punta Gorda, FL | 2.0 | 2.0 | 1045 | $1,495 | $1.43 | 13d | 1 | 1.33mi |
| 18 Organ St Unit 18 Punta Gorda, FL | 3.0 | 2.0 | 1200 | $2,400 | $2.00 | 13d | 1 | 1.49mi |
Listing history 22 events
-
2026-06-18days on market $195,000 Active 67 DOM
-
2026-06-17days on market $195,000 Active 66 DOM
-
2026-06-16price $195,000 Active 65 DOM
-
2026-06-16days on market $199,900 Active 65 DOM
-
2026-06-15days on market $199,900 Active 64 DOM
-
2026-06-14days on market $199,900 Active 62 DOM
-
2026-06-13days on market $199,900 Active 61 DOM
-
2026-06-10days on market $199,900 Active 59 DOM
-
2026-06-09days on market $199,900 Active 58 DOM
-
2026-06-08days on market $199,900 Active 57 DOM
-
2026-06-07days on market $199,900 Active 56 DOM
-
2026-06-05days on market $199,900 Active 53 DOM
-
2026-06-03days on market $199,900 Active 52 DOM
-
2026-06-02days on market $199,900 Active 51 DOM
-
2026-06-01days on market $199,900 Active 50 DOM
-
2026-05-31days on market $199,900 Active 49 DOM
-
2026-05-30days on market $199,900 Active 48 DOM
-
2026-05-05$199,900 Active 454-char remark
Show marketing remark (454 chars)
Welcome to your slice of paradise in Punta Gorda! This charming 2 bed, 2 bath double-wide sits on an oversized lot and offers everything you need to enjoy the Florida lifestyle. Take a dip in your private in-ground pool, relax under the screened pool cage, or unwind in the enclosed porch. The backyard includes a convenient storage shed, and the metal roof provides peace of mind. Don’t miss this opportunity in a beautiful, sought-after location!
-
2026-04-30price $199,900
-
2026-04-12$215,000 Active
-
1996-03-06soldstatus $41,000
-
1985-07-01soldstatus $10,100
ⓘ Source: listings_history table (triggers on properties + properties_extension) + one-shot
backfill from property_details.listing_events for pre-trigger history.
Tax reassessment forecast FL · Resets to sale price
- Current annual tax
- $619 · $52/mo
- Projected year-2 tax
- $1,618 · $135/mo
- Expected delta
- +$1,000/yr (+$83/mo · 161.6%)
ⓘ Screening estimate from a state-policy table — verify with the county assessor before closing.
Climate risk First Street
- Flood 6/10 Major FEMA zone X (shaded) · 51% chance over 30 yrs
- Wildfire 3/10 Moderate
- Heat 10/10 Extreme 7 d/yr ≥108°F today · 28 d/yr by 30 yrs out
- Wind 10/10 Extreme 99% chance of damaging wind over 30 yrs
- Air quality 2/10 Low 2 unhealthy d/yr today · 2 by 30 yrs out
Nearby sold comps map
Loading sold comps map…
Walkable amenities ~0.75 mi
Loading nearby amenities…
Taxation est. · year 1
- Rental income
- $22,011
- − Mortgage interest
- −$10,923
- − Property taxes
- −$619
- − Insurance
- −$975
- − Repairs & maintenance
- −$1,761
- − Management
- −$1,761
- − Depreciation
- −$5,673
- Taxable income
- $299
- Est. tax owed @ 24.0%
- −$72
- After-tax cash flow
- $3,451/yr
For passive investors: Depreciation is non-cash, so a rental often shows a tax loss while cash-flowing — sheltering income. Rental losses are passive: they offset passive income freely, and up to $25,000/yr can offset ordinary (W-2) income if you actively participate and your MAGI is under $100k (phasing out to $0 by $150k); unused losses carry forward. On sale, claimed depreciation is recaptured at up to 25%, and gains may owe capital-gains tax (a 1031 exchange can defer both). Figures are a year-1 estimate at your 24.0% rate — not tax advice; consult a CPA.
Schools (NCES district)
- District
- Charlotte
- NCES district ID
- 1200240
- Math proficiency
- 54% ▼ -6.00%
- Reading proficiency
- 54% ▼ -1.00%
- Median HH income
- $44,864
- Composite
- 45.62/100
- National rank
- #2586
- State rank
- #22 of 73 in FL
Livability — Harbour Heights
- Score
- 64/100
- State rank
- #684
- US rank
- #14202
Category grades
Schools grade is shown separately in the Schools card above.
Census & demographics
- County
- Charlotte County · 196,994 people
- Metro
- Punta Gorda, FL
- Population (ZIP)
- 13,006
- Household income
- $72,443
- Rent vs Own
- Severe rent burden
- 43.0
Population outlook (Charlotte County) Hauer SSP2
- Today (2025)
- 198,646 people
- By 2030
- 210,507 · +6.0%
- By 2040
- 230,857 · +16.2%
- By 2050
- 247,148 · +24.4%
- By 2075
- 281,777 · +41.8%
- By 2100
- 293,609 · +47.8%
Race, ethnicity, and origin ACS 2023
- Neighborhood character
- Predominantly White (81%)
- Race & ethnicity
- White 81% Two or more races 8% Hispanic / Latino 7% Black 7%
- Hispanic origin (detail)
- Puerto Rican 2% Cuban 3%
- Common ancestry
- Lithuanian 3% Iranian 3% Slovak 3%
- Foreign-born
- 6% · Canada, Jamaica
- Languages at home
- 93% English-only · Spanish 5% German/W. Germanic 1% Arabic 1%
Political lean MEDSL · Charlotte
- 2024 margin
- Solid R (+34.0) · D 32.7% · R 66.7%
- 2008→2024 swing
- -26.7pp toward R · 2008: -7.2pp · 2024: -34.0pp
- All cycles
- 2024: R+34.0 2020: R+26.6 2016: R+27.8 2012: R+14.3 2008: R+7.2
Not yet ingested
- Civics
- —
Market trends
- HPI YoY
- ▼ -5.25%
- Current HPI
- 448.5895
- Rent YoY
- ▲ 4.13%
- Metro
- Punta Gorda, FL
- State GDP YoY
- ▲ 3.28%
- F500 in state
- 36
Industry mix (Fortune 500 HQ in FL)
| Industry | F500 HQs | Revenue |
|---|---|---|
| Industrial Technology | 2 | $29B |
|
||
| Insurance | 2 | $17B |
|
||
| Retail | 1 | $60B |
|
||
| Technology Distribution | 1 | $58B |
|
||
| Homebuilding | 1 | $35B |
|
||
| Technology Manufacturing | 1 | $35B |
|
||
Price history
+1879.2% since first listed5 events — show timeline
- 2026-05-05 Listed $199,900 FORTMLS
- 2026-04-30 Price Changed $199,900 Stellar MLS as Distributed by MLS Grid
- 2026-04-12 Listed $215,000 Stellar MLS as Distributed by MLS Grid
- 1996-03-06 Sold (Public Records) $41,000 Public Records
- 1985-07-01 Sold (Public Records) $10,100 Public Records
Property tax history
+2.9%/yrLatest (2025): $619 · +6.2% YoY. Source: county tax records.
Cash-flow waterfall
monthlySold comps — $/sqft
last 12 mo · ≤1 miLoading sold comps…