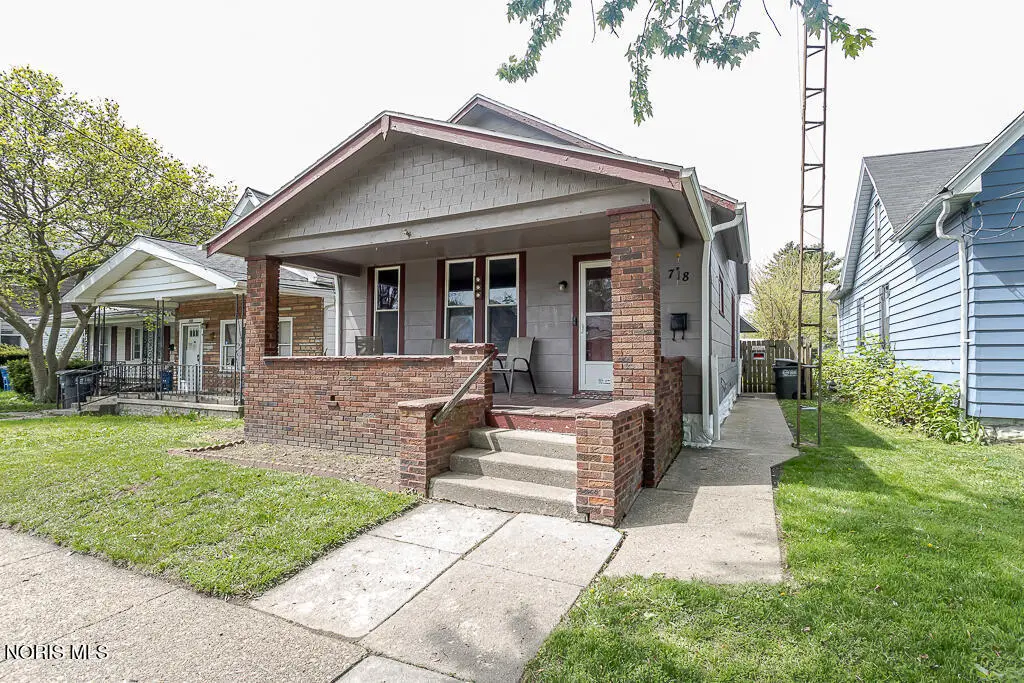
718 Plymouth St · Toledo, OH
Flood risk 1/10 · Minimal
- FEMA flood zone
- X (unshaded)
- Chance of flooding over 30 yrs
- 0.0%
- Est. flood insurance / yr
- $473 – $860
Fire risk 1/10 · Minimal
- Est. fire insurance / yr
- $713 – $1,323
Heat risk 3/10 · Minor
- Hot days now (above 100°F)
- 7 days/yr
- Hot days in 30 yrs
- 16 days/yr
Wind risk 2/10 · Minimal
- Chance of severe wind over 30 yrs
- —
Air-quality risk 2/10 · Minimal
- Unhealthy air days now
- 1 days/yr
- Unhealthy air days in 30 yrs
- 2 days/yr
Risk factors via First Street. Map © Google.
Why this score? — see what drove the B+ grade
The composite is a weighted blend of 9 inputs, each scored 0–100. Each bar is that input's sub-score; the figure is the points it added to the 100-point composite (weight × sub-score).
- Cash flow +30.0/30.0
- ARV discount +15.0/15.0
- DSCR +10.0/10.0
- 1% rule +9.4/10.0
- Rent growth +3.8/5.0
- Livability +3.3/5.0
- Condition / age +2.5/5.0
- Schools +1.6/10.0
- Appreciation +0.0/10.0
$84,900
🖨 Deal sheet (PDF) 📄 Offer letter ✓ Due diligence
Listing remarks MLS
IMPRESS YOUR BUYER-GET INSIDE! NEWER CARPET THROUGHOUT, NICE KITCHEN, TILE SINK, ECT. LOOKS LIKE NEW. FRESHLY PAINTED INTERIOR. VERY CLEAN! TOP TO BOTTOM TALL BASMENT. ALL APPLIANCES STAY. ALL NEW WATER LINES APPROX 1 YR. HOT WATER TANK NEW. ROOF ALSO MAIN HOUSE IN 99. FLAT ROOF 4 YRS. CLEAN, BRIGHT! BRING OFFER! INFO C: 3321
Key facts
- 3,800 sq ft lot
- Built 1887
Property features AI
Finance
- HOA & community: Curbs, street lights, and sidewalks in the community
Exterior
- Parking: Off-street parking with alley access
- Utilities: Electricity available and connected; Natural gas connected; Public water; Public sewer
- Home design: Single-family residence; House with one and one-half levels; No shared/common walls; Estimated living area
- Construction: Brick and shake siding exterior; Block foundation; Shingle roof; Has unfinished block basement
- Exterior features: Front porch; Rear patio; Wood fencing; Shed(s)
Interior
- Kitchen: Gas range; Range hood; Refrigerator
- Bedrooms: Main-level bedrooms (three): approx. 10x9, 7x10, and additional main bedroom dimensions; Upper-level bedroom: approx. 15x12
- Flooring: Carpet; Vinyl
- Bathrooms: 1 full bathroom
- Heating & cooling: Natural gas heating; Window cooling units
- Interior features: Double-pane, insulated windows with screens; 7 total rooms; Other interior features
- Laundry & utility: Washer hookup in basement; Gas dryer hookup; Washer and dryer included; Water heater included
Neighborhood map
What this means for you Summary
Snapshot
- This is a 4-bed/1.0-bath single-family listed at $85k.
Deal economics
- At list price, monthly cash flow is $407 ($5k/yr) — positive.
- The deal already cash-flows at list — no discount required.
- Meets the 1% rule at list price ($1k rent vs $85k).
- Cap rate 12.0% vs local median 7.6% in Toledo — top-decile yield for the area; either an underpriced asset or a hidden risk that comps aren't pricing in. Stress-test before assuming the spread holds.
Location & tenants
- Location reads 66/100 on livability (#645 in OH) — a middle-class / working-renter tenant base. Strengths: cost of living A+, housing A+, health & safety A+; Watch: amenities C-, crime F, commute F.
- Toledo City (urban): math 15% / reading 24% proficiency, ranked #634 of 656 in OH (top 97%) — low school quality limits family demand, transient renter base, plan for 1-2y turnover; 72% free/reduced lunch — lower-income household profile, screen leases tightly.
- Zoned schools: Raymer Elementary School (math 14% / reading 16%, grade F, #1,377 of 1,584 statewide, top 87%, 424 students, 0% FRL); Waite High School (math 12% / reading 24%, grade F, #687 of 781 statewide, top 88%, 997 students, 0% FRL) — zoned schools average 0% FRL vs 72% district-wide (72 pts lower); this property's tenant base skews higher-income than the district average.
- Market conditions: Rents rising fast (+5.4%/yr); 117 active listings in the ZIP; 21 comparable units currently listed for rent nearby; rentals at typical pace (median 24d on market — plan ~3-4 weeks tenant-placement turnaround); lower-income renter base — watch delinquency; 415 units permitted in Lucas County in 2024 (122 in 5+ unit buildings).
- This rent runs 37% of the median local income ($39k/yr) — at the standard rent-burdened threshold; future hikes will face affordability resistance.
Forward outlook
- Local home prices are declining (-3.0%/yr); year-one equity from $587 of loan paydown is wiped out by about $3k of value loss. Plan a longer hold.
- Lucas County population projected at -16% by 2050 — secular population decline; favor cash flow + early exit over multi-decade hold.
- At projected returns (-3.0% appreciation + 5.4% rent growth), your $24k cash investment doubles in ~6 years — after that, you're playing with house money.
Negotiation context
- Only 1 days on market — expect competitive offers; lowballing is unlikely to land.
- Current owner paid $52k; list at $85k implies a 63% gain — meaningful room to come down on a strong offer.
Risks & watch-outs
- Watch-outs: built in 1887 — expect roof / HVAC / electrical / plumbing capex.
Questions for the listing agent
- Built in 1887 — when were the roof, HVAC, electrical panel, plumbing, and water heater last replaced?
- Is there a deadline driving the sale (1031 exchange, divorce, estate, relocation)? That informs how much negotiation room exists.
- Schools are D-rated, which usually means shorter tenancies and higher turnover. Who's the typical renter profile here, and what's been the actual vacancy rate?
- Crime grade is F in this area — have there been break-ins, vandalism, or insurance claims at this property in the last 3 years? What carrier currently insures it and at what premium?
- What's the average days-on-market for RENTAL listings here right now (not sales)? A rising rental-DOM trend means longer vacancies and softer asking-rent achievability than the comps imply.
- What's the recent tenant-quality profile in this submarket — average credit score on applications, eviction rate, late-payment / NSF rate, and stable-employment percentage? A property-management company in the area should have these aggregated.
- How much new for-sale + rental construction is in the pipeline within 1–3 miles? Heavy new supply typically softens prices + rents 12–24 months out; constrained supply supports both.
Investment metrics
- 1% rule
- 1.44% ✓
- Cap rate
- 12.05%
- Cash-on-cash
- 20.56%
- DSCR
- 1.91
- GRM
- 5.8
CMA / ARV
- ARV (on-the-fly)
- $113,627
- Comps found
- 12
Show comp detail 12 sales within ~0.75 mi
| Address | Dist | Beds/Ba | Sqft | Sold | Price | $/sf | Match |
|---|---|---|---|---|---|---|---|
| 1129 Camden St | 0.15mi | 3/1.0 (-1) | 1,260 (-8%) | 4mo | $55,000 | $44 | 72 |
| 358 Spring Grove Ave | 0.52mi | 3/1.0 (-1) | 1,380 (+1%) | 2mo | $110,000 | $80 | 68 |
| 715 Raymer Blvd | 0.15mi | 3/2.0 (-1) | 1,481 (+8%) | 3mo | $71,500 | $48 | 68 |
| 937 Berry St | 0.42mi | 3/1.0 (-1) | 1,282 (-6%) | 3mo | $63,000 | $49 | 62 |
| 1308 Halstead St | 0.29mi | 3/1.0 (-1) | 1,246 (-9%) | 6mo | $40,050 | $32 | 62 |
| 2053 Idaho St | 0.61mi | 3/2.0 (-1) | 1,402 (+2%) | 2mo | $165,000 | $118 | 57 |
| 427 Walden Ave | 0.65mi | 3/2.0 (-1) | 1,290 (-6%) | 1mo | $51,000 | $40 | 50 |
| 1230 Hirzel St | 0.60mi | 4/2.0 | 1,496 (+9%) | 3mo | $140,000 | $94 | 50 |
| 1940 Hurd St | 0.47mi | 3/1.0 (-1) | 1,200 (-12%) | 4mo | $99,900 | $83 | 49 |
| 833 Kingston Ave | 0.61mi | 3/1.0 (-1) | 1,202 (-12%) | 3mo | $140,000 | $116 | 44 |
| 2003 Idaho St | 0.52mi | 3/1.0 (-1) | 1,172 (-14%) | 5mo | $120,000 | $102 | 43 |
| 256 Midvale Ave | 0.69mi | 3/1.0 (-1) | 1,180 (-14%) | 4mo | $137,300 | $116 | 37 |
Match score weights: distance 35% · size 25% · config 20% · recency 20%. Top-matched comps best support the ARV.
Projected returns pro-forma
-3.0% appreciation · 5.37% rent growth · sell at horizon
- IRR
- 15.4%
- Equity multiple
- 1.64×
- Total profit
- $15,156
- Equity at exit
- $12,659
- IRR
- 25.8%
- Equity multiple
- 3.50×
- Total profit
- $59,416
- Equity at exit
- $7,341
Cash invested: $23,772 (down + closing). Projections, not guarantees.
Landlord ↔ Tenant lean methodology
- Overall (STATE)
- 73 Landlord-Friendly
- State Ohio
- 73 Landlord-Friendly · R+6
- County
- — inherits STATE
- City
- — inherits STATE
ZIP-level market 43605
- Home prices YoY
- -25.6%
- Rents YoY
- 5.4%
- Active inventory
- 117
- Price-to-rent
- 5.8×
Monthly cashflow live
- Estimated rent
- $1,219 high interval (Pro) →
- Mortgage (P&I)
- −$445
- Tax from tax record
- −$75 /mo · $905/yr
- Insurance
- −$35
- HOA
- −$0
- Vacancy / Maint / Mgmt
- −$256
- Net cashflow
- $407
Break-even live
Sensitivity live
| Price | -10% $455 | -5% $431 | +0% $407 | +5% $383 | +10% $359 |
|---|---|---|---|---|---|
| Rent | -10% $311 | -5% $359 | +0% $407 | +5% $455 | +10% $504 |
| Rate | -1.0pp $450 | -0.5pp $429 | base $407 | +0.5pp $385 | +1.0pp $363 |
UW: 25.0% down · 7.5% · 30yr · 1.5% tax · 5.0% vac · 8.0% maint · 8.0% mgmt
Financing live
Cash to close
- Down payment
- $21,225
- Closing costs
- $2,547
- Reserves months
- —
- Total cash needed
- —
Loan-product check · same deal, 3 products live
Conventional
25% down · 7.5% · 30yr
- Down + closing
- —
- Monthly P&I
- —
- Monthly cashflow
- —
- DSCR
- —
- Eligible?
- —
Personal DTI + credit; lowest rate.
DSCR
20% down · 8.5% · 30yr
- Down + closing
- —
- Monthly P&I
- —
- Monthly cashflow
- —
- DSCR
- —
- Eligible?
- —
No personal income docs; deal must DSCR.
Hard money
10% down · 12.0% · 12mo
- Down + closing
- —
- Monthly P&I
- —
- Monthly cashflow
- —
- DSCR
- —
- Eligible?
- —
Short-term bridge; refi at stabilization.
Rent comps 21 comps
| Address | Beds | Baths | Sqft | Rent | $/sqft | DOM | Units | Dist |
|---|---|---|---|---|---|---|---|---|
| 1505 Navarre Ave Toledo, OH | 3.0 | 1.0 | 1331 | $1,145 | $0.86 | 44d | 1 | 0.17mi |
| 948 White St Toledo, OH | 3.0 | 1.0 | 1024 | $1,135 | $1.11 | 14d | 1 | 0.21mi |
| 1106 White St Toledo, OH | 3.0 | 1.0 | 1200 | $1,015 | $0.85 | 14d | 1 | 0.32mi |
| 908 Forsythe St Unit Downstairs Toledo, OH | 3.0 | 1.0 | 1164 | $950 | $0.82 | 44d | 1 | 0.39mi |
| 921 Berry St Toledo, OH | 4.0 | 1.0 | 1204 | $1,350 | $1.12 | 14d | 1 | 0.43mi |
| 29 Garfield Pl Toledo, OH | 4.0 | 2.0 | 1300 | $1,250 | $0.96 | 14d | 1 | 0.52mi |
| 606 Earl St Toledo, OH | 3.0 | 1.5 | 1700 | $1,150 | $0.68 | 21d | 1 | 0.60mi |
| 245 Plymouth St Toledo, OH | 3.0 | 1.0 | 1600 | $1,125 | $0.70 | 14d | 1 | 0.61mi |
| 414 Platt St Unit ST-3 Toledo, OH | 3.0 | 1.0 | 1500 | $1,150 | $0.77 | 24d | 1 | 0.69mi |
| 2074 Starr Ave Toledo, OH | 3.0 | 1.0 | 1115 | $1,025 | $0.92 | 24d | 1 | 0.72mi |
| 834 Oak St Toledo, OH | 3.0 | 1.0 | 1064 | $900 | $0.85 | 44d | 1 | 0.73mi |
| 2129 Nevada St Toledo, OH | 3.0 | 1.0 | 1352 | $1,200 | $0.89 | 14d | 1 | 0.73mi |
| 732 Coyne Ave Toledo, OH | 3.0 | 1.0 | 968 | $1,145 | $1.18 | 14d | 1 | 0.75mi |
| 1306 Mott Ave Toledo, OH | 3.0 | 1.5 | 1282 | $1,149 | $0.90 | 44d | 1 | 0.93mi |
| 1305 Mott Ave Toledo, OH | 3.0 | 1.0 | 1080 | $1,000 | $0.93 | 44d | 1 | 0.94mi |
| 221 Licking St Unit 2 Toledo, OH | 3.0 | 1.0 | 1048 | $1,099 | $1.05 | 24d | 1 | 0.95mi |
| 20 Greenwood Ave Toledo, OH | 3.0 | 1.0 | 1496 | $1,150 | $0.77 | 14d | 1 | 0.98mi |
| 128 Carbon St Toledo, OH | 3.0 | 1.0 | 1113 | $1,200 | $1.08 | 24d | 1 | 1.10mi |
| 1537 Remington St Toledo, OH | 3.0 | 1.0 | 1064 | $1,095 | $1.03 | 44d | 1 | 1.18mi |
| 1848 Genesee St Toledo, OH | 3.0 | 1.0 | 1069 | $1,300 | $1.22 | 24d | 1 | 1.48mi |
| 1848 Genesee St Toledo, OH | 3.0 | 1.0 | 1069 | $1,200 | $1.12 | 44d | 1 | 1.48mi |
Listing history 3 events
-
2026-06-18remarks 699-char remark
-
2026-06-18status $84,900 Active 1 DOM
-
2026-06-17$84,900 Coming Soon 1 DOM
ⓘ Source: listings_history table (triggers on properties + properties_extension) + one-shot
backfill from property_details.listing_events for pre-trigger history.
Tax reassessment forecast OH · Partial reset (capped growth)
- Current annual tax
- $905 · $75/mo
- Projected year-2 tax
- $1,114 · $93/mo
- Expected delta
- +$210/yr (+$17/mo · 23.2%)
ⓘ Screening estimate from a state-policy table — verify with the county assessor before closing.
Climate risk First Street
- Flood 1/10 Low FEMA zone X (unshaded) · 0% chance over 30 yrs
- Wildfire 1/10 Low
- Heat 3/10 Moderate 7 d/yr ≥100°F today · 16 d/yr by 30 yrs out
- Wind 2/10 Low
- Air quality 2/10 Low 1 unhealthy d/yr today · 2 by 30 yrs out
Nearby sold comps map
Loading sold comps map…
Walkable amenities ~0.75 mi
Loading nearby amenities…
Taxation est. · year 1
- Rental income
- $14,631
- − Mortgage interest
- −$4,756
- − Property taxes
- −$905
- − Insurance
- −$424
- − Repairs & maintenance
- −$1,171
- − Management
- −$1,171
- − Depreciation
- −$2,470
- Taxable income
- $3,736
- Est. tax owed @ 24.0%
- −$897
- After-tax cash flow
- $3,990/yr
For passive investors: Depreciation is non-cash, so a rental often shows a tax loss while cash-flowing — sheltering income. Rental losses are passive: they offset passive income freely, and up to $25,000/yr can offset ordinary (W-2) income if you actively participate and your MAGI is under $100k (phasing out to $0 by $150k); unused losses carry forward. On sale, claimed depreciation is recaptured at up to 25%, and gains may owe capital-gains tax (a 1031 exchange can defer both). Figures are a year-1 estimate at your 24.0% rate — not tax advice; consult a CPA.
Schools (NCES district)
- District
- Toledo City
- NCES district ID
- 3904490
- Math proficiency
- 15% ▼ -16.00%
- Reading proficiency
- 24% ▼ -13.00%
- Median HH income
- $32,137
- Composite
- 15.76/100
- National rank
- #9276
- State rank
- #634 of 656 in OH
Livability — Toledo
- Score
- 66/100
- State rank
- #645
- US rank
- #11442
Category grades
Schools grade is shown separately in the Schools card above.
Census & demographics
- Census place
- Toledo, OH
- County
- Lucas County · 380,724 people
- City population
- 280,811
- Metro
- Toledo, OH
- Population (ZIP)
- 24,441
- Household income
- $39,118
- Rent vs Own
- Severe rent burden
- 1257.0
Population outlook (Lucas County) Hauer SSP2
- Today (2025)
- 420,751 people
- By 2030
- 410,187 · -2.5%
- By 2040
- 384,019 · -8.7%
- By 2050
- 355,125 · -15.6%
- By 2075
- 291,683 · -30.7%
- By 2100
- 233,670 · -44.5%
Race, ethnicity, and origin ACS 2023
- Neighborhood character
- Diverse neighborhood (Simpson 0.61)
- Race & ethnicity
- White 57% Hispanic / Latino 21% Black 14% Two or more races 14%
- Hispanic origin (detail)
- Mexican 17% Puerto Rican 2%
- Common ancestry
- Romanian 3% Lithuanian 2% Portuguese 1%
- Foreign-born
- 3% · Canada
- Languages at home
- 91% English-only · Spanish 7% Arabic 1%
Political lean MEDSL · Lucas
- 2024 margin
- D (+12.6) · D 55.8% · R 43.2%
- 2008→2024 swing
- -18.9pp toward R · 2008: 31.4pp · 2024: 12.6pp
- All cycles
- 2024: D+12.6 2020: D+16.8 2016: D+17.4 2012: D+30.4 2008: D+31.4
Not yet ingested
- Civics
- —
Market trends
- HPI YoY
- ▼ -47.85%
- Current HPI
- 138.6894
- Rent YoY
- ▲ 5.37%
- Metro
- Toledo, OH
- State GDP YoY
- ▲ 1.98%
- F500 in state
- 48
Industry mix (Fortune 500 HQ in OH)
| Industry | F500 HQs | Revenue |
|---|---|---|
| Insurance | 3 | $145B |
|
||
| Industrial Machinery | 3 | $49B |
|
||
| Financial Services | 3 | $24B |
|
||
| Consumer Goods | 2 | $93B |
|
||
| Aerospace / Defense | 2 | $47B |
|
||
| Utilities | 2 | $33B |
|
||
Price history
+56.5% since first listed5 events — show timeline
- 2026-06-17 Coming Soon $84,900 NORIS
- 2025-10-09 Price Changed $52,000 NORIS
- 2001-03-09 Sold (MLS) $52,000 NORIS
- 2001-03-08 Price Changed $54,250 NORIS
- 2001-01-08 Listed $54,250 NORIS
Property tax history
+1.2%/yrLatest (2025): $905 · +1.6% YoY. Source: county tax records.
Cash-flow waterfall
monthlySold comps — $/sqft
last 12 mo · ≤1 miLoading sold comps…