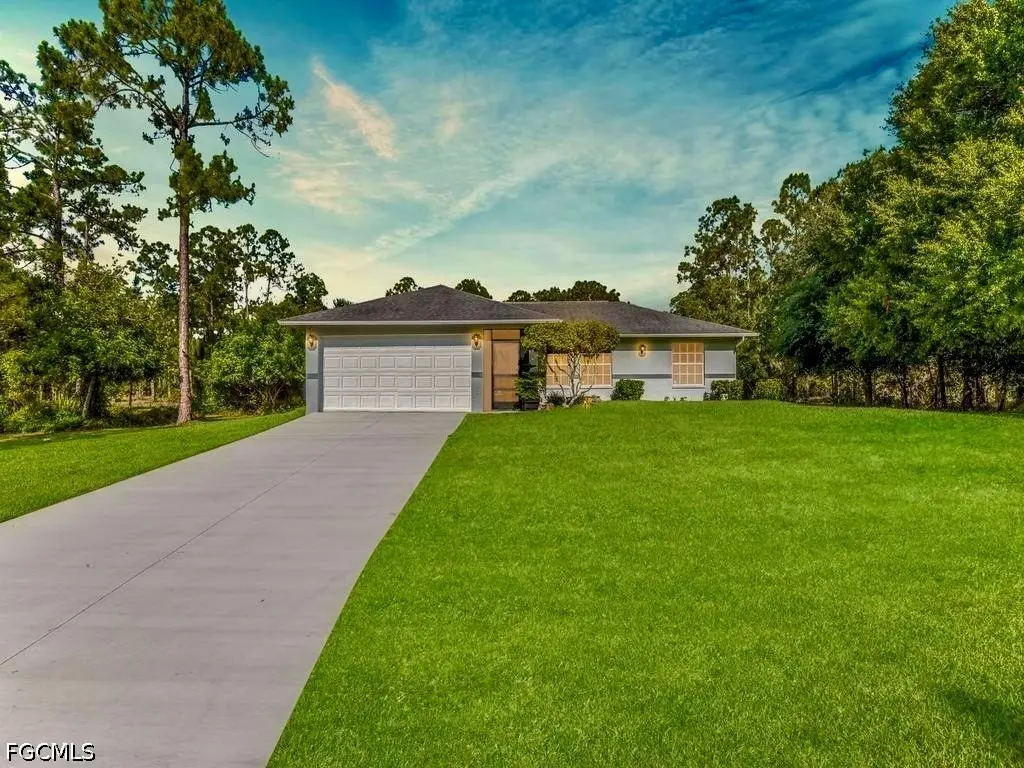
1315 Johns Ave · Lehigh Acres, FL
Flood risk 1/10 · Minimal
- FEMA flood zone
- X (shaded)
- Chance of flooding over 30 yrs
- 0.0%
- Est. flood insurance / yr
- $507 – $1,088
Fire risk 3/10 · Minor
- Est. fire insurance / yr
- $947 – $1,759
Heat risk 9/10 · Severe
- Hot days now (above 108°F)
- 7 days/yr
- Hot days in 30 yrs
- 26 days/yr
Wind risk 10/10 · Severe
- Chance of severe wind over 30 yrs
- 99.0%
Air-quality risk 2/10 · Minimal
- Unhealthy air days now
- 2 days/yr
- Unhealthy air days in 30 yrs
- 2 days/yr
Risk factors via First Street. Map © Google.
Why this score? — see what drove the F grade
The composite is a weighted blend of 9 inputs, each scored 0–100. Each bar is that input's sub-score; the figure is the points it added to the 100-point composite (weight × sub-score).
- Cash flow +11.4/30.0
- Schools +4.1/10.0
- Rent growth +3.8/5.0
- DSCR +3.3/10.0
- ARV discount +3.3/15.0
- Livability +3.0/5.0
- 1% rule +2.5/10.0
- Condition / age +2.5/5.0
- Appreciation +0.0/10.0
$275,000
🖨 Deal sheet 📄 Offer letter ✓ Due diligence
Listing remarks MLS
This affordable home is in move in condition, it features 3 bedrooms, 2 baths, attached 2 car garage, screened lanai, and it's on a half acre lot. Traditional sale with quick response.
Key facts
- Half acre
- Cathedral ceilings
- Smart home
Tags
Property features AI
Finance
- Financial info: Pets allowed
- HOA & community: No association fee
Exterior
- Parking: Attached 2-car garage; Driveway parking; Paved access; Garage door opener
- Security: Smoke detectors
- Utilities: Cable available; Septic tank; Well water
- Home design: Single-story; Entry at level 1; East-facing
- Construction: Block, concrete and stucco construction; Shingle roof
- Exterior features: Fence; Room for a pool; Lanai (open, screened); Porch
Interior
- Kitchen: Dishwasher; Freezer; Microwave; Range; Refrigerator; Water softener
- Bedrooms: Includes a screened porch and a great room as room types
- Flooring: Carpet; Tile
- Bathrooms: 2 full bathrooms
- Heating & cooling: Central heating (electric); Central air conditioning (electric); Ceiling fans
- Interior features: Breakfast bar; Cathedral ceilings; Kitchen island; Open living/dining area; Tub with shower; Cable TV available; Split bedroom layout; Double-hung windows; Unfurnished
- Laundry & utility: Washer hookup inside; Dryer hookup inside
Neighborhood map
What this means for you Summary
Snapshot
- This is a 3-bed/2.0-bath single-family listed at $275k.
Deal economics
- At list price, monthly cash flow is $-94 ($-1k/yr) — negative.
- To cash-flow at today's rent, offer at most $258k (6.1% below list).
- To meet the 1% rule (rent ≥ 1% of price), the offer needs to be $205k (25.3% below list).
- Recommended offer: $205k (25.3% below list) — sets the bar for 1% rule.
- Cap rate 5.9% vs local median 4.7% in Lehigh Acres — meaningfully above typical; check what's discounted (condition, days-on-market, listing class) to confirm the premium yield is real.
Location & tenants
- Location reads 59/100 on livability (#826 in FL) — a working-class tenant base; expect higher turnover. Strengths: cost of living A+, housing A+; Watch: crime C-, employment D+, schools D-.
- Lee (suburban): math 47% / reading 50% proficiency, ranked #42 of 73 in FL (top 58%) — families likely to look elsewhere, expect single-tenant / working-renter base with shorter leases.
- Market conditions: Rents rising fast (+5.3%/yr); 1611 active listings in the ZIP; 9 comparable units currently listed for rent nearby; rentals leasing fast (median 11d on market — plan ~1-2 weeks tenant-placement turnaround); 15,411 units permitted in Lee County in 2024 (4,686 in 5+ unit buildings).
- This rent runs 33% of the median local income ($74k/yr) — at the standard rent-burdened threshold; future hikes will face affordability resistance.
Forward outlook
- Local home prices are declining (-3.0%/yr); year-one equity from $2k of loan paydown is wiped out by about $8k of value loss. Plan a longer hold.
- Lee County population projected at +44% by 2050 — long-run rental-demand tailwind backs the buy-and-hold thesis.
Negotiation context
- It's been on market 22 days — a 2% lower offer ($271k) is reasonable based on typical stale-listing flexibility.
- 2 sale attempts since 11y ago with the ask held roughly flat each time — persistent listings suggest the price (not the market) is what's stuck; bring a comps-based counter.
- Current owner paid $126k; list at $275k implies a 117% gain — meaningful room to come down on a strong offer.
Risks & watch-outs
- Climate carrying-cost: severe wind risk, 99% chance of damaging wind over 30y; extreme-heat days projected 7→26/yr by 2055 (HVAC capex compounding) — expect insurance premiums to compound above CPI over the hold.
Questions for the listing agent
- What do current leases actually rent for vs. the listed asking? Can we see a recent rent roll and the last 12 months of T-12 income?
- Is there a deadline driving the sale (1031 exchange, divorce, estate, relocation)? That informs how much negotiation room exists.
- Schools are D-rated, which usually means shorter tenancies and higher turnover. Who's the typical renter profile here, and what's been the actual vacancy rate?
- The area grade is low — what's the realistic commute time and amenity access for the typical tenant pool here? Any planned neighborhood developments (good or bad) we should know about?
- What's the average days-on-market for RENTAL listings here right now (not sales)? A rising rental-DOM trend means longer vacancies and softer asking-rent achievability than the comps imply.
- What's the recent tenant-quality profile in this submarket — average credit score on applications, eviction rate, late-payment / NSF rate, and stable-employment percentage? A property-management company in the area should have these aggregated.
- How much new for-sale + rental construction is in the pipeline within 1–3 miles? Heavy new supply typically softens prices + rents 12–24 months out; constrained supply supports both.
Investment metrics
- 1% rule
- 0.75% ✗
- Cap rate
- 5.88%
- Cash-on-cash
- -1.47%
- DSCR
- 0.93
- GRM
- 11.2
CMA / ARV
- ARV (on-the-fly)
- $251,658
- Comps found
- 1
Show comp detail 1 sale within ~0.75 mi
| Address | Dist | Beds/Ba | Sqft | Sold | Price | $/sf | Match |
|---|---|---|---|---|---|---|---|
| 3102 E 12th St | 0.61mi | 3/2.0 | 1,288 (+1%) | 7mo | $255,000 | $198 | 63 |
Match score weights: distance 35% · size 25% · config 20% · recency 20%. Top-matched comps best support the ARV.
Projected returns pro-forma
-3.0% appreciation · 5.33% rent growth · sell at horizon
- IRR
- -16.4%
- Equity multiple
- 0.41×
- Total profit
- $-45,716
- Equity at exit
- $41,003
- IRR
- -4.8%
- Equity multiple
- 0.65×
- Total profit
- $-26,655
- Equity at exit
- $23,777
Cash invested: $77,000 (down + closing). Projections, not guarantees.
Landlord ↔ Tenant lean methodology
- Overall (STATE)
- 87 Strongly Landlord-Friendly
- State Florida
- 87 Strongly Landlord-Friendly · R+3
- County
- — inherits STATE
- City
- — inherits STATE
ZIP-level market 33972
- Home prices YoY
- -13.6%
- Rents YoY
- 5.3%
- Active inventory
- 1611
- Price-to-rent
- 11.2×
Monthly cashflow live
- Estimated rent
- $2,055 high interval (Pro) →
- Mortgage (P&I)
- −$1,442
- Tax from tax record
- −$161 /mo · $1,927/yr
- Insurance
- −$115
- HOA
- −$0
- Vacancy / Maint / Mgmt
- −$431
- Net cashflow
- $-94
Break-even live
UW: 25.0% down · 7.5% · 30yr · 1.5% tax · 5.0% vac · 8.0% maint · 8.0% mgmt
Financing live
Cash to close
- Down payment
- $68,750
- Closing costs
- $8,250
- Reserves months
- —
- Total cash needed
- —
Loan-product check · same deal, 3 products live
Conventional
25% down · 7.5% · 30yr
- Down + closing
- —
- Monthly P&I
- —
- Monthly cashflow
- —
- DSCR
- —
- Eligible?
- —
Personal DTI + credit; lowest rate.
DSCR
20% down · 8.5% · 30yr
- Down + closing
- —
- Monthly P&I
- —
- Monthly cashflow
- —
- DSCR
- —
- Eligible?
- —
No personal income docs; deal must DSCR.
Hard money
10% down · 12.0% · 12mo
- Down + closing
- —
- Monthly P&I
- —
- Monthly cashflow
- —
- DSCR
- —
- Eligible?
- —
Short-term bridge; refi at stabilization.
Rent comps 9 comps
| Address | Beds | Baths | Sqft | Rent | $/sqft | DOM | Units | Dist |
|---|---|---|---|---|---|---|---|---|
| 1224 Hamilton Ave Lehigh Acres, FL | 3.0 | 2.0 | 1347 | $1,595 | $1.18 | 16d | 1 | 0.51mi |
| 4103 13th St SW Lehigh Acres, FL | 2.0 | 1.0 | 900 | $1,550 | $1.72 | 11d | 1 | 0.52mi |
| 1108 Truman Ave Lehigh Acres, FL | 2.0 | 1.0 | 1512 | $1,650 | $1.09 | 3d | 1 | 0.64mi |
| 913 Canton Ave Lehigh Acres, FL | 3.0 | 2.0 | 1180 | $1,600 | $1.36 | 21d | 1 | 1.11mi |
| 821 Moore Ave Lehigh Acres, FL | 4.0 | 3.0 | 1822 | $3,200 | $1.76 | 10d | 1 | 1.28mi |
| 819 Moore Ave Lehigh Acres, FL | 4.0 | 3.0 | 1822 | $3,200 | $1.76 | 1d | 1 | 1.30mi |
| 2701 E 18th St Lehigh Acres, FL | 4.0 | 2.0 | 1577 | $2,000 | $1.27 | 23d | 1 | 1.33mi |
| 807 Monroe Dr Lehigh Acres, FL | 3.0 | 2.0 | 965 | $1,750 | $1.81 | 3d | 1 | 1.38mi |
| 1943 E 12th St Lehigh Acres, FL | 3.0 | 2.0 | 1600 | $1,850 | $1.16 | 23d | 1 | 1.42mi |
Listing history 13 events
-
2026-06-18days on market $275,000 Active 22 DOM
-
2026-06-17days on market $275,000 Active 21 DOM
-
2026-06-16days on market $275,000 Active 20 DOM
-
2026-06-15days on market $275,000 Active 19 DOM
-
2026-06-13days on market $275,000 Active 17 DOM
-
2026-06-10days on market $275,000 Active 14 DOM
-
2026-06-09days on market $275,000 Active 13 DOM
-
2026-06-08days on market $275,000 Active 12 DOM
-
2026-06-07days on market $275,000 Active 11 DOM
-
2026-06-03days on market $275,000 Active 7 DOM
-
2026-06-02days on market $275,000 Active 6 DOM
-
2026-06-01days on market $275,000 Active 5 DOM
-
2026-05-31days on market $275,000 Active 4 DOM
ⓘ Source: listings_history table (triggers on properties + properties_extension) + one-shot
backfill from property_details.listing_events for pre-trigger history.
Tax reassessment forecast FL · Resets to sale price
- Current annual tax
- $1,927 · $161/mo
- Projected year-2 tax
- $2,282 · $190/mo
- Expected delta
- +$356/yr (+$30/mo · 18.5%)
ⓘ Screening estimate from a state-policy table — verify with the county assessor before closing.
Climate risk First Street
- Flood 1/10 Low FEMA zone X (shaded) · 0% chance over 30 yrs
- Wildfire 3/10 Moderate
- Heat 9/10 Extreme 7 d/yr ≥108°F today · 26 d/yr by 30 yrs out
- Wind 10/10 Extreme 99% chance of damaging wind over 30 yrs
- Air quality 2/10 Low 2 unhealthy d/yr today · 2 by 30 yrs out
Nearby sold comps map
Loading sold comps map…
Walkable amenities ~0.75 mi
Loading nearby amenities…
Taxation est. · year 1
- Rental income
- $24,654
- − Mortgage interest
- −$15,404
- − Property taxes
- −$1,927
- − Insurance
- −$1,375
- − Repairs & maintenance
- −$1,972
- − Management
- −$1,972
- − Depreciation
- −$8,000
- Taxable loss
- −$5,997
- Est. tax savings @ 24.0%
- +$1,439
- After-tax cash flow
- $309/yr
For passive investors: Depreciation is non-cash, so a rental often shows a tax loss while cash-flowing — sheltering income. Rental losses are passive: they offset passive income freely, and up to $25,000/yr can offset ordinary (W-2) income if you actively participate and your MAGI is under $100k (phasing out to $0 by $150k); unused losses carry forward. On sale, claimed depreciation is recaptured at up to 25%, and gains may owe capital-gains tax (a 1031 exchange can defer both). Figures are a year-1 estimate at your 24.0% rate — not tax advice; consult a CPA.
Schools (NCES district)
- District
- Lee
- NCES district ID
- 1201080
- Math proficiency
- 47% ▼ -11.00%
- Reading proficiency
- 50% ▼ -4.00%
- Median HH income
- $49,518
- Composite
- 41.49/100
- National rank
- #3458
- State rank
- #42 of 73 in FL
Livability — Lehigh Acres
- Score
- 59/100
- State rank
- #826
- US rank
- #20055
Category grades
Schools grade is shown separately in the Schools card above.
Census & demographics
- Census place
- Lehigh Acres, FL
- County
- Lee County · 788,662 people
- City population
- 130,638
- Metro
- Cape Coral-Fort Myers, FL
- Population (ZIP)
- 17,285
- Household income
- $73,819
- Rent vs Own
- Severe rent burden
- 190.0
Population outlook (Lee County) Hauer SSP2
- Today (2025)
- 871,946 people
- By 2030
- 955,468 · +9.6%
- By 2040
- 1,113,587 · +27.7%
- By 2050
- 1,256,891 · +44.1%
- By 2075
- 1,560,270 · +78.9%
- By 2100
- 1,726,848 · +98.0%
Race, ethnicity, and origin ACS 2023
- Neighborhood character
- Diverse neighborhood (Simpson 0.65)
- Race & ethnicity
- White 44% Hispanic / Latino 38% Two or more races 21% Black 13%
- Hispanic origin (detail)
- Mexican 8% Puerto Rican 7% Cuban 18%
- Common ancestry
- Hispanic 6% Italian 2% Romanian 2%
- Foreign-born
- 27% · Canada, Guatemala
- Languages at home
- 61% English-only · Spanish 32% French/Haitian/Cajun 4% Other Indo-European 1%
Political lean MEDSL · Lee
- 2024 margin
- Strong R (+28.4) · D 35.5% · R 63.9%
- 2008→2024 swing
- -18.0pp toward R · 2008: -10.4pp · 2024: -28.4pp
- All cycles
- 2024: R+28.4 2020: R+19.2 2016: R+20.4 2012: R+16.6 2008: R+10.4
Not yet ingested
- Civics
- —
Market trends
- HPI YoY
- ▼ -53.97%
- Current HPI
- 343.484
- Rent YoY
- ▲ 5.33%
- Metro
- Cape Coral-Fort Myers, FL
- State GDP YoY
- ▲ 3.28%
- F500 in state
- 36
Industry mix (Fortune 500 HQ in FL)
| Industry | F500 HQs | Revenue |
|---|---|---|
| Industrial Technology | 2 | $29B |
|
||
| Insurance | 2 | $17B |
|
||
| Retail | 1 | $60B |
|
||
| Technology Distribution | 1 | $58B |
|
||
| Homebuilding | 1 | $35B |
|
||
| Technology Manufacturing | 1 | $35B |
|
||
Price history
+80.9% since first listed13 events — show timeline
- 2026-05-27 Listed $275,000 FORTMLS
- 2016-05-19 Sold (Public Records) $126,500 Public Records
- 2016-05-17 Price Changed $124,900 FORTMLS
- 2016-05-16 Sold (MLS) $126,500 FORTMLS
- 2016-05-15 Price Changed $126,500 FORTMLS
- 2016-03-31 Pending — FORTMLS
- 2016-03-04 Price Changed $124,900 FORTMLS
- 2016-02-01 Price Changed $127,400 FORTMLS
- 2015-12-11 Price Changed $129,900 FORTMLS
- 2015-11-24 Listed $134,900 FORTMLS
- 2005-01-03 Sold (Public Records) $152,000 Public Records
- 2004-12-15 Price Changed $154,900 FORTMLS
- 2004-12-15 Sold (MLS) $152,000 FORTMLS
Property tax history
+4.1%/yrLatest (2025): $1,927 · +4.6% YoY. Source: county tax records.
Cash-flow waterfall
monthlySold comps — $/sqft
last 12 mo · ≤1 miLoading sold comps…