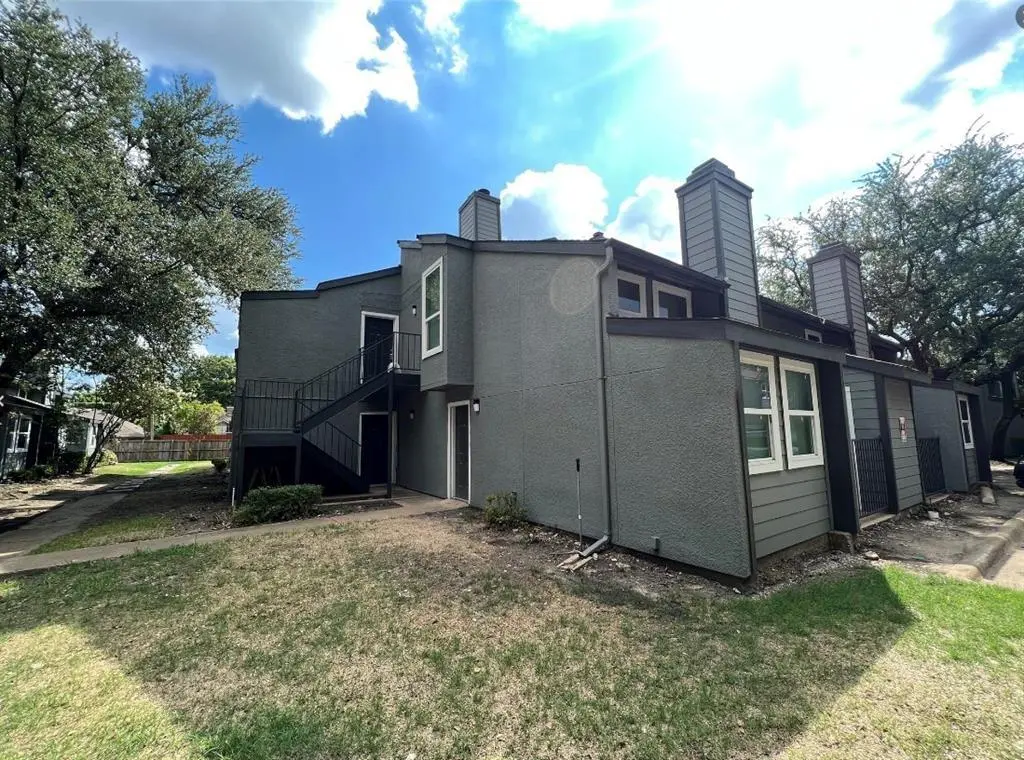
9696 Walnut St #608 · Dallas, TX
Flood risk 1/10 · Minimal
- FEMA flood zone
- X (unshaded)
- Chance of flooding over 30 yrs
- 0.0%
- Est. flood insurance / yr
- $507 – $1,088
Fire risk 1/10 · Minimal
- Est. fire insurance / yr
- $1,222 – $2,270
Heat risk 7/10 · Major
- Hot days now (above 109°F)
- 7 days/yr
- Hot days in 30 yrs
- 23 days/yr
Wind risk 6/10 · Moderate
- Chance of severe wind over 30 yrs
- 27.0%
Air-quality risk 3/10 · Minor
- Unhealthy air days now
- 3 days/yr
- Unhealthy air days in 30 yrs
- 3 days/yr
Risk factors via First Street. Map © Google.
Why this score? — see what drove the D+ grade
The composite is a weighted blend of 9 inputs, each scored 0–100. Each bar is that input's sub-score; the figure is the points it added to the 100-point composite (weight × sub-score).
- Cash flow +12.9/30.0
- 1% rule +10.0/10.0
- ARV discount +7.1/15.0
- Livability +4.0/5.0
- DSCR +3.8/10.0
- Schools +3.7/10.0
- Condition / age +2.5/5.0
- Rent growth +1.2/5.0
- Appreciation +0.0/10.0
$75,000
🖨 Deal sheet 📄 Offer letter ✓ Due diligence
Listing remarks MLS
Discover this delightful two-story unit ideally situated near I-635 in Dallas. With its own private stairway entrance, this condo offers a spacious living area adorned with a cozy fireplace and access to a private balcony—perfect for relaxing or entertaining. The oversized bedroom boasts soaring vaulted ceilings and ample closet space, providing both comfort and functionality. Currently tenant-occupied through June 30, 2026, at a rental rate of $950 per month, this property offers immediate income potential. The HOA is actively enhancing the community with major renovations to building exteriors and common areas already underway. Important Buyer Note: This complex is fully tenant-occupied and non-warrantable. Buyers using financing must confirm lender approval under these conditions. Cash offers are strongly preferred. Don't miss this fantastic investment opportunity in a growing area!
Key facts
- Oversized bedroom
- Spacious living area
- Balcony
Tags
Neighborhood map
What this means for you Summary
Snapshot
- This is a 2-bed/1.5-bath condo listed at $75k.
Deal economics
- At list price, monthly cash flow is $-6 ($-72/yr) — negative.
- To cash-flow at today's rent, offer at most $74k (1.4% below list).
- Meets the 1% rule at list price ($1k rent vs $75k).
- Recommended offer: $66k (12.0% below list) — sets the bar for market timing.
- Cap rate 6.2% vs local median 2.3% in Dallas — top-decile yield for the area; either an underpriced asset or a hidden risk that comps aren't pricing in. Stress-test before assuming the spread holds.
Location & tenants
- Location reads 81/100 on livability (#24 in TX, #1,380 nationally) — a professional / high-income tenant draw. Strengths: amenities A+, commute A+, housing A+; Watch: schools C-, crime F.
- Richardson ISD (urban): math 40% / reading 44% proficiency, ranked #316 of 826 in TX (top 38%) — families likely to look elsewhere, expect single-tenant / working-renter base with shorter leases.
- Market conditions: Rents falling (-5.3%/yr); 271 active listings in the ZIP; 40 comparable units currently listed for rent nearby; rentals at typical pace (median 18d on market — plan ~3-4 weeks tenant-placement turnaround); 12,577 units permitted in Dallas County in 2024 (6,829 in 5+ unit buildings).
Forward outlook
- Local home prices are declining (-3.0%/yr); year-one equity from $519 of loan paydown is wiped out by about $2k of value loss. Plan a longer hold.
- Dallas County population projected at +35% by 2050 — long-run rental-demand tailwind backs the buy-and-hold thesis.
Negotiation context
- It's been on market 457 days — a 12% lower offer ($66k) is reasonable based on typical stale-listing flexibility.
- 4 sale attempts since 4y ago with the ask held roughly flat each time — persistent listings suggest the price (not the market) is what's stuck; bring a comps-based counter.
Risks & watch-outs
- Watch-outs: property tax is 2.5% of price; HOA is 32% of rent.
- Climate carrying-cost: major wind risk, 27% chance of damaging wind over 30y; extreme-heat days projected 7→23/yr by 2055 (HVAC capex compounding) — expect insurance premiums to compound above CPI over the hold.
Questions for the listing agent
- What do current leases actually rent for vs. the listed asking? Can we see a recent rent roll and the last 12 months of T-12 income?
- It's been on market 457 days. Have you received any prior offers? Is the seller open to a 12% concession, seller financing, or rate buy-down credit?
- Property tax is high relative to price — has the assessment been appealed recently, and will the sale trigger a re-assessment?
- What does the HOA fee cover, when was the last increase, and are there any pending special assessments or reserve-fund shortfalls?
- Any open or pending special assessments — roof, HVAC, plumbing, elevator, façade? What's the per-unit balance and payoff schedule, and is the seller paying it off at close or rolling it to the buyer?
- Why hasn't it sold? Are there any deal-killer items the seller is aware of (foundation, flood, title, zoning, code violations)?
- Is there a deadline driving the sale (1031 exchange, divorce, estate, relocation)? That informs how much negotiation room exists.
- Crime grade is F in this area — have there been break-ins, vandalism, or insurance claims at this property in the last 3 years? What carrier currently insures it and at what premium?
- The area grade is low — what's the realistic commute time and amenity access for the typical tenant pool here? Any planned neighborhood developments (good or bad) we should know about?
- What's the average days-on-market for RENTAL listings here right now (not sales)? A rising rental-DOM trend means longer vacancies and softer asking-rent achievability than the comps imply.
- What's the recent tenant-quality profile in this submarket — average credit score on applications, eviction rate, late-payment / NSF rate, and stable-employment percentage? A property-management company in the area should have these aggregated.
- How much new apartment / multifamily construction is in the pipeline within 1–3 miles? Heavy new supply (>2% of stock underway) typically softens rents 12–24 months out; light construction supports rent growth.
Investment metrics
- 1% rule
- 1.62% ✓
- Cap rate
- 6.20%
- Cash-on-cash
- -0.34%
- DSCR
- 0.98
- GRM
- 5.1
CMA / ARV
- ARV (median comp)
- $74,285
- List price
- $75,000
- Delta
- 0.96%
- Verdict
- FAIR
- Comps
- 20 within 1.0 mi
Projected returns pro-forma
-3.0% appreciation · 0.0% rent growth · sell at horizon
- IRR
- -23.0%
- Equity multiple
- 0.25×
- Total profit
- $-15,804
- Equity at exit
- $11,183
- IRR
- -50.3%
- Equity multiple
- -0.28×
- Total profit
- $-26,832
- Equity at exit
- $6,485
Cash invested: $21,000 (down + closing). Projections, not guarantees.
Landlord ↔ Tenant lean methodology
- Overall (STATE)
- 87 Strongly Landlord-Friendly
- State Texas
- 87 Strongly Landlord-Friendly · R+5
- County
- — inherits STATE
- City
- — inherits STATE
ZIP-level market 75243
- Rents YoY
- -5.3%
- Active inventory
- 271
- Price-to-rent
- 5.1×
Monthly cashflow live
- Estimated rent
- $1,216 high interval (Pro) →
- Mortgage (P&I)
- −$393
- Tax from tax record
- −$158 /mo · $1,900/yr
- Insurance
- −$31
- HOA
- −$384
- Vacancy / Maint / Mgmt
- −$255
- Net cashflow
- $-6
Break-even live
UW: 25.0% down · 7.5% · 30yr · 1.5% tax · 5.0% vac · 8.0% maint · 8.0% mgmt
Financing live
Cash to close
- Down payment
- $18,750
- Closing costs
- $2,250
- Reserves months
- —
- Total cash needed
- —
Loan-product check · same deal, 3 products live
Conventional
25% down · 7.5% · 30yr
- Down + closing
- —
- Monthly P&I
- —
- Monthly cashflow
- —
- DSCR
- —
- Eligible?
- —
Personal DTI + credit; lowest rate.
DSCR
20% down · 8.5% · 30yr
- Down + closing
- —
- Monthly P&I
- —
- Monthly cashflow
- —
- DSCR
- —
- Eligible?
- —
No personal income docs; deal must DSCR.
Hard money
10% down · 12.0% · 12mo
- Down + closing
- —
- Monthly P&I
- —
- Monthly cashflow
- —
- DSCR
- —
- Eligible?
- —
Short-term bridge; refi at stabilization.
Rent comps 40 comps
| Address | Beds | Baths | Sqft | Rent | $/sqft | DOM | Units | Dist |
|---|---|---|---|---|---|---|---|---|
| 9696 Walnut St Dallas, TX | 1.0–2.0 | 1.0–2.0 | 866 | $1,150 | $1.33 | 13d | 5 | 0.06mi |
| 9696 Walnut St Dallas, TX | 1.0–2.0 | 1.0–2.0 | 866 | $1,150 | $1.33 | 3d | 5 | 0.06mi |
| 9696 Walnut St Dallas, TX | 1.0–2.0 | 1.0–2.0 | 866 | $1,325 | $1.53 | 24d | 7 | 0.06mi |
| 9621 Walnut St Unit 6106 Dallas, TX | 1.0 | 1.0 | 876 | $1,250 | $1.43 | 43d | 1 | 0.13mi |
| 9601 Walnut St Dallas, TX | 1.0 | 1.0 | 759 | $1,075 | $1.42 | 43d | 2 | 0.15mi |
| 9805 Walnut St Dallas, TX | 1.0–2.0 | 1.0–2.0 | 758 | $1,500 | $1.98 | 17d | 2 | 0.24mi |
| 12920 Audelia Rd Dallas, TX | 1.0–2.0 | 1.0–2.0 | 888 | $1,680 | $1.89 | 2d | 25 | 0.29mi |
| 9801 Walnut St #214 Dallas, TX | 1.0 | 1.0 | 774 | $1,300 | $1.68 | 18d | 1 | 0.34mi |
| 9944 Walnut St Dallas, TX | 1.0–2.0 | 1.0–2.0 | 775 | $1,380 | $1.78 | 2d | 40 | 0.38mi |
| 9825 Walnut St Dallas, TX | 1.0 | 1.0 | 551 | $1,000 | $1.81 | 43d | 1 | 0.44mi |
| 9825 Walnut St #206 Dallas, TX | 2.0 | 2.0 | 1031 | $1,250 | $1.21 | 43d | 1 | 0.44mi |
| 9825 Walnut St Unit M103 Dallas, TX | 1.0 | 1.0 | 551 | $1,000 | $1.81 | 1d | 1 | 0.44mi |
| 9831 Walnut St #206 Dallas, TX | 2.0 | 2.0 | 1031 | $1,500 | $1.45 | 43d | 1 | 0.47mi |
| 9831 Walnut St #209 Dallas, TX | 2.0 | 2.0 | 1031 | $1,600 | $1.55 | 43d | 1 | 0.47mi |
| 9833 Walnut St Dallas, TX | 2.0 | 2.0 | 894 | $1,099 | $1.23 | 2d | 1 | 0.50mi |
| 9815 Walnut St #212 Dallas, TX | 2.0 | 2.0 | 894 | $1,450 | $1.62 | 24d | 1 | 0.52mi |
| 9815 Walnut St #102 Dallas, TX | 1.0 | 1.0 | 662 | $1,100 | $1.66 | 1d | 1 | 0.52mi |
| 9835 Walnut St #102 Dallas, TX | 1.0 | 1.0 | 662 | $895 | $1.35 | 43d | 1 | 0.52mi |
| 9835 Walnut St #202 Dallas, TX | 2.0 | 1.0 | 774 | $1,150 | $1.49 | 24d | 1 | 0.52mi |
| 9855 Shadow Way Dallas, TX | 2.0 | 1.0–2.0 | 760 | $1,395 | $1.83 | 3d | 20 | 0.54mi |
| 9839 Walnut St Unit 210 Dallas, TX | 2.0 | 2.0 | 1055 | $1,600 | $1.52 | 43d | 1 | 0.54mi |
| 9837 Walnut St Dallas, TX | 2.0 | 1.0–2.0 | 919 | $1,248 | $1.36 | 7d | 2 | 0.55mi |
| 9837 Walnut St Unit 103 Dallas, TX | 2.0 | 1.0 | 808 | $1,045 | $1.29 | 7d | 1 | 0.55mi |
| 9813 Walnut St #104 Dallas, TX | 1.0 | 1.0 | 551 | $750 | $1.36 | 43d | 1 | 0.55mi |
| 9813 Walnut St Unit 303 Dallas, TX | 1.0 | 1.0 | 535 | $695 | $1.30 | 24d | 1 | 0.55mi |
| 9821 Walnut St Unit K203 Dallas, TX | 2.0 | 2.0 | 894 | $1,200 | $1.34 | 43d | 1 | 0.56mi |
| 10000 Walnut St Dallas, TX | 2.0 | 1.0–2.0 | 717 | $1,426 | $1.99 | 2d | 23 | 0.65mi |
| 12121 Audelia Rd Dallas, TX | 1.0–2.0 | 1.0–2.0 | 862 | $1,450 | $1.68 | 1d | 41 | 0.66mi |
| 12111 Audelia Rd Dallas, TX | 1.0–2.0 | 1.0–2.0 | 862 | $1,300 | $1.51 | 1d | 42 | 0.67mi |
| 12484 Abrams Rd #1724 Dallas, TX | 2.0 | 2.0 | 1006 | $1,500 | $1.49 | 43d | 1 | 0.67mi |
| 12482 Abrams Rd #1327 Dallas, TX | 2.0 | 2.0 | 959 | $1,655 | $1.73 | 3d | 1 | 0.70mi |
| 540 Buckingham Rd Richardson, TX | 1.0–3.0 | 1.0–2.0 | 964 | $1,675 | $1.74 | 2d | 34 | 0.72mi |
| 11991 Audelia Rd Dallas, TX | 1.0–2.0 | 1.0–2.0 | 827 | $1,315 | $1.59 | 1d | 36 | 0.72mi |
| 12480 Abrams Rd Ste 921 Dallas, TX | 1.0 | 1.0 | 700 | $1,400 | $2.00 | 24d | 1 | 0.73mi |
| 12480 Abrams Rd #705 Dallas, TX | 1.0 | 1.0 | 729 | $1,150 | $1.58 | 10d | 1 | 0.74mi |
| 12480 Abrams Rd #124 Dallas, TX | 1.0 | 1.0 | 775 | $1,150 | $1.48 | 43d | 1 | 0.74mi |
| 12480 Abrams Rd Dallas, TX | 1.0 | 1.0 | 756 | $1,100 | $1.45 | 2d | 3 | 0.74mi |
| 12480 Abrams Rd Dallas, TX | 1.0 | 1.0 | 756 | $1,100 | $1.46 | 18d | 2 | 0.74mi |
| 12480 Abrams Rd Dallas, TX | 1.0 | 1.0 | 756 | $1,100 | $1.46 | 7d | 3 | 0.74mi |
| 530 Buckingham Rd Richardson, TX | 1.0–3.0 | 1.0–2.0 | 995 | $1,872 | $1.88 | 2d | 24 | 0.76mi |
HOA detail condo
- Monthly dues
- $384 · $4,608/yr
- Assessments
- None detected in remarks — confirm with the listing agent.
Listing history 27 events
-
2026-06-18days on market $75,000 Active 457 DOM
-
2026-06-17days on market $75,000 Active 456 DOM
-
2026-06-16days on market $75,000 Active 455 DOM
-
2026-06-15days on market $75,000 Active 454 DOM
-
2026-06-13days on market $75,000 Active 452 DOM
-
2026-06-09days on market $75,000 Active 448 DOM
-
2026-06-08days on market $75,000 Active 447 DOM
-
2026-06-07days on market $75,000 Active 446 DOM
-
2026-06-04days on market $75,000 Active 443 DOM
-
2026-06-03days on market $75,000 Active 442 DOM
-
2026-06-02days on market $75,000 Active 441 DOM
-
2026-06-01days on market $75,000 Active 440 DOM
-
2026-05-31days on market $75,000 Active 439 DOM
-
2025-03-18$75,000 Active 907-char remark
Show marketing remark (907 chars)
Discover this delightful two-story unit ideally situated near I-635 in Dallas. With its own private stairway entrance, this condo offers a spacious living area adorned with a cozy fireplace and access to a private balcony—perfect for relaxing or entertaining. The oversized bedroom boasts soaring vaulted ceilings and ample closet space, providing both comfort and functionality. Currently tenant-occupied through June 30, 2026, at a rental rate of $950 per month, this property offers immediate income potential. The HOA is actively enhancing the community with major renovations to building exteriors and common areas already underway. Important Buyer Note: This complex is fully tenant-occupied and non-warrantable. Buyers using financing must confirm lender approval under these conditions. Cash offers are strongly preferred. Don't miss this fantastic investment opportunity in a growing area!
-
2024-09-19historical
-
2024-07-10$84,700 Active
-
2024-05-29soldstatus
-
2024-05-28soldstatus Closed
-
2024-05-14status Pending
-
2024-05-02price $65,000
-
2024-01-12price $75,000
-
2023-11-17price $79,000
-
2023-11-16$89,000 Active
-
2023-11-04historical
-
2022-11-04$89,000 Active
-
2018-08-30soldstatus
-
2006-11-07soldstatus $1,500,000
ⓘ Source: listings_history table (triggers on properties + properties_extension) + one-shot
backfill from property_details.listing_events for pre-trigger history.
Tax reassessment forecast TX · Resets to sale price
- Current annual tax
- $1,900 · $158/mo
- Projected year-2 tax
- $1,900 · $158/mo
- Expected delta
- $0/yr ($0/mo · 0.0%)
ⓘ Screening estimate from a state-policy table — verify with the county assessor before closing.
Climate risk First Street
- Flood 1/10 Low FEMA zone X (unshaded) · 0% chance over 30 yrs
- Wildfire 1/10 Low
- Heat 7/10 Severe 7 d/yr ≥109°F today · 23 d/yr by 30 yrs out
- Wind 6/10 Major 27% chance of damaging wind over 30 yrs
- Air quality 3/10 Moderate 3 unhealthy d/yr today · 3 by 30 yrs out
Nearby sold comps map
Loading sold comps map…
Walkable amenities ~0.75 mi
Loading nearby amenities…
Taxation est. · year 1
- Rental income
- $14,597
- − Mortgage interest
- −$4,201
- − Property taxes
- −$1,900
- − Insurance
- −$375
- − Repairs & maintenance
- −$1,168
- − Management
- −$1,168
- − HOA
- −$4,608
- − Depreciation
- −$2,182
- Taxable loss
- −$1,005
- Est. tax savings @ 24.0%
- +$241
- After-tax cash flow
- $170/yr
For passive investors: Depreciation is non-cash, so a rental often shows a tax loss while cash-flowing — sheltering income. Rental losses are passive: they offset passive income freely, and up to $25,000/yr can offset ordinary (W-2) income if you actively participate and your MAGI is under $100k (phasing out to $0 by $150k); unused losses carry forward. On sale, claimed depreciation is recaptured at up to 25%, and gains may owe capital-gains tax (a 1031 exchange can defer both). Figures are a year-1 estimate at your 24.0% rate — not tax advice; consult a CPA.
Schools (NCES district)
- District
- Richardson ISD
- NCES district ID
- 4837020
- Math proficiency
- 40% ▼ -14.00%
- Reading proficiency
- 44% ▼ -6.00%
- Median HH income
- $54,609
- Composite
- 36.58/100
- National rank
- #4633
- State rank
- #316 of 826 in TX
Livability — Dallas
- Score
- 81/100
- State rank
- #24
- US rank
- #1380
Category grades
Schools grade is shown separately in the Schools card above.
Census & demographics
- Census place
- Dallas, TX
- County
- Dallas County · 2,612,404 people
- City population
- 1,168,437
- Metro
- Dallas-Fort Worth-Arlington, TX
- Population (ZIP)
- 63,481
- Household income
- $53,618
- Rent vs Own
- Severe rent burden
- 5970.0
Population outlook (Dallas County) Hauer SSP2
- Today (2025)
- 2,979,839 people
- By 2030
- 3,191,823 · +7.1%
- By 2040
- 3,619,611 · +21.5%
- By 2050
- 4,026,915 · +35.1%
- By 2075
- 4,957,073 · +66.4%
- By 2100
- 5,508,725 · +84.9%
Race, ethnicity, and origin ACS 2023
- Neighborhood character
- Highly diverse neighborhood (Simpson 0.71)
- Race & ethnicity
- Black 43% Hispanic / Latino 23% White 22% Two or more races 10% Asian 7%
- Hispanic origin (detail)
- Mexican 15%
- Common ancestry
- Swiss 1% Slovak 1% Lithuanian 1%
- Foreign-born
- 34% · Canada, Vietnam, South Korea
- Languages at home
- 56% English-only · Spanish 21% Other Indo-European 3% French/Haitian/Cajun 2%
Political lean MEDSL · Dallas
- 2024 margin
- Strong D (+22.2) · D 60.2% · R 38.0% · Other 1.8%
- 2008→2024 swing
- +6.9pp toward D · 2008: 15.3pp · 2024: 22.2pp
- All cycles
- 2024: D+22.2 2020: D+31.6 2016: D+26.2 2012: D+15.4 2008: D+15.3
Not yet ingested
- Civics
- —
Market trends
- HPI YoY
- ▼ -203.08%
- Current HPI
- 317.5287
- Rent YoY
- ▼ -5.31%
- Metro
- Dallas-Fort Worth-Arlington, TX
- State GDP YoY
- ▲ 3.95%
- F500 in state
- 110
Industry mix (Fortune 500 HQ in TX)
| Industry | F500 HQs | Revenue |
|---|---|---|
| Energy | 16 | $1,198B |
|
||
| Technology | 5 | $198B |
|
||
| Engineering / Construction | 4 | $72B |
|
||
| Energy Services | 3 | $60B |
|
||
| Utilities | 3 | $41B |
|
||
| Healthcare | 2 | $330B |
|
||
Price history
-95.0% since first listed14 events — show timeline
- 2025-03-18 Listed $75,000 NTREIS
- 2024-09-19 Listing Removed — NTREIS
- 2024-07-10 Listed $84,700 NTREIS
- 2024-05-29 Sold (Public Records) — Public Records
- 2024-05-28 Sold (MLS) — NTREIS
- 2024-05-14 Pending — NTREIS
- 2024-05-02 Price Changed $65,000 NTREIS
- 2024-01-12 Price Changed $75,000 NTREIS
- 2023-11-17 Price Changed $79,000 NTREIS
- 2023-11-16 Listed $89,000 NTREIS
- 2023-11-04 Listing Removed — NTREIS
- 2022-11-04 Listed $89,000 NTREIS
- 2018-08-30 Sold (Public Records) — Public Records
- 2006-11-07 Sold (Public Records) $1,500,000 Public Records
Property tax history
+4.8%/yrLatest (2025): $1,900 · -10.2% YoY. Source: county tax records.
Cash-flow waterfall
monthlySold comps — $/sqft
last 12 mo · ≤1 miLoading sold comps…