 🏷️ Likely Rental
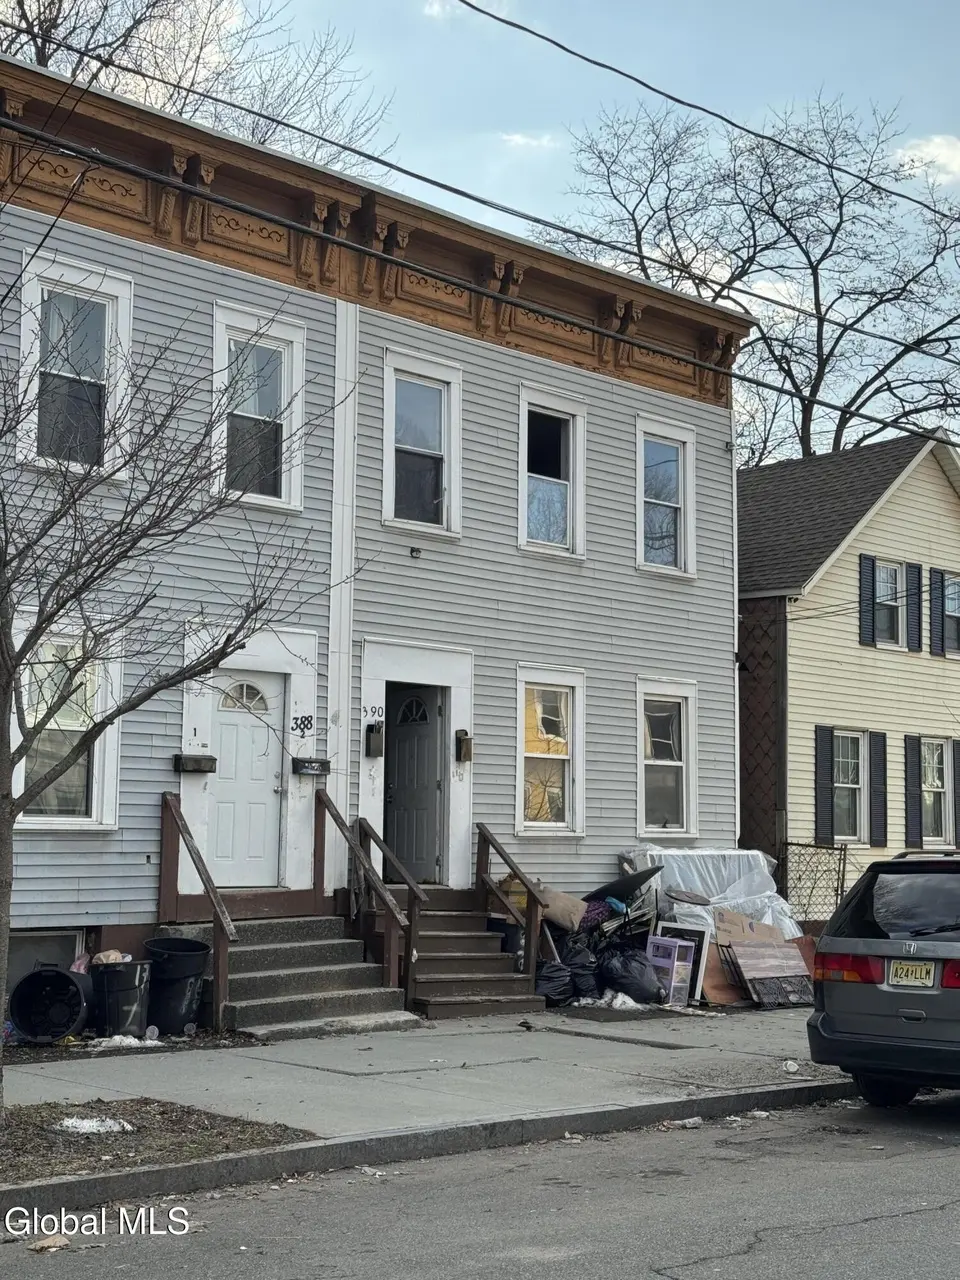
390 2nd St · Albany, NY
Flood risk 1/10 · Minimal
- FEMA flood zone
- X (unshaded)
- Chance of flooding over 30 yrs
- 0.0%
- Est. flood insurance / yr
- $473 – $860
Fire risk 1/10 · Minimal
- Est. fire insurance / yr
- $691 – $1,283
Heat risk 4/10 · Minor
- Hot days now (above 97°F)
- 7 days/yr
- Hot days in 30 yrs
- 16 days/yr
Wind risk 3/10 · Minor
- Chance of severe wind over 30 yrs
- 6.0%
Air-quality risk 1/10 · Minimal
- Unhealthy air days now
- 0 days/yr
- Unhealthy air days in 30 yrs
- 0 days/yr
Risk factors via First Street. Map © Google.
Why this score? — see what drove the B+ grade
The composite is a weighted blend of 9 inputs, each scored 0–100. Each bar is that input's sub-score; the figure is the points it added to the 100-point composite (weight × sub-score).
- Cash flow +30.0/30.0
- ARV discount +15.0/15.0
- 1% rule +10.0/10.0
- DSCR +10.0/10.0
- Livability +4.0/5.0
- Rent growth +3.8/5.0
- Schools +3.2/10.0
- Condition / age +2.5/5.0
- Appreciation +0.0/10.0
$115,000
🖨 Deal sheet (PDF) 📄 Offer letter ✓ Due diligence
Multi-family units
County records classify this as Multi-Family (2-4 Unit). Listing-text estimate: 2 units. confirmed
Listing remarks MLS
Two-family home in Albany! Great investment potential! This property needs some work, but with the right vision, it can be transformed into a strong income-producing asset. Conveniently located near major highways and bus lines, making commuting easy for future tenants. Fix it up, rent it out, and start generating steady cash flow. Don't miss this opportunity to collect rental income from this promising property! Market rents could be 1702.00 each apartment so 3404 per month...40,848 rental income per year.
Key facts
- Bus lines
- Two-family home
- Investment potential
Tags
Neighborhood map
What this means for you Summary
Snapshot
- This is a 2 × 2-bed/1.0-bath units multifamily listed at $115k.
Deal economics
- At list price, monthly cash flow is $2k ($20k/yr) — positive. Per door: $827/mo.
- The deal already cash-flows at list — no discount required.
- Meets the 1% rule at list price ($3k rent vs $115k).
- Recommended offer: $108k (6.0% below list) — sets the bar for market timing.
- Cap rate 23.6% vs local median 5.7% in Albany — top-decile yield for the area; either an underpriced asset or a hidden risk that comps aren't pricing in. Stress-test before assuming the spread holds.
Location & tenants
- Location reads 79/100 on livability (#129 in NY, #2,083 nationally) — a middle-class / working-renter tenant base. Strengths: amenities A+, commute A+, housing A+; Watch: employment C-, crime F.
- Albany City School District (urban): math 37% / reading 40% proficiency, ranked #543 of 590 in NY (top 92%) — families likely to look elsewhere, expect single-tenant / working-renter base with shorter leases; 66% free/reduced lunch — lower-income household profile, screen leases tightly.
- Market conditions: Rents rising fast (+5.4%/yr); 89 active listings in the ZIP; 32 comparable units currently listed for rent nearby; rentals at typical pace (median 25d on market — plan ~3-4 weeks tenant-placement turnaround); lower-income renter base — watch delinquency; 675 units permitted in Albany County in 2024 (451 in 5+ unit buildings).
- At $3,193/mo this rent would consume 92% of the median local household income ($42k/yr) (locally 2035% of renters already pay >50% of income on rent) — very limited rent-growth headroom before tenants either downsize or default.
Forward outlook
- Local home prices are declining (-3.0%/yr); year-one equity from $795 of loan paydown is wiped out by about $3k of value loss. Plan a longer hold.
- Albany County population projected at +9% by 2050 — modest demand growth; plan on rents tracking national, not racing it.
- At projected returns (-3.0% appreciation + 5.4% rent growth), your $32k cash investment doubles in ~2 years — after that, you're playing with house money.
Negotiation context
- It's been on market 87 days — a 6% lower offer ($108k) is reasonable based on typical stale-listing flexibility.
- 7 sale attempts since 30y ago with the ask held roughly flat each time — persistent listings suggest the price (not the market) is what's stuck; bring a comps-based counter.
- Current owner paid $100k; 15% above their basis — modest negotiation headroom, anchor on the comps not their cost.
Risks & watch-outs
- Watch-outs: built in 1900 — expect roof / HVAC / electrical / plumbing capex.
Questions for the listing agent
- It's been on market 87 days. Have you received any prior offers? Is the seller open to a 6% concession, seller financing, or rate buy-down credit?
- Can we see the unit-by-unit rent roll, current vacancy, and any below-market leases? What's the average tenancy length?
- What capital expenditures (roof, boiler, parking lot, exteriors) have been made in the last 5 years, and what's planned in the next 2?
- Built in 1900 — when were the roof, HVAC, electrical panel, plumbing, and water heater last replaced?
- Why hasn't it sold? Are there any deal-killer items the seller is aware of (foundation, flood, title, zoning, code violations)?
- Is there a deadline driving the sale (1031 exchange, divorce, estate, relocation)? That informs how much negotiation room exists.
- Crime grade is F in this area — have there been break-ins, vandalism, or insurance claims at this property in the last 3 years? What carrier currently insures it and at what premium?
- What's the average days-on-market for RENTAL listings here right now (not sales)? A rising rental-DOM trend means longer vacancies and softer asking-rent achievability than the comps imply.
- What's the recent tenant-quality profile in this submarket — average credit score on applications, eviction rate, late-payment / NSF rate, and stable-employment percentage? A property-management company in the area should have these aggregated.
- How much new apartment / multifamily construction is in the pipeline within 1–3 miles? Heavy new supply (>2% of stock underway) typically softens rents 12–24 months out; light construction supports rent growth.
Investment metrics
- 1% rule
- 2.78% ✓
- Cap rate
- 23.55%
- Cash-on-cash
- 61.64%
- DSCR
- 3.74
- GRM
- 3.0
CMA / ARV
- ARV (median comp)
- $199,819
- List price
- $115,000
- Delta
- -42.45%
- Verdict
- UNDERPRICED
- Comps
- 20 within 1.0 mi
Show comp detail 12 sales within ~0.75 mi
| Address | Dist | Beds/Ba | Sqft | Sold | Price | $/sf | Match |
|---|---|---|---|---|---|---|---|
| 376 1st St | 0.10mi | 4/2.0 | 1,680 (-2%) | 10mo | $100,000 | $60 | 81 |
| 97 West St | 0.36mi | 4/2.0 | 1,760 (+2%) | 6mo | $187,000 | $106 | 72 |
| 320 1st St | 0.23mi | 5/3.0 (+1) | 1,638 (-5%) | 10mo | $213,000 | $130 | 66 |
| 478 3rd St | 0.29mi | 4/2.0 | 1,852 (+8%) | 8mo | $119,000 | $64 | 65 |
| 596 Livingston Ave | 0.43mi | 4/2.0 | 1,584 (-8%) | 3mo | $148,000 | $93 | 62 |
| 60 Bradford St | 0.37mi | 3/2.0 (-1) | 1,600 (-7%) | 5mo | $170,000 | $106 | 60 |
| 246 1st St | 0.42mi | 4/2.0 | 1,860 (+8%) | 9mo | $185,000 | $99 | 57 |
| 9 Pennsylvania Ave | 0.41mi | 5/2.0 (+1) | 1,960 (+14%) | 4mo | $225,000 | $115 | 48 |
| 95 3rd St | 0.74mi | 4/2.0 | 1,584 (-8%) | 3mo | $180,000 | $114 | 47 |
| 596 3rd St | 0.62mi | 4/2.0 | 1,920 (+12%) | 4mo | $150,000 | $78 | 46 |
| 178 Spring St | 0.53mi | 3/2.0 (-1) | 1,524 (-11%) | 9mo | $195,000 | $128 | 42 |
| 9 N Manning Blvd | 0.70mi | 5/2.0 (+1) | 1,936 (+13%) | 5mo | $145,000 | $75 | 35 |
Match score weights: distance 35% · size 25% · config 20% · recency 20%. Top-matched comps best support the ARV.
Projected returns pro-forma
-3.0% appreciation · 5.37% rent growth · sell at horizon
- IRR
- 63.3%
- Equity multiple
- 3.94×
- Total profit
- $94,591
- Equity at exit
- $17,147
- IRR
- 68.6%
- Equity multiple
- 8.82×
- Total profit
- $251,962
- Equity at exit
- $9,943
Cash invested: $32,200 (down + closing). Projections, not guarantees.
Landlord ↔ Tenant lean methodology
- Overall (STATE)
- 15 Strongly Tenant-Friendly
- State New York
- 15 Strongly Tenant-Friendly · D+10
- County
- — inherits STATE
- City
- — inherits STATE
ZIP-level market 12206
- Home prices YoY
- -9.9%
- Rents YoY
- 5.4%
- Active inventory
- 89
- Price-to-rent
- 6.0×
Monthly cashflow live
- Estimated rent
- $3,193 high interval (Pro) →
- Mortgage (P&I)
- −$603
- Tax from tax record
- −$218 /mo · $2,611/yr
- Insurance
- −$48
- HOA
- −$0
- Vacancy / Maint / Mgmt
- −$671
- Net cashflow
- $1,654
Break-even live
Sensitivity live
| Price | -10% $1,719 | -5% $1,686 | +0% $1,654 | +5% $1,621 | +10% $1,589 |
|---|---|---|---|---|---|
| Rent | -10% $1,402 | -5% $1,528 | +0% $1,654 | +5% $1,780 | +10% $1,906 |
| Rate | -1.0pp $1,712 | -0.5pp $1,683 | base $1,654 | +0.5pp $1,624 | +1.0pp $1,594 |
2-unit breakdown (identical units grouped — click to expand)
| Units | Beds | Baths | Est. rent |
|---|---|---|---|
| 2× units | 2 | 1 | $3,194 |
| #1 | 2 | 1 | $1,597 |
| #2 | 2 | 1 | $1,597 |
| Total (2 units) | $3,193 | ||
UW: 25.0% down · 7.5% · 30yr · 1.5% tax · 5.0% vac · 8.0% maint · 8.0% mgmt
Financing live
Cash to close
- Down payment
- $28,750
- Closing costs
- $3,450
- Reserves months
- —
- Total cash needed
- —
Loan-product check · same deal, 3 products live
Conventional
25% down · 7.5% · 30yr
- Down + closing
- —
- Monthly P&I
- —
- Monthly cashflow
- —
- DSCR
- —
- Eligible?
- —
Personal DTI + credit; lowest rate.
DSCR
20% down · 8.5% · 30yr
- Down + closing
- —
- Monthly P&I
- —
- Monthly cashflow
- —
- DSCR
- —
- Eligible?
- —
No personal income docs; deal must DSCR.
Hard money
10% down · 12.0% · 12mo
- Down + closing
- —
- Monthly P&I
- —
- Monthly cashflow
- —
- DSCR
- —
- Eligible?
- —
Short-term bridge; refi at stabilization.
Rent comps 32 comps
| Address | Beds | Baths | Sqft | Rent | $/sqft | DOM | Units | Dist |
|---|---|---|---|---|---|---|---|---|
| 282 Livingston Ave Albany, NY | 3.0 | 1.5 | 1464 | $2,400 | $1.64 | 25d | 1 | 0.48mi |
| 147 Western Ave Albany, NY | 3.0 | 1.0 | 1428 | $1,800 | $1.26 | 16d | 1 | 0.50mi |
| 178 Western Ave Unit 3 Albany, NY | 3.0 | 1.0 | 1500 | $1,725 | $1.15 | 16d | 1 | 0.56mi |
| 569 Washington Ave Unit 1st Floor Albany, NY | 4.0 | 1.0 | 1275 | $2,000 | $1.57 | 45d | 1 | 0.56mi |
| 223 Western Ave #1 Albany, NY | 3.0 | 1.0 | 1100 | $1,750 | $1.59 | 25d | 1 | 0.60mi |
| 58 Elberon Pl Apt 2 Albany, NY | 4.0 | 1.0 | 1250 | $2,200 | $1.76 | 45d | 1 | 0.64mi |
| 273 Western Ave Unit 3 Albany, NY | 3.0 | 1.0 | 1100 | $1,850 | $1.68 | 25d | 1 | 0.67mi |
| 433 Hamilton St Unit 1 Albany, NY | 4.0 | 1.0 | 1200 | $2,300 | $1.92 | 16d | 1 | 0.71mi |
| 437 Hamilton St Unit 2 Albany, NY | 4.0 | 1.0 | 1200 | $2,300 | $1.92 | 16d | 1 | 0.71mi |
| 489 Hamilton St Unit 1 Albany, NY | 3.0 | 1.0 | 1100 | $1,800 | $1.64 | 16d | 1 | 0.76mi |
| 257 Quail St Albany, NY | 4.0 | 2.5 | 2208 | $2,800 | $1.27 | 45d | 1 | 0.76mi |
| 830 Madison Ave Albany, NY | 3.0 | 1.0 | 1180 | $1,700 | $1.44 | 25d | 1 | 0.85mi |
| 520 Madison Ave Unit 1 Albany, NY | 3.0 | 1.0 | 1080 | $1,700 | $1.57 | 45d | 1 | 0.85mi |
| 88 Willett St Albany, NY | 3.0 | 1.0 | 825 | $2,080 | $2.52 | 16d | 10 | 0.86mi |
| 32 1st St Albany, NY | 4.0 | 1.5 | 1773 | $1,850 | $1.04 | 45d | 1 | 0.98mi |
| 673 Myrtle Ave Albany, NY | 4.0 | 1.0 | 1076 | $2,400 | $2.23 | 22d | 1 | 0.99mi |
| 614 Park Ave Albany, NY | 3.0 | 1.0 | 1118 | $2,500 | $2.24 | 45d | 1 | 1.02mi |
| 346 Madison Ave Albany, NY | 3.0 | 2.0 | 1500 | $2,495 | $1.66 | 25d | 1 | 1.08mi |
| 346 Madison Ave Unit 3 Albany, NY | 3.0 | 2.0 | 1110 | $2,725 | $2.45 | 45d | 1 | 1.08mi |
| 546 Mercer St Unit 1 Albany, NY | 3.0 | 1.0 | 1400 | $1,800 | $1.29 | 25d | 1 | 1.11mi |
| 602 Morris St Albany, NY | 3.0 | 1.0 | 1270 | $1,850 | $1.46 | 16d | 1 | 1.11mi |
| 11 King Ave Unit 2 Albany, NY | 3.0 | 1.0 | 1100 | $1,600 | $1.45 | 16d | 1 | 1.14mi |
| 21 Woodlawn Ave Unit 3RDFL Albany, NY | 3.0 | 1.0 | 1300 | $1,500 | $1.15 | 45d | 1 | 1.21mi |
| 21 Woodlawn Ave Unit 3rd floor Albany, NY | 3.0 | 1.0 | 1300 | $1,500 | $1.15 | 25d | 1 | 1.21mi |
| 201 Park Ave Unit 10 Albany, NY | 3.0 | 2.0 | 1600 | $2,100 | $1.31 | 45d | 1 | 1.23mi |
| 32 Peyster St Unit 2nd Albany, NY | 3.0 | 2.0 | 1500 | $2,300 | $1.53 | 45d | 1 | 1.31mi |
| 52 Grove Ave Albany, NY | 4.0 | 1.0 | 1200 | $2,200 | $1.83 | 22d | 1 | 1.38mi |
| 104 S Main Ave Unit 1 Albany, NY | 3.0 | 1.0 | 1300 | $2,600 | $2.00 | 45d | 1 | 1.38mi |
| 135 Winthrop Ave Albany, NY | 3.0 | 2.0 | 1788 | $3,500 | $1.96 | 45d | 1 | 1.41mi |
| 32 Richmond St Unit 2 Albany, NY | 3.0 | 3.0 | 1248 | $2,500 | $2.00 | 16d | 1 | 1.43mi |
| 78 S Pine Ave Unit 2 Albany, NY | 3.0 | 1.5 | 1541 | $2,350 | $1.52 | 16d | 1 | 1.48mi |
| 38 W Erie St Albany, NY | 4.0 | 2.0 | 1440 | $2,800 | $1.94 | 25d | 1 | 1.48mi |
Listing history 41 events
-
2026-06-21days on market $115,000 Active 87 DOM
-
2026-06-18days on market $115,000 Active 84 DOM
-
2026-06-17days on market $115,000 Active 83 DOM
-
2026-06-16days on market $115,000 Active 82 DOM
-
2026-06-15days on market $115,000 Active 81 DOM
-
2026-06-14days on market $115,000 Active 79 DOM
-
2026-06-10days on market $115,000 Active 76 DOM
-
2026-06-08days on market $115,000 Active 74 DOM
-
2026-06-07days on market $115,000 Active 73 DOM
-
2026-06-03days on market $115,000 Active 69 DOM
-
2026-06-02days on market $115,000 Active 68 DOM
-
2026-06-01days on market $115,000 Active 67 DOM
-
2026-05-31days on market $115,000 Active 66 DOM
-
2026-05-31days on market $115,000 Active 65 DOM
-
2026-03-26$115,000 Active 514-char remark
Show marketing remark (514 chars)
Two-family home in Albany! Great investment potential! This property needs some work, but with the right vision, it can be transformed into a strong income-producing asset. Conveniently located near major highways and bus lines, making commuting easy for future tenants. Fix it up, rent it out, and start generating steady cash flow. Don't miss this opportunity to collect rental income from this promising property! Market rents could be 1702.00 each apartment so 3404 per month...40,848 rental income per year.
-
2024-10-25soldstatus $100,000
-
2024-06-28price $94,388
-
2024-06-04status Active
-
2024-04-11status Pending
-
2024-04-11historical Contingent
-
2024-04-11historical
-
2024-04-02price $99,999
-
2024-03-04$109,999 Active
-
2023-03-29status Pending
-
2022-10-03status Pending
-
2022-09-28historical
-
2022-07-11$105,000 Active
-
2020-11-24soldstatus $32,500 Closed (Final Sale)
-
2020-10-13status Pend (Under Cntr)
-
2020-10-07price $39,900
-
2020-09-04price $44,900
-
2020-08-01price $49,900
-
2020-05-29$54,900 New
-
2007-07-27soldstatus $25,000
-
2006-07-18soldstatus $30,000
-
2005-12-05soldstatus $54,500
-
2005-08-22$30,850
-
1999-03-08soldstatus $35,000
-
1998-03-06soldstatus $35,000
-
1997-10-16historical
-
1996-02-22$39,900
ⓘ Source: listings_history table (triggers on properties + properties_extension) + one-shot
backfill from property_details.listing_events for pre-trigger history.
Tax reassessment forecast NY · Partial reset (capped growth)
- Current annual tax
- $2,611 · $218/mo
- Projected year-2 tax
- $2,611 · $218/mo
- Expected delta
- $0/yr ($0/mo · 0.0%)
ⓘ Screening estimate from a state-policy table — verify with the county assessor before closing.
Climate risk First Street
- Flood 1/10 Low FEMA zone X (unshaded) · 0% chance over 30 yrs
- Wildfire 1/10 Low
- Heat 4/10 Moderate 7 d/yr ≥97°F today · 16 d/yr by 30 yrs out
- Wind 3/10 Moderate 6% chance of damaging wind over 30 yrs
- Air quality 1/10 Low 0 unhealthy d/yr today · 0 by 30 yrs out
Nearby sold comps map
Loading sold comps map…
Walkable amenities ~0.75 mi
Loading nearby amenities…
Taxation est. · year 1
- Rental income
- $38,316
- − Mortgage interest
- −$6,442
- − Property taxes
- −$2,611
- − Insurance
- −$575
- − Repairs & maintenance
- −$3,065
- − Management
- −$3,065
- − Depreciation
- −$3,345
- Taxable income
- $19,212
- Est. tax owed @ 24.0%
- −$4,611
- After-tax cash flow
- $15,236/yr
For passive investors: Depreciation is non-cash, so a rental often shows a tax loss while cash-flowing — sheltering income. Rental losses are passive: they offset passive income freely, and up to $25,000/yr can offset ordinary (W-2) income if you actively participate and your MAGI is under $100k (phasing out to $0 by $150k); unused losses carry forward. On sale, claimed depreciation is recaptured at up to 25%, and gains may owe capital-gains tax (a 1031 exchange can defer both). Figures are a year-1 estimate at your 24.0% rate — not tax advice; consult a CPA.
Schools (NCES district)
- District
- Albany City School District
- NCES district ID
- 3602460
- Math proficiency
- 37% ▲ 6.00%
- Reading proficiency
- 40% ▲ 7.00%
- Median HH income
- $40,568
- Composite
- 32.34/100
- National rank
- #5744
- State rank
- #543 of 590 in NY
Livability — Albany
- Score
- 79/100
- State rank
- #129
- US rank
- #2083
Category grades
Schools grade is shown separately in the Schools card above.
Census & demographics
- Census place
- Albany, NY
- County
- Albany County · 196,626 people
- City population
- 116,921
- Metro
- Albany-Schenectady-Troy, NY
- Population (ZIP)
- 14,572
- Household income
- $41,548
- Rent vs Own
- Severe rent burden
- 2035.0
Population outlook (Albany County) Hauer SSP2
- Today (2025)
- 320,794 people
- By 2030
- 327,401 · +2.1%
- By 2040
- 338,218 · +5.4%
- By 2050
- 348,467 · +8.6%
- By 2075
- 381,693 · +19.0%
- By 2100
- 393,809 · +22.8%
Race, ethnicity, and origin ACS 2023
- Neighborhood character
- Highly diverse neighborhood (Simpson 0.75)
- Race & ethnicity
- Black 38% White 27% Hispanic / Latino 15% Two or more races 12% Asian 10%
- Hispanic origin (detail)
- Puerto Rican 10% Dominican 1%
- Common ancestry
- Italian 2% Lithuanian 2% Romanian 1%
- Foreign-born
- 22% · Canada, China
- Languages at home
- 75% English-only · Spanish 10% Other Indo-European 5% Chinese 3%
Political lean MEDSL · Albany
- 2024 margin
- Strong D (+25.8) · D 62.9% · R 37.1%
- 2008→2024 swing
- -3.6pp toward R · 2008: 29.4pp · 2024: 25.8pp
- All cycles
- 2024: D+25.8 2020: D+31.4 2016: D+24.3 2012: D+31.0 2008: D+29.4
Not yet ingested
- Civics
- —
Market trends
- HPI YoY
- ▼ -30.24%
- Current HPI
- 275.8109
- Rent YoY
- ▲ 5.37%
- Metro
- Albany-Schenectady-Troy, NY
- State GDP YoY
- ▲ 2.60%
- F500 in state
- 92
Industry mix (Fortune 500 HQ in NY)
| Industry | F500 HQs | Revenue |
|---|---|---|
| Financial Services | 10 | $950B |
|
||
| Consumer Goods | 9 | $162B |
|
||
| Insurance | 4 | $225B |
|
||
| Telecommunications | 2 | $144B |
|
||
| Pharmaceuticals | 2 | $112B |
|
||
| Media / Entertainment | 2 | $69B |
|
||
Price history
+188.2% since first listed27 events — show timeline
- 2026-03-26 Listed $115,000 Global MLS
- 2024-10-25 Sold (Public Records) $100,000 Public Records
- 2024-06-28 Price Changed $94,388 Global MLS
- 2024-06-04 Relisted — Global MLS
- 2024-04-11 Pending — Global MLS
- 2024-04-11 Contingent — Global MLS
- 2024-04-11 Listing Removed — Global MLS
- 2024-04-02 Price Changed $99,999 Global MLS
- 2024-03-04 Listed $109,999 Global MLS
- 2023-03-29 Pending — Global MLS
- 2022-10-03 Pending — Global MLS
- 2022-09-28 Listing Removed — Global MLS
- 2022-07-11 Listed $105,000 Global MLS
- 2020-11-24 Sold (MLS) $32,500 Global MLS
- 2020-10-13 Pending — Global MLS
- 2020-10-07 Price Changed $39,900 Global MLS
- 2020-09-04 Price Changed $44,900 Global MLS
- 2020-08-01 Price Changed $49,900 Global MLS
- 2020-05-29 Listed $54,900 Global MLS
- 2007-07-27 Sold (Public Records) $25,000 Public Records
- 2006-07-18 Sold (MLS) $30,000 Global MLS
- 2005-12-05 Sold (Public Records) $54,500 Public Records
- 2005-08-22 Listed $30,850 Global MLS
- 1999-03-08 Sold (MLS) $35,000 Global MLS
- 1998-03-06 Sold (Public Records) $35,000 Public Records
- 1997-10-16 Listing Removed — Global MLS
- 1996-02-22 Listed $39,900 Global MLS
Property tax history
-3.9%/yrLatest (2025): $2,611 · -0.7% YoY. Source: county tax records.
Cash-flow waterfall
monthlySold comps — $/sqft
last 12 mo · ≤1 miLoading sold comps…