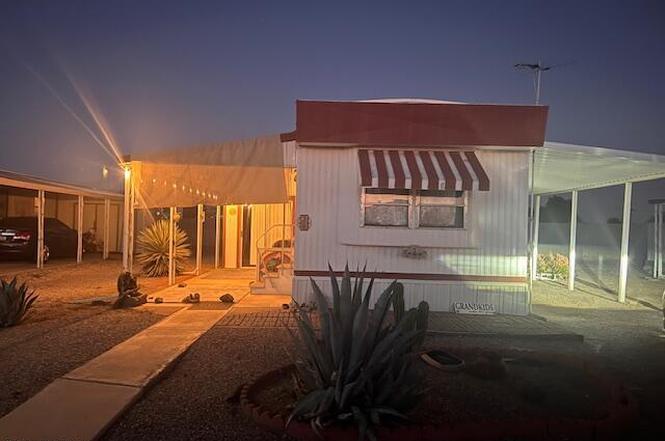
747 E Germann Rd #19 · San Tan Valley, AZ
Flood risk No data
- FEMA flood zone
- —
- Chance of flooding over 30 yrs
- —
- Est. flood insurance / yr
- —
Fire risk No data
- Est. fire insurance / yr
- —
Heat risk No data
- Hot days now (above threshold)
- —
- Hot days in 30 yrs
- —
Wind risk No data
- Chance of severe wind over 30 yrs
- —
Air-quality risk No data
- Unhealthy air days now
- —
- Unhealthy air days in 30 yrs
- —
Risk factors via First Street. Map © Google.
Why this score? — see what drove the C- grade
The composite is a weighted blend of 9 inputs, each scored 0–100. Each bar is that input's sub-score; the figure is the points it added to the 100-point composite (weight × sub-score).
- Cash flow +15.0/30.0
- ARV discount +15.0/15.0
- 1% rule +5.0/10.0
- DSCR +5.0/10.0
- Rent growth +2.9/5.0
- Livability +2.7/5.0
- Schools +2.6/10.0
- Condition / age +2.5/5.0
- Appreciation +0.0/10.0
$17,000
🖨 Deal sheet 📄 Offer letter ✓ Due diligence
Listing remarks
Motivated Seller! This little 2 Bedroom 1 bath gem could be a diamond in the rough. It's a cute little home in the popular 55+ Gated Manufactured home park of Pleasant Valley. There's an add on room that has been finished with a washer, dryer and cabinets. It's partially furnished with an electric fireplace, (the main source of heat right now), and living room furniture. The owner has started a remodel. Once it is remodeled the price will increase. The clubhouse hosts many activities including potlucks, card games, Bingo, and many more. Enjoy relaxing by the pool and spa. Check it out and be a part of this wonderful active adult community. Come and take a look!
Key facts
- Clubhouse
- Pool and spa
- Electric fireplace
Tags
Neighborhood map
What this means for you Summary
Snapshot
- This is a 2-bed/1.0-bath manufactured listed at $17k.
Deal economics
- At list price, monthly cash flow is $1k ($14k/yr) — positive.
- The deal already cash-flows at list — no discount required.
- Meets the 1% rule at list price ($2k rent vs $17k).
- Recommended offer: $16k (6.0% below list) — sets the bar for market timing.
- Cap rate 88.3% vs local median 3.2% in San Tan Valley — top-decile yield for the area; either an underpriced asset or a hidden risk that comps aren't pricing in. Stress-test before assuming the spread holds.
Location & tenants
- Location reads 54/100 on livability (#282 in AZ) — a working-class tenant base; expect higher turnover. Strengths: housing A+, employment B+; Watch: crime D+, amenities F, commute F.
- J O Combs Unified School District (4445) (rural): math 27% / reading 30% proficiency, ranked #109 of 249 in AZ (top 44%) — low school quality limits family demand, transient renter base, plan for 1-2y turnover.
- Zoned schools: Jack Harmon Elementary School (math 24% / reading 32%, grade F, #586 of 1,109 statewide, top 53%, 425 students, 56% FRL); Combs Center For Success Middle School (1 students, 0% FRL); Combs High School (math 25% / reading 31%, grade F, #136 of 381 statewide, top 36%, 1,356 students, 37% FRL) — zoned schools at 31% FRL track the district average.
- Market conditions: Rents rising (+1.7%/yr); 823 active listings in the ZIP; solid renter incomes; 9,504 units permitted in Pinal County in 2024 (776 in 5+ unit buildings).
Forward outlook
- Local home prices are declining (-3.0%/yr); year-one equity from $118 of loan paydown is wiped out by about $510 of value loss. Plan a longer hold.
- At projected returns (-3.0% appreciation + 1.7% rent growth), your $5k cash investment doubles in ~1 year — after that, you're playing with house money.
Negotiation context
- It's been on market 63 days — a 6% lower offer ($16k) is reasonable based on typical stale-listing flexibility.
- 6 sale attempts since 2y ago; this cycle's ask has dropped $1k (6%) from the opening price — seller is motivated, your offer sets the floor, not the list.
Questions for the listing agent
- It's been on market 63 days. Have you received any prior offers? Is the seller open to a 6% concession, seller financing, or rate buy-down credit?
- Built in 1965 — when were the roof, HVAC, electrical panel, plumbing, and water heater last replaced?
- Why hasn't it sold? Are there any deal-killer items the seller is aware of (foundation, flood, title, zoning, code violations)?
- Is there a deadline driving the sale (1031 exchange, divorce, estate, relocation)? That informs how much negotiation room exists.
- Schools are D-rated, which usually means shorter tenancies and higher turnover. Who's the typical renter profile here, and what's been the actual vacancy rate?
- Crime grade is D in this area — have there been break-ins, vandalism, or insurance claims at this property in the last 3 years? What carrier currently insures it and at what premium?
- What's the average days-on-market for RENTAL listings here right now (not sales)? A rising rental-DOM trend means longer vacancies and softer asking-rent achievability than the comps imply.
- What's the recent tenant-quality profile in this submarket — average credit score on applications, eviction rate, late-payment / NSF rate, and stable-employment percentage? A property-management company in the area should have these aggregated.
- How much new for-sale + rental construction is in the pipeline within 1–3 miles? Heavy new supply typically softens prices + rents 12–24 months out; constrained supply supports both.
Investment metrics
- 1% rule
- 9.53% ✓
- Cap rate
- 88.34%
- Cash-on-cash
- 293.01%
- DSCR
- 14.04
- GRM
- 0.9
CMA / ARV
- ARV (on-the-fly)
- $21,780
- Comps found
- 5
Show comp detail 5 sales within ~0.75 mi
| Address | Dist | Beds/Ba | Sqft | Sold | Price | $/sf | Match |
|---|---|---|---|---|---|---|---|
| 747 E Germann Rd #19 | 0.00mi | 2/1.0 | 660 (0%) | 1mo | $16,000 | $24 | 100 |
| 747 E Germann Rd #135 | 0.00mi | 1/1.0 (-1) | 660 (0%) | 4mo | $43,000 | $65 | 91 |
| 747 E Germann Rd #55 | 0.00mi | 1/1.0 (-1) | 728 (+10%) | 1mo | $40,000 | $55 | 77 |
| 747 E Germann Rd #49 | 0.00mi | 2/1.5 | 720 (+9%) | 11mo | $24,000 | $33 | 74 |
| 747 E Germann Rd #70 | 0.16mi | 1/1.0 (-1) | 700 (+6%) | 11mo | $8,900 | $13 | 68 |
Match score weights: distance 35% · size 25% · config 20% · recency 20%. Top-matched comps best support the ARV.
Projected returns pro-forma
-3.0% appreciation · 1.7% rent growth · sell at horizon
- IRR
- —
- Equity multiple
- 15.54×
- Total profit
- $69,204
- Equity at exit
- $2,535
- IRR
- —
- Equity multiple
- 31.95×
- Total profit
- $147,319
- Equity at exit
- $1,470
Cash invested: $4,760 (down + closing). Projections, not guarantees.
Landlord ↔ Tenant lean methodology
- Overall (STATE)
- 87 Strongly Landlord-Friendly
- State Arizona
- 87 Strongly Landlord-Friendly · R+3
- County
- — inherits STATE
- City
- — inherits STATE
ZIP-level market 85140
- Home prices YoY
- -33.1%
- Rents YoY
- 1.7%
- Active inventory
- 823
- Price-to-rent
- 0.9×
Monthly cashflow live
- Estimated rent
- $1,620 medium interval (Pro) →
- Mortgage (P&I)
- −$89
- Tax est. 1.5%
- −$21 /mo · $255/yr
- Insurance
- −$7
- HOA
- −$0
- Vacancy / Maint / Mgmt
- −$340
- Net cashflow
- $1,162
Break-even live
UW: 25.0% down · 7.5% · 30yr · 1.5% tax · 5.0% vac · 8.0% maint · 8.0% mgmt
Financing live
Cash to close
- Down payment
- $4,250
- Closing costs
- $510
- Reserves months
- —
- Total cash needed
- —
Loan-product check · same deal, 3 products live
Conventional
25% down · 7.5% · 30yr
- Down + closing
- —
- Monthly P&I
- —
- Monthly cashflow
- —
- DSCR
- —
- Eligible?
- —
Personal DTI + credit; lowest rate.
DSCR
20% down · 8.5% · 30yr
- Down + closing
- —
- Monthly P&I
- —
- Monthly cashflow
- —
- DSCR
- —
- Eligible?
- —
No personal income docs; deal must DSCR.
Hard money
10% down · 12.0% · 12mo
- Down + closing
- —
- Monthly P&I
- —
- Monthly cashflow
- —
- DSCR
- —
- Eligible?
- —
Short-term bridge; refi at stabilization.
Listing history 14 events
-
2026-04-24status Pending
-
2026-03-15price $17,000
-
2026-02-19$18,000 Active
-
2026-01-29historical
-
2026-01-26status Active
-
2026-01-17historical
-
2025-11-10status Active
-
2025-11-03historical
-
2025-09-25$15,000 Active
-
2025-08-25historical
-
2025-06-06$19,999 Active
-
2024-06-04historical
-
2024-01-13price $25,900
-
2024-01-04$29,900 Active
ⓘ Source: listings_history table (triggers on properties + properties_extension) + one-shot
backfill from property_details.listing_events for pre-trigger history.
Nearby sold comps map
Loading sold comps map…
Walkable amenities ~0.75 mi
Loading nearby amenities…
Taxation est. · year 1
- Rental income
- $19,439
- − Mortgage interest
- −$952
- − Property taxes
- −$255
- − Insurance
- −$85
- − Repairs & maintenance
- −$1,555
- − Management
- −$1,555
- − Depreciation
- −$495
- Taxable income
- $14,542
- Est. tax owed @ 24.0%
- −$3,490
- After-tax cash flow
- $10,457/yr
For passive investors: Depreciation is non-cash, so a rental often shows a tax loss while cash-flowing — sheltering income. Rental losses are passive: they offset passive income freely, and up to $25,000/yr can offset ordinary (W-2) income if you actively participate and your MAGI is under $100k (phasing out to $0 by $150k); unused losses carry forward. On sale, claimed depreciation is recaptured at up to 25%, and gains may owe capital-gains tax (a 1031 exchange can defer both). Figures are a year-1 estimate at your 24.0% rate — not tax advice; consult a CPA.
Schools (NCES district)
- District
- J O Combs Unified School District (4445)
- NCES district ID
- 0403990
- Math proficiency
- 27% ▼ -10.00%
- Reading proficiency
- 30% ▼ -8.00%
- Median HH income
- $61,053
- Composite
- 26.01/100
- National rank
- #7314
- State rank
- #109 of 249 in AZ
Livability — San Tan Valley
- Score
- 54/100
- State rank
- #282
- US rank
- #24192
Category grades
Schools grade is shown separately in the Schools card above.
Census & demographics
- Census place
- San Tan Valley, AZ
- County
- Pinal County · 399,947 people
- City population
- 95,704
- Metro
- Phoenix-Mesa-Chandler, AZ
- Population (ZIP)
- 51,260
- Household income
- $101,477
- Rent vs Own
- Severe rent burden
- 389.0
Population outlook (Pinal County) Hauer SSP2
- Today (2025)
- 437,574 people
- By 2030
- 446,903 · +2.1%
- By 2040
- 452,589 · +3.4%
- By 2050
- 444,126 · +1.5%
- By 2075
- 430,300 · -1.7%
- By 2100
- 393,536 · -10.1%
Race, ethnicity, and origin ACS 2023
- Neighborhood character
- Predominantly White (67%)
- Race & ethnicity
- White 67% Hispanic / Latino 20% Two or more races 9% Black 4% Native American 4% Asian 2%
- Hispanic origin (detail)
- Mexican 16%
- Common ancestry
- Romanian 3% Lithuanian 3% Slovak 2%
- Foreign-born
- 6% · Canada
- Languages at home
- 87% English-only · Spanish 10% Other Asian/Pacific 1%
Political lean MEDSL · Pinal
- 2024 margin
- Strong R (+22.1) · D 38.5% · R 60.6%
- 2008→2024 swing
- -7.6pp toward R · 2008: -14.5pp · 2024: -22.1pp
- All cycles
- 2024: R+22.1 2020: R+17.3 2016: R+19.3 2012: R+17.1 2008: R+14.5
Not yet ingested
- Civics
- —
Market trends
- HPI YoY
- ▼ -132.81%
- Current HPI
- 268.1579
- Rent YoY
- ▲ 1.70%
- Metro
- Phoenix-Mesa-Chandler, AZ
- State GDP YoY
- ▲ 4.54%
- F500 in state
- 20
Industry mix (Fortune 500 HQ in AZ)
| Industry | F500 HQs | Revenue |
|---|---|---|
| Technology | 2 | $13B |
|
||
| Mining / Metals | 1 | $23B |
|
||
| Environmental Services | 1 | $16B |
|
||
| Metals / Steel | 1 | $14B |
|
||
| Technology Distribution | 1 | $9B |
|
||
| Homebuilding | 1 | $8B |
|
||
Price history
-43.1% since first listed14 events — show timeline
- 2026-04-24 Pending — ARMLS
- 2026-03-15 Price Changed $17,000 ARMLS
- 2026-02-19 Listed $18,000 ARMLS
- 2026-01-29 Listing Removed — ARMLS
- 2026-01-26 Relisted — ARMLS
- 2026-01-17 Listing Removed — ARMLS
- 2025-11-10 Relisted — ARMLS
- 2025-11-03 Listing Removed — ARMLS
- 2025-09-25 Listed $15,000 ARMLS
- 2025-08-25 Listing Removed — ARMLS
- 2025-06-06 Listed $19,999 ARMLS
- 2024-06-04 Listing Removed — ARMLS
- 2024-01-13 Price Changed $25,900 ARMLS
- 2024-01-04 Listed $29,900 ARMLS
Cash-flow waterfall
monthlySold comps — $/sqft
last 12 mo · ≤1 miLoading sold comps…