1941 N Golden State Blvd #33 · Fresno, CA
Flood risk 1/10 · Minimal
- FEMA flood zone
- X (unshaded)
- Chance of flooding over 30 yrs
- 0.0%
- Est. flood insurance / yr
- $507 – $1,088
Fire risk 1/10 · Minimal
- Est. fire insurance / yr
- $659 – $1,223
Heat risk 8/10 · Major
- Hot days now (above 105°F)
- 7 days/yr
- Hot days in 30 yrs
- 17 days/yr
Wind risk 1/10 · Minimal
- Chance of severe wind over 30 yrs
- —
Air-quality risk 10/10 · Severe
- Unhealthy air days now
- 48 days/yr
- Unhealthy air days in 30 yrs
- 50 days/yr
Risk factors via First Street. Map © Google.
Why this score? — see what drove the D grade
The composite is a weighted blend of 9 inputs, each scored 0–100. Each bar is that input's sub-score; the figure is the points it added to the 100-point composite (weight × sub-score).
- Cash flow +15.0/30.0
- ARV discount +7.5/15.0
- 1% rule +5.0/10.0
- DSCR +5.0/10.0
- Rent growth +3.8/5.0
- Livability +3.1/5.0
- Schools +2.7/10.0
- Condition / age +2.2/5.0
- Appreciation +0.0/10.0
$28,000
🖨 Deal sheet 📄 Offer letter ✓ Due diligence
Key facts
- Community pool
- Built 1965
- Listed 85 days
Neighborhood map
What this means for you Summary
Snapshot
- This is a 1-bed/1.0-bath manufactured listed at $28k. Condition is rated fair.
Deal economics
- At list price, monthly cash flow is $808 ($10k/yr) — positive.
- The deal already cash-flows at list — no discount required.
- Meets the 1% rule at list price ($1k rent vs $28k).
- Recommended offer: $26k (6.0% below list) — sets the bar for market timing.
- Cap rate 40.9% vs local median 3.7% in Fresno — top-decile yield for the area; either an underpriced asset or a hidden risk that comps aren't pricing in. Stress-test before assuming the spread holds.
Location & tenants
- Location reads 62/100 on livability (#469 in CA) — a middle-class / working-renter tenant base. Strengths: commute A+, housing A+; Watch: amenities D+, employment D+, schools D.
- Fresno Unified (urban): math 18% / reading 47% proficiency, ranked #327 of 517 in CA (top 63%) — families likely to look elsewhere, expect single-tenant / working-renter base with shorter leases; 77% free/reduced lunch — lower-income household profile, screen leases tightly.
- Market conditions: Rents rising fast (+5.2%/yr); 96 active listings in the ZIP; 11 comparable units currently listed for rent nearby; rentals leasing fast (median 2d on market — plan ~1-2 weeks tenant-placement turnaround); 2,426 units permitted in Fresno County in 2024 (296 in 5+ unit buildings).
Forward outlook
- Local home prices are declining (-3.0%/yr); year-one equity from $194 of loan paydown is wiped out by about $840 of value loss. Plan a longer hold.
- Fresno County population projected at +11% by 2050 — modest demand growth; plan on rents tracking national, not racing it.
- At projected returns (-3.0% appreciation + 5.2% rent growth), your $8k cash investment doubles in ~1 year — after that, you're playing with house money.
Negotiation context
- It's been on market 85 days — a 6% lower offer ($26k) is reasonable based on typical stale-listing flexibility.
Risks & watch-outs
- Climate carrying-cost: extreme-heat days projected 7→17/yr by 2055 (HVAC capex compounding) — expect insurance premiums to compound above CPI over the hold.
Questions for the listing agent
- It's been on market 85 days. Have you received any prior offers? Is the seller open to a 6% concession, seller financing, or rate buy-down credit?
- Have any recent inspections been done? Can we get a copy of the seller's disclosures and any deferred-maintenance estimates?
- Built in 1965 — when were the roof, HVAC, electrical panel, plumbing, and water heater last replaced?
- Why hasn't it sold? Are there any deal-killer items the seller is aware of (foundation, flood, title, zoning, code violations)?
- Is there a deadline driving the sale (1031 exchange, divorce, estate, relocation)? That informs how much negotiation room exists.
- Schools are D-rated, which usually means shorter tenancies and higher turnover. Who's the typical renter profile here, and what's been the actual vacancy rate?
- Crime grade is F in this area — have there been break-ins, vandalism, or insurance claims at this property in the last 3 years? What carrier currently insures it and at what premium?
- The area grade is low — what's the realistic commute time and amenity access for the typical tenant pool here? Any planned neighborhood developments (good or bad) we should know about?
- What's the average days-on-market for RENTAL listings here right now (not sales)? A rising rental-DOM trend means longer vacancies and softer asking-rent achievability than the comps imply.
- What's the recent tenant-quality profile in this submarket — average credit score on applications, eviction rate, late-payment / NSF rate, and stable-employment percentage? A property-management company in the area should have these aggregated.
- How much new for-sale + rental construction is in the pipeline within 1–3 miles? Heavy new supply typically softens prices + rents 12–24 months out; constrained supply supports both.
Investment metrics
- 1% rule
- 4.53% ✓
- Cap rate
- 40.94%
- Cash-on-cash
- 123.72%
- DSCR
- 6.50
- GRM
- 1.8
CMA / ARV
- ARV (median comp)
- $80,787
- List price
- $28,000
- Delta
- -65.34%
- Verdict
- UNDERPRICED
- Comps
- 1 within 2.0 mi
Projected returns pro-forma
-3.0% appreciation · 5.19% rent growth · sell at horizon
- IRR
- —
- Equity multiple
- 7.35×
- Total profit
- $49,820
- Equity at exit
- $4,175
- IRR
- —
- Equity multiple
- 16.56×
- Total profit
- $122,006
- Equity at exit
- $2,421
Cash invested: $7,840 (down + closing). Projections, not guarantees.
Landlord ↔ Tenant lean methodology
- Overall (STATE)
- 18 Strongly Tenant-Friendly
- State California
- 18 Strongly Tenant-Friendly · D+13
- County
- — inherits STATE
- City
- — inherits STATE
ZIP-level market 93705
- Rents YoY
- 5.2%
- Active inventory
- 96
- Price-to-rent
- 1.8×
Monthly cashflow live
- Estimated rent
- $1,268 high interval (Pro) →
- Mortgage (P&I)
- −$147
- Tax est. 1.5%
- −$35 /mo · $420/yr
- Insurance
- −$12
- HOA
- −$0
- Vacancy / Maint / Mgmt
- −$266
- Net cashflow
- $808
Break-even live
UW: 25.0% down · 7.5% · 30yr · 1.5% tax · 5.0% vac · 8.0% maint · 8.0% mgmt
Financing live
Cash to close
- Down payment
- $7,000
- Closing costs
- $840
- Reserves months
- —
- Total cash needed
- —
Loan-product check · same deal, 3 products live
Conventional
25% down · 7.5% · 30yr
- Down + closing
- —
- Monthly P&I
- —
- Monthly cashflow
- —
- DSCR
- —
- Eligible?
- —
Personal DTI + credit; lowest rate.
DSCR
20% down · 8.5% · 30yr
- Down + closing
- —
- Monthly P&I
- —
- Monthly cashflow
- —
- DSCR
- —
- Eligible?
- —
No personal income docs; deal must DSCR.
Hard money
10% down · 12.0% · 12mo
- Down + closing
- —
- Monthly P&I
- —
- Monthly cashflow
- —
- DSCR
- —
- Eligible?
- —
Short-term bridge; refi at stabilization.
Rent comps 11 comps
| Address | Beds | Baths | Sqft | Rent | $/sqft | DOM | Units | Dist |
|---|---|---|---|---|---|---|---|---|
| 2130 N Marks Ave Fresno, CA | 2.0–4.0 | 1.0–2.0 | 900 | $1,595 | $1.77 | 1d | 5 | 0.43mi |
| 2212 N Marks Ave Fresno, CA | 1.0–2.0 | 1.0 | 671 | $1,265 | $1.89 | 1d | 2 | 0.46mi |
| 2087 N Marks Ave Fresno, CA | 1.0 | 1.0 | 700 | $1,350 | $1.93 | 2d | 1 | 0.55mi |
| 849 W Cambridge Ave Fresno, CA | 1.0 | 1.0 | 700 | $1,150 | $1.64 | 23d | 1 | 0.75mi |
| 3166 W Princeton Ave Fresno, CA | 2.0 | 1.0 | 730 | $1,300 | $1.78 | 1d | 2 | 0.94mi |
| 1584 N Carruth Ave Unit B Fresno, CA | 1.0 | 1.0 | 520 | $1,250 | $2.40 | 43d | 1 | 0.95mi |
| 3165 W Shields Ave Fresno, CA | 2.0 | 1.0 | 565 | $1,175 | $2.08 | 1d | 1 | 1.01mi |
| 3207 W Shields Ave Fresno, CA | 1.0–3.0 | 1.0–2.0 | 959 | $1,210 | $1.26 | 1d | 3 | 1.07mi |
| 610 W Hammond Ave Unit 614 Fresno, CA | 2.0 | 1.0 | 750 | $1,295 | $1.73 | 1d | 1 | 1.09mi |
| 534 W Hedges Ave Unit 534 Fresno, CA | 1.0 | 1.0 | 660 | $1,200 | $1.82 | 1d | 1 | 1.09mi |
| 1324 N Farris Ave Unit C Fresno, CA | — | 1.0 | 500 | $975 | $1.95 | 11d | 1 | 1.40mi |
Listing history 16 events
-
2026-06-18days on market $28,000 Active 85 DOM
-
2026-06-17days on market $28,000 Active 84 DOM
-
2026-06-16days on market $28,000 Active 83 DOM
-
2026-06-15days on market $28,000 Active 82 DOM
-
2026-06-13days on market $28,000 Active 80 DOM
-
2026-06-10days on market $28,000 Active 77 DOM
-
2026-06-09days on market $28,000 Active 76 DOM
-
2026-06-08days on market $28,000 Active 75 DOM
-
2026-06-07days on market $28,000 Active 74 DOM
-
2026-06-05days on market $28,000 Active 71 DOM
-
2026-06-03days on market $28,000 Active 70 DOM
-
2026-06-02days on market $28,000 Active 69 DOM
-
2026-06-01days on market $28,000 Active 68 DOM
-
2026-05-31days on market $28,000 Active 67 DOM
-
2026-04-16price $30,000
-
2026-03-24$35,000 Active
ⓘ Source: listings_history table (triggers on properties + properties_extension) + one-shot
backfill from property_details.listing_events for pre-trigger history.
Climate risk First Street
- Flood 1/10 Low FEMA zone X (unshaded) · 0% chance over 30 yrs
- Wildfire 1/10 Low
- Heat 8/10 Severe 7 d/yr ≥105°F today · 17 d/yr by 30 yrs out
- Wind 1/10 Low
- Air quality 10/10 Extreme 48 unhealthy d/yr today · 50 by 30 yrs out
Nearby sold comps map
Loading sold comps map…
Walkable amenities ~0.75 mi
Loading nearby amenities…
Taxation est. · year 1
- Rental income
- $15,218
- − Mortgage interest
- −$1,568
- − Property taxes
- −$420
- − Insurance
- −$140
- − Repairs & maintenance
- −$1,217
- − Management
- −$1,217
- − Depreciation
- −$815
- Taxable income
- $9,840
- Est. tax owed @ 24.0%
- −$2,362
- After-tax cash flow
- $7,338/yr
For passive investors: Depreciation is non-cash, so a rental often shows a tax loss while cash-flowing — sheltering income. Rental losses are passive: they offset passive income freely, and up to $25,000/yr can offset ordinary (W-2) income if you actively participate and your MAGI is under $100k (phasing out to $0 by $150k); unused losses carry forward. On sale, claimed depreciation is recaptured at up to 25%, and gains may owe capital-gains tax (a 1031 exchange can defer both). Figures are a year-1 estimate at your 24.0% rate — not tax advice; consult a CPA.
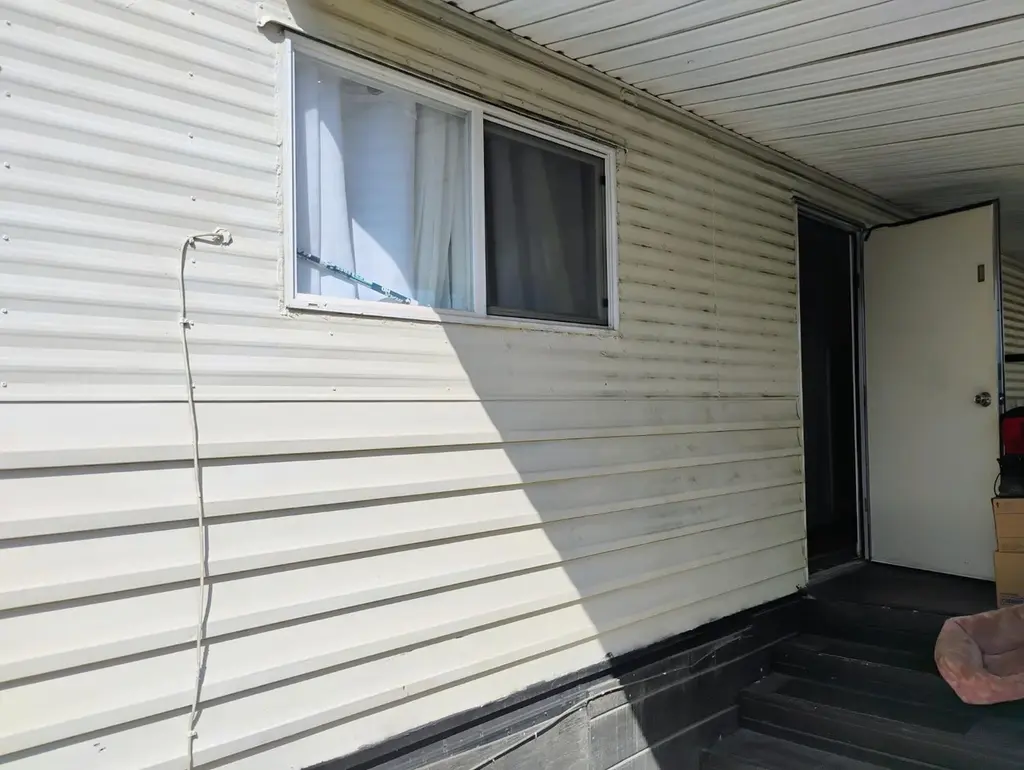
Condition & rehab AI · 7 photos
This manufactured home requires moderate renovations to improve its exterior, interior, and curb appeal, significantly increasing its resale and rental value.
Repairs flagged
- Major exterior siding — Severe weathering and peeling
- Major kitchen cabinets — Outdated and small
- Major bathroom fixtures — Outdated and small
Value-add opportunities
- Both Paint exterior siding — Enhances curb appeal and value
- Both Replace carpet — Improves comfort and value
- Both Paint interior walls — Freshens the space and adds value
Renovation cost estimate screening
| Repair item | Severity | Est. cost |
|---|---|---|
| exterior siding · Severe weathering and peeling | Major | $15,000–50,000 |
| kitchen cabinets · Outdated and small | Major | $15,000–50,000 |
| bathroom fixtures · Outdated and small | Major | $15,000–50,000 |
| Total estimated repair cost · 3 items | $45,000–150,000 |
Value-add ROI direction
- Both Paint exterior siding — Enhances curb appeal and value ↑
- Both Replace carpet — Improves comfort and value ↑
- Both Paint interior walls — Freshens the space and adds value ↑
ⓘ Cost ranges are severity-bucket heuristics (US national rule-of-thumb). Get contractor quotes + a written scope before underwriting a rehab budget.
Schools (NCES district)
- District
- Fresno Unified
- NCES district ID
- 0614550
- Math proficiency
- 18% ▼ -12.00%
- Reading proficiency
- 47% ▲ 9.00%
- Median HH income
- $36,095
- Composite
- 26.83/100
- National rank
- #7111
- State rank
- #327 of 517 in CA
Livability — Fresno
- Score
- 62/100
- State rank
- #469
- US rank
- #15907
Category grades
Schools grade is shown separately in the Schools card above.
Census & demographics
- Census place
- Fresno, CA
- County
- Fresno County · 834,801 people
- City population
- 593,114
- Metro
- Fresno, CA
- Population (ZIP)
- 38,888
- Household income
- $57,003
- Rent vs Own
- Severe rent burden
- 2217.0
Population outlook (Fresno County) Hauer SSP2
- Today (2025)
- 1,042,971 people
- By 2030
- 1,072,198 · +2.8%
- By 2040
- 1,122,408 · +7.6%
- By 2050
- 1,157,251 · +11.0%
- By 2075
- 1,182,575 · +13.4%
- By 2100
- 1,105,899 · +6.0%
Race, ethnicity, and origin ACS 2023
- Neighborhood character
- Diverse neighborhood (Simpson 0.56)
- Race & ethnicity
- Hispanic / Latino 62% Two or more races 34% White 22% Black 6% Asian 6% Native American 2%
- Hispanic origin (detail)
- Mexican 60%
- Common ancestry
- Lithuanian 1% Iranian 1% Russian 1%
- Foreign-born
- 13% · Canada, China
- Languages at home
- 61% English-only · Spanish 34% Other Asian/Pacific 2% Other Indo-European 1%
Political lean MEDSL · Fresno
- 2024 margin
- Toss-up / Even · D 46.5% · R 50.9% · Other 2.6%
- 2008→2024 swing
- -6.5pp toward R · 2008: 2.1pp · 2024: -4.4pp
- All cycles
- 2024: R+4.4 2020: D+7.8 2016: D+3.9 2012: R+2.9 2008: D+2.1
Not yet ingested
- Civics
- —
Market trends
- HPI YoY
- ▼ -331.23%
- Current HPI
- 399.0061
- Rent YoY
- ▲ 5.19%
- Metro
- Fresno, CA
- State GDP YoY
- ▲ 3.21%
- F500 in state
- 116
Industry mix (Fortune 500 HQ in CA)
| Industry | F500 HQs | Revenue |
|---|---|---|
| Technology | 27 | $1,492B |
|
||
| Financial Services | 3 | $174B |
|
||
| Retail | 3 | $44B |
|
||
| Insurance | 3 | $26B |
|
||
| Media / Entertainment | 2 | $115B |
|
||
| Pharmaceuticals / Biotech | 2 | $62B |
|
||
Price history
-14.3% since first listed2 events — show timeline
- 2026-04-16 Price Changed $30,000 FRESNOMLS
- 2026-03-24 Listed $35,000 FRESNOMLS
Cash-flow waterfall
monthlySold comps — $/sqft
last 12 mo · ≤1 miLoading sold comps…