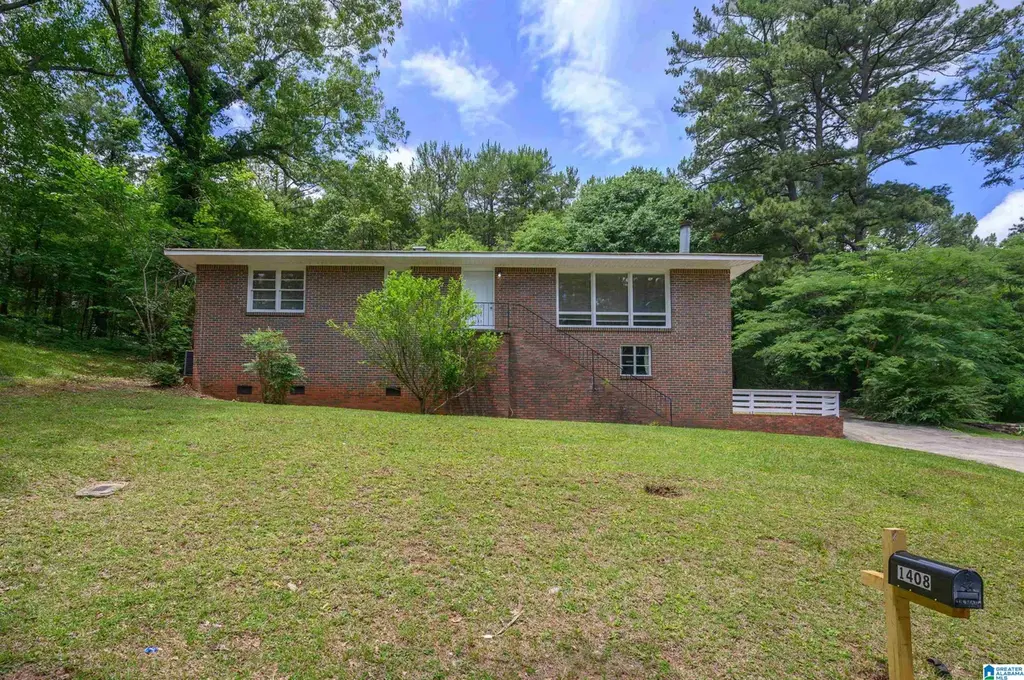
1408 29th Ave N · Hueytown, AL
Flood risk 1/10 · Minimal
- FEMA flood zone
- X (unshaded)
- Chance of flooding over 30 yrs
- 0.0%
- Est. flood insurance / yr
- $473 – $860
Fire risk 3/10 · Minor
- Est. fire insurance / yr
- $916 – $1,700
Heat risk 6/10 · Moderate
- Hot days now (above 109°F)
- 7 days/yr
- Hot days in 30 yrs
- 19 days/yr
Wind risk 6/10 · Moderate
- Chance of severe wind over 30 yrs
- 46.0%
Air-quality risk 3/10 · Minor
- Unhealthy air days now
- 2 days/yr
- Unhealthy air days in 30 yrs
- 5 days/yr
Risk factors via First Street. Map © Google.
Why this score? — see what drove the D+ grade
The composite is a weighted blend of 9 inputs, each scored 0–100. Each bar is that input's sub-score; the figure is the points it added to the 100-point composite (weight × sub-score).
- ARV discount +15.0/15.0
- Cash flow +11.9/30.0
- Appreciation +4.7/10.0
- DSCR +3.5/10.0
- 1% rule +3.1/10.0
- Rent growth +2.9/5.0
- Livability +2.9/5.0
- Condition / age +2.5/5.0
- Schools +1.8/10.0
$175,000
🖨 Deal sheet 📄 Offer letter ✓ Due diligence
Listing remarks MLS
Check out this 4-sided brick home with tons of natural light and plenty of storage. This three bedroom two bath home has a large master walk-in closet. Newly refinished hardwood flooring in the living, dining, hallway and bedrooms. The large sunroom overlooks a level partial fenced back yard and the basement garage has space for a workshop and storage. Plenty of extra off road parking!! Schedule your private showing today!!!
Key facts
- Hardwood flooring
- Large sunroom
- Basement garage
Tags
Property features AI
Finance
- HOA & community: No association fee
Exterior
- Parking: Attached garage with side entry; Total garage spaces: 1; Driveway parking and off-street parking; parking on main level
- Utilities: Public water; Connected sewer; Electric water heater; Internet service available
- Home design: 4-sided brick construction; Basement foundation; Partial daylight basement with both finished and unfinished areas; Tri-level: no / Split-level: no / Split foyer: no; Existing (previously built) home
- Construction: 4-sided brick exterior; Basement foundation
- Exterior features: Fenced yard; Some trees; Street lights on the block
Interior
- Kitchen: Laminate countertops; Electric cooktop; Electric oven; Built-in dishwasher; Refrigerator; Some stainless appliances
- Bedrooms: Master bedroom (main level); Two additional bedrooms (main level); Walk-in closets; Linen closet
- Flooring: Hardwood; Hardwood laminate; Tile flooring
- Bathrooms: Two full bathrooms; Separate shower and tub/shower combo; Separate vanities
- Heating & cooling: Gas heating; Central air conditioning; Ceiling fans
- Interior features: Smooth ceilings; Textured walls; One wood-burning fireplace with tile surround in the living room; Pantry
- Laundry & utility: Main-level laundry room; Washer hookup; Electric dryer hookup; Electric water heater
Neighborhood map
What this means for you Summary
Snapshot
- This is a 3-bed/2.0-bath single-family listed at $175k.
Deal economics
- At list price, monthly cash flow is $-46 ($-550/yr) — negative.
- To cash-flow at today's rent, offer at most $167k (4.6% below list).
- To meet the 1% rule (rent ≥ 1% of price), the offer needs to be $141k (19.2% below list).
- Recommended offer: $141k (19.2% below list) — sets the bar for 1% rule.
Location & tenants
- Location reads 57/100 on livability (#378 in AL) — a working-class tenant base; expect higher turnover. Strengths: cost of living A+, housing A+; Watch: employment D, crime F, amenities F.
- Jefferson County (suburban): math 9% / reading 32% proficiency, ranked #104 of 129 in AL (top 81%) — low school quality limits family demand, transient renter base, plan for 1-2y turnover.
- Zoned schools: Hueytown Primary School (653 students, 64% FRL); Hueytown High School (math 7% / reading 20%, grade F, #235 of 305 statewide, top 77%, 1,210 students, 79% FRL) — zoned schools average 72% FRL vs 49% district-wide (23 pts higher); higher-poverty schools than district average — tighter screening recommended.
- Market conditions: Rents rising (+1.6%/yr); 250 active listings in the ZIP; 18 comparable units currently listed for rent nearby; rentals at typical pace (median 14d on market — plan ~3-4 weeks tenant-placement turnaround); 2,114 units permitted in Jefferson County in 2024 (556 in 5+ unit buildings).
Forward outlook
- In year one you build about $160 of equity ($1k loan paydown + $-1k appreciation (-0.6% local appreciation)).
- Jefferson County population projected to shrink 4% by 2050 — rents likely to lag national; underwrite the cash flow, not the appreciation.
Negotiation context
- It's been on market 28 days — a 2% lower offer ($172k) is reasonable based on typical stale-listing flexibility.
- 3 sale attempts since 6y ago with the ask held roughly flat each time — persistent listings suggest the price (not the market) is what's stuck; bring a comps-based counter.
- Current owner paid $110k; list at $175k implies a 59% gain — meaningful room to come down on a strong offer.
Risks & watch-outs
- Climate carrying-cost: major wind risk, 46% chance of damaging wind over 30y; extreme-heat days projected 7→19/yr by 2055 (HVAC capex compounding) — expect insurance premiums to compound above CPI over the hold.
Questions for the listing agent
- What do current leases actually rent for vs. the listed asking? Can we see a recent rent roll and the last 12 months of T-12 income?
- Built in 1961 — when were the roof, HVAC, electrical panel, plumbing, and water heater last replaced?
- Is there a deadline driving the sale (1031 exchange, divorce, estate, relocation)? That informs how much negotiation room exists.
- Schools are F-rated, which usually means shorter tenancies and higher turnover. Who's the typical renter profile here, and what's been the actual vacancy rate?
- Crime grade is F in this area — have there been break-ins, vandalism, or insurance claims at this property in the last 3 years? What carrier currently insures it and at what premium?
- The area grade is low — what's the realistic commute time and amenity access for the typical tenant pool here? Any planned neighborhood developments (good or bad) we should know about?
- What's the average days-on-market for RENTAL listings here right now (not sales)? A rising rental-DOM trend means longer vacancies and softer asking-rent achievability than the comps imply.
- What's the recent tenant-quality profile in this submarket — average credit score on applications, eviction rate, late-payment / NSF rate, and stable-employment percentage? A property-management company in the area should have these aggregated.
- How much new for-sale + rental construction is in the pipeline within 1–3 miles? Heavy new supply typically softens prices + rents 12–24 months out; constrained supply supports both.
Investment metrics
- 1% rule
- 0.81% ✗
- Cap rate
- 5.98%
- Cash-on-cash
- -1.12%
- DSCR
- 0.95
- GRM
- 10.3
CMA / ARV
- ARV (on-the-fly)
- $246,500
- Comps found
- 12
Show comp detail 12 sales within ~0.75 mi
| Address | Dist | Beds/Ba | Sqft | Sold | Price | $/sf | Match |
|---|---|---|---|---|---|---|---|
| 1605 27th Ave N | 0.29mi | 4/2.0 (+1) | 1,532 (+6%) | 1mo | $175,000 | $114 | 72 |
| 3867 Heritage Crest Dr | 0.68mi | 4/2.0 (+1) | 1,444 (-0%) | 1mo | $244,900 | $170 | 62 |
| 1220 26th Ave N | 0.15mi | 4/2.0 (+1) | 1,665 (+15%) | 2mo | $195,000 | $117 | 62 |
| 1313 22nd Ave N | 0.67mi | 3/2.0 | 1,500 (+3%) | 5mo | $145,000 | $97 | 58 |
| 3870 Heritage Crest Dr | 0.65mi | 4/2.0 (+1) | 1,497 (+3%) | 2mo | $262,400 | $175 | 57 |
| 1103 26th Ave N | 0.33mi | 3/1.5 | 1,232 (-15%) | 1mo | $175,900 | $143 | 57 |
| 3875 Heritage Crest Dr | 0.68mi | 4/2.0 (+1) | 1,497 (+3%) | 1mo | $266,750 | $178 | 57 |
| 1733 Faircrest Dr | 0.73mi | 3/2.0 | 1,528 (+5%) | 4mo | $110,000 | $72 | 54 |
| 105 Greenridge Ter | 0.70mi | 4/2.0 (+1) | 1,368 (-6%) | 2mo | $74,300 | $54 | 51 |
| 3855 Heritage Crest Dr | 0.68mi | 3/2.0 | 1,281 (-12%) | 1mo | $239,400 | $187 | 48 |
| 3874 Heritage Crest Dr | 0.65mi | 3/2.0 | 1,272 (-12%) | 3mo | $244,900 | $193 | 47 |
| 3871 Heritage Crest Dr | 0.68mi | 3/2.0 | 1,272 (-12%) | 1mo | $244,900 | $193 | 47 |
Match score weights: distance 35% · size 25% · config 20% · recency 20%. Top-matched comps best support the ARV.
Projected returns pro-forma
-0.6% appreciation · 1.6% rent growth · sell at horizon
- IRR
- -6.8%
- Equity multiple
- 0.70×
- Total profit
- $-14,888
- Equity at exit
- $45,627
- IRR
- -1.5%
- Equity multiple
- 0.86×
- Total profit
- $-6,995
- Equity at exit
- $50,861
Cash invested: $49,000 (down + closing). Projections, not guarantees.
Landlord ↔ Tenant lean methodology
- Overall (STATE)
- 90 Strongly Landlord-Friendly
- State Alabama
- 90 Strongly Landlord-Friendly · R+15
- County
- — inherits STATE
- City
- — inherits STATE
ZIP-level market 35023
- Home prices YoY
- -0.1%
- Rents YoY
- 1.6%
- Active inventory
- 250
- Price-to-rent
- 10.3×
Monthly cashflow live
- Estimated rent
- $1,414 high interval (Pro) →
- Mortgage (P&I)
- −$918
- Tax from tax record
- −$172 /mo · $2,066/yr
- Insurance
- −$73
- HOA
- −$0
- Vacancy / Maint / Mgmt
- −$297
- Net cashflow
- $-46
Break-even live
UW: 25.0% down · 7.5% · 30yr · 1.5% tax · 5.0% vac · 8.0% maint · 8.0% mgmt
Financing live
Cash to close
- Down payment
- $43,750
- Closing costs
- $5,250
- Reserves months
- —
- Total cash needed
- —
Loan-product check · same deal, 3 products live
Conventional
25% down · 7.5% · 30yr
- Down + closing
- —
- Monthly P&I
- —
- Monthly cashflow
- —
- DSCR
- —
- Eligible?
- —
Personal DTI + credit; lowest rate.
DSCR
20% down · 8.5% · 30yr
- Down + closing
- —
- Monthly P&I
- —
- Monthly cashflow
- —
- DSCR
- —
- Eligible?
- —
No personal income docs; deal must DSCR.
Hard money
10% down · 12.0% · 12mo
- Down + closing
- —
- Monthly P&I
- —
- Monthly cashflow
- —
- DSCR
- —
- Eligible?
- —
Short-term bridge; refi at stabilization.
Rent comps 18 comps
| Address | Beds | Baths | Sqft | Rent | $/sqft | DOM | Units | Dist |
|---|---|---|---|---|---|---|---|---|
| 1036 Rose Hill Cir Bessemer, AL | 3.0 | 2.0 | 1277 | $1,300 | $1.02 | 21d | 1 | 0.22mi |
| 1623 26th Ave N Bessemer, AL | 2.0 | 1.0 | 1004 | $1,095 | $1.09 | 11d | 1 | 0.34mi |
| 1032 26th Ave N Bessemer, AL | 3.0 | 1.0 | 1724 | $1,175 | $0.68 | 2d | 1 | 0.41mi |
| 1013 25th Ave N Bessemer, AL | 3.0 | 2.0 | 1144 | $1,546 | $1.35 | 15d | 1 | 0.49mi |
| 428 Willow Ln Bessemer, AL | 4.0 | 2.0 | 1375 | $1,620 | $1.18 | 14d | 1 | 0.55mi |
| 905 26th Ave N Bessemer, AL | 4.0 | 2.0 | 1218 | $1,200 | $0.99 | 1d | 1 | 0.59mi |
| 3447 Jeanne Ln Bessemer, AL | 3.0 | 2.0 | 1460 | $1,850 | $1.27 | 1d | 1 | 0.62mi |
| 1314 22nd Ave N Bessemer, AL | 3.0 | 1.0 | 1038 | $1,000 | $0.96 | 43d | 1 | 0.68mi |
| 2234 19th St N Bessemer, AL | 2.0 | 1.0 | 1106 | $975 | $0.88 | 43d | 1 | 0.74mi |
| 2129 13th St N Bessemer, AL | 4.0 | 1.0 | 1378 | $1,445 | $1.05 | 14d | 1 | 0.79mi |
| 1929 15th St N Bessemer, AL | 3.0 | 2.0 | 1140 | $1,250 | $1.10 | 19d | 1 | 0.87mi |
| 2028 13th St N Bessemer, AL | 3.0 | 2.0 | 1372 | $1,073 | $0.78 | 23d | 1 | 0.87mi |
| 3201 Circle Dr Bessemer, AL | 3.0 | 2.0 | 1531 | $1,750 | $1.14 | 1d | 1 | 0.90mi |
| 2109 29th Ave N Bessemer, AL | 4.0 | 2.0 | 1217 | $1,323 | $1.09 | 2d | 1 | 0.93mi |
| 116 Avalon Ave Bessemer, AL | 4.0 | 1.0 | 1207 | $1,200 | $0.99 | 43d | 1 | 1.01mi |
| 2822 Brooklane Dr Bessemer, AL | 2.0 | 1.0 | 975 | $1,000 | $1.03 | 43d | 1 | 1.32mi |
| 2832 Clyburne St Bessemer, AL | 3.0 | 2.0 | 1295 | $1,650 | $1.27 | 1d | 1 | 1.36mi |
| 531 Tinker St Bessemer, AL | 3.0 | 2.0 | 1766 | $2,450 | $1.39 | 10d | 1 | 1.39mi |
Listing history 23 events
-
2026-06-18days on market $175,000 Active 28 DOM
-
2026-06-17days on market $175,000 Active 27 DOM
-
2026-06-16days on market $175,000 Active 26 DOM
-
2026-06-15days on market $175,000 Active 25 DOM
-
2026-06-13days on market $175,000 Active 23 DOM
-
2026-06-10days on market $175,000 Active 20 DOM
-
2026-06-09days on market $175,000 Active 19 DOM
-
2026-06-08days on market $175,000 Active 18 DOM
-
2026-06-07days on market $175,000 Active 17 DOM
-
2026-06-03days on market $175,000 Active 13 DOM
-
2026-06-02days on market $175,000 Active 12 DOM
-
2026-06-01days on market $175,000 Active 11 DOM
-
2026-05-31days on market $175,000 Active 10 DOM
-
2026-05-21$175,000 Active
-
2026-03-08historical $1,386
-
2026-03-06price $1,386
-
2026-03-05$1,359
-
2020-05-08soldstatus $110,000
-
2020-04-30soldstatus $110,000 Sold 428-char remark
Show marketing remark (428 chars)
Check out this 4-sided brick home with tons of natural light and plenty of storage. This three bedroom two bath home has a large master walk-in closet. Newly refinished hardwood flooring in the living, dining, hallway and bedrooms. The large sunroom overlooks a level partial fenced back yard and the basement garage has space for a workshop and storage. Plenty of extra off road parking!! Schedule your private showing today!!!
-
2020-04-02historical Contingent 428-char remark
Show marketing remark (428 chars)
Check out this 4-sided brick home with tons of natural light and plenty of storage. This three bedroom two bath home has a large master walk-in closet. Newly refinished hardwood flooring in the living, dining, hallway and bedrooms. The large sunroom overlooks a level partial fenced back yard and the basement garage has space for a workshop and storage. Plenty of extra off road parking!! Schedule your private showing today!!!
-
2020-04-01$119,900 Active 428-char remark
Show marketing remark (428 chars)
Check out this 4-sided brick home with tons of natural light and plenty of storage. This three bedroom two bath home has a large master walk-in closet. Newly refinished hardwood flooring in the living, dining, hallway and bedrooms. The large sunroom overlooks a level partial fenced back yard and the basement garage has space for a workshop and storage. Plenty of extra off road parking!! Schedule your private showing today!!!
-
1996-01-08soldstatus $82,900
-
1995-12-29soldstatus $82,900
ⓘ Source: listings_history table (triggers on properties + properties_extension) + one-shot
backfill from property_details.listing_events for pre-trigger history.
Tax reassessment forecast AL · Resets to sale price
- Current annual tax
- $2,066 · $172/mo
- Projected year-2 tax
- $2,066 · $172/mo
- Expected delta
- $0/yr ($0/mo · 0.0%)
ⓘ Screening estimate from a state-policy table — verify with the county assessor before closing.
Climate risk First Street
- Flood 1/10 Low FEMA zone X (unshaded) · 0% chance over 30 yrs
- Wildfire 3/10 Moderate
- Heat 6/10 Major 7 d/yr ≥109°F today · 19 d/yr by 30 yrs out
- Wind 6/10 Major 46% chance of damaging wind over 30 yrs
- Air quality 3/10 Moderate 2 unhealthy d/yr today · 5 by 30 yrs out
Nearby sold comps map
Loading sold comps map…
Walkable amenities ~0.75 mi
Loading nearby amenities…
Taxation est. · year 1
- Rental income
- $16,966
- − Mortgage interest
- −$9,803
- − Property taxes
- −$2,066
- − Insurance
- −$875
- − Repairs & maintenance
- −$1,357
- − Management
- −$1,357
- − Depreciation
- −$5,091
- Taxable loss
- −$3,583
- Est. tax savings @ 24.0%
- +$860
- After-tax cash flow
- $310/yr
For passive investors: Depreciation is non-cash, so a rental often shows a tax loss while cash-flowing — sheltering income. Rental losses are passive: they offset passive income freely, and up to $25,000/yr can offset ordinary (W-2) income if you actively participate and your MAGI is under $100k (phasing out to $0 by $150k); unused losses carry forward. On sale, claimed depreciation is recaptured at up to 25%, and gains may owe capital-gains tax (a 1031 exchange can defer both). Figures are a year-1 estimate at your 24.0% rate — not tax advice; consult a CPA.
Schools (NCES district)
- District
- Jefferson County
- NCES district ID
- 0101920
- Math proficiency
- 9% ▼ -24.00%
- Reading proficiency
- 32% ▼ -5.00%
- Median HH income
- $51,712
- Composite
- 18.4/100
- National rank
- #8937
- State rank
- #104 of 129 in AL
Livability — Hueytown
- Score
- 57/100
- State rank
- #378
- US rank
- #21611
Category grades
Schools grade is shown separately in the Schools card above.
Census & demographics
- Census place
- Hueytown, AL
- County
- Jefferson County · 527,445 people
- Metro
- Birmingham-Hoover, AL
- Population (ZIP)
- 25,533
- Household income
- $69,863
- Rent vs Own
- Severe rent burden
- 247.0
Population outlook (Jefferson County) Hauer SSP2
- Today (2025)
- 669,185 people
- By 2030
- 669,694 · +0.1%
- By 2040
- 661,388 · -1.2%
- By 2050
- 643,086 · -3.9%
- By 2075
- 577,267 · -13.7%
- By 2100
- 474,758 · -29.1%
Race, ethnicity, and origin ACS 2023
- Neighborhood character
- Diverse neighborhood (Simpson 0.56)
- Race & ethnicity
- White 58% Black 30% Hispanic / Latino 7% Two or more races 3%
- Hispanic origin (detail)
- Mexican 5%
- Common ancestry
- Slovak 1% Lithuanian 1% Serbian 1%
- Foreign-born
- 4% · Canada
- Languages at home
- 93% English-only · Spanish 7%
Political lean MEDSL · Jefferson
- 2024 margin
- D (+10.4) · D 54.6% · R 44.2% · Other 1.2%
- 2008→2024 swing
- +5.4pp toward D · 2008: 5.1pp · 2024: 10.4pp
- All cycles
- 2024: D+10.4 2020: D+13.2 2016: D+7.2 2012: D+6.0 2008: D+5.1
Not yet ingested
- Civics
- —
Market trends
- HPI YoY
- ▼ -0.60%
- Current HPI
- 389.38
- Rent YoY
- ▲ 1.60%
- Metro
- Birmingham-Hoover, AL
- State GDP YoY
- ▲ 2.94%
- F500 in state
- 4
Industry mix (Fortune 500 HQ in AL)
| Industry | F500 HQs | Revenue |
|---|---|---|
| Financial Services | 1 | $8B |
|
||
| Healthcare | 1 | $5B |
|
||
Price history
+111.1% since first listed10 events — show timeline
- 2026-05-21 Listed $175,000 Greater Alabama MLS
- 2026-03-08 Rental Removed $1,386 RENTLY
- 2026-03-06 Price Changed $1,386 RENTLY
- 2026-03-05 Listed for Rent $1,359 RENTLY
- 2020-05-08 Sold (Public Records) $110,000 Public Records
- 2020-04-30 Sold (MLS) $110,000 Greater Alabama MLS
- 2020-04-02 Contingent — Greater Alabama MLS
- 2020-04-01 Listed $119,900 Greater Alabama MLS
- 1996-01-08 Sold (Public Records) $82,900 Public Records
- 1995-12-29 Sold (Public Records) $82,900 Public Records
Property tax history
+9.8%/yrLatest (2025): $2,066 · -16.9% YoY. Source: county tax records.
Cash-flow waterfall
monthlySold comps — $/sqft
last 12 mo · ≤1 miLoading sold comps…