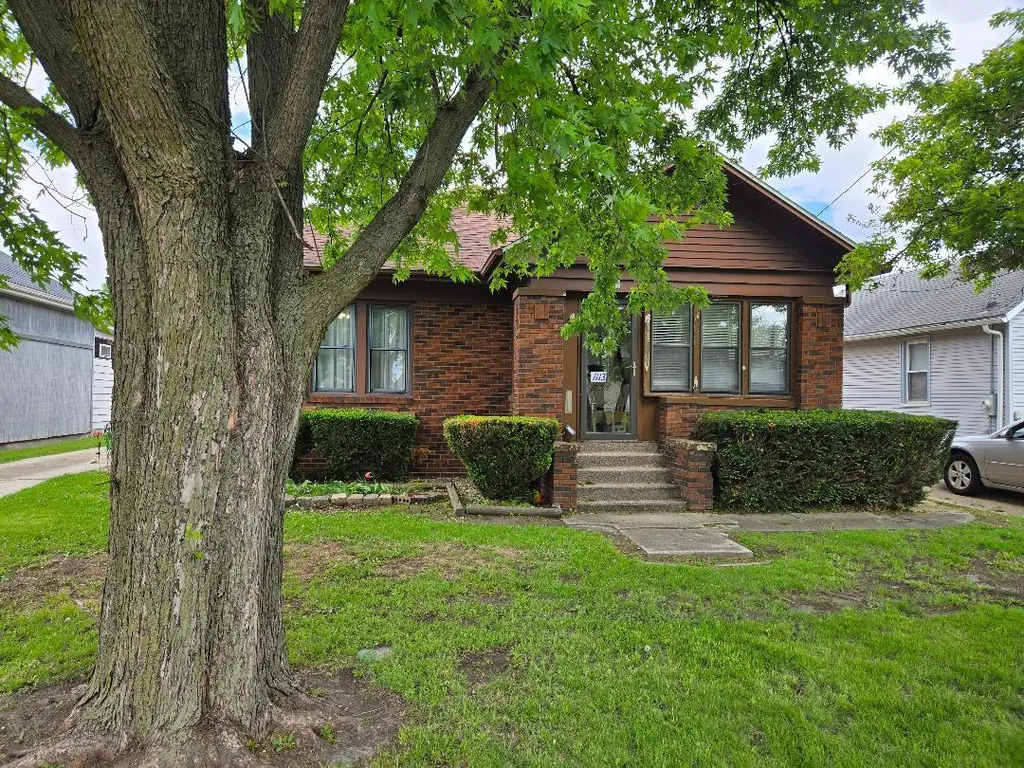
1113 Johnson St · Streator, IL
Flood risk 1/10 · Minimal
- FEMA flood zone
- X (unshaded)
- Chance of flooding over 30 yrs
- 0.0%
- Est. flood insurance / yr
- $473 – $860
Fire risk 1/10 · Minimal
- Est. fire insurance / yr
- $804 – $1,492
Heat risk 3/10 · Minor
- Hot days now (above 104°F)
- 7 days/yr
- Hot days in 30 yrs
- 17 days/yr
Wind risk 2/10 · Minimal
- Chance of severe wind over 30 yrs
- 1.0%
Air-quality risk 2/10 · Minimal
- Unhealthy air days now
- 1 days/yr
- Unhealthy air days in 30 yrs
- 1 days/yr
Risk factors via First Street. Map © Google.
Why this score? — see what drove the C+ grade
The composite is a weighted blend of 9 inputs, each scored 0–100. Each bar is that input's sub-score; the figure is the points it added to the 100-point composite (weight × sub-score).
- Cash flow +25.8/30.0
- ARV discount +11.0/15.0
- DSCR +8.6/10.0
- 1% rule +5.8/10.0
- Livability +3.2/5.0
- Rent growth +2.5/5.0
- Condition / age +2.5/5.0
- Schools +1.3/10.0
- Appreciation +0.0/10.0
$138,000
🖨 Deal sheet 📄 Offer letter ✓ Due diligence
Listing remarks
Adorable brick bungalow for sale! This 2 bed 1 bath home has plenty of room with so much potential. This well priced home has a nice large kitchen with a breakfast bar, a full dining room with lots of sunlight, a cozy living room with an extended area that can be used as a playroom or office and so much more! The outside is adorable with a garage, car- port and nice sitting area for those summer get together and barbeques! Plus all the major things have been done. Roof is only 8 years old, furnace less than 10 years old, A/C 6 years old, new hot water heater last year. Plus refrigerator, oven, washer and dryer all stay! Move right in and make it your own!
Key facts
- Brick bungalow
- Cozy living room
- Large kitchen
Tags
Property features AI
Finance
- Other: Living area source: Appraiser; Parcel number available
- Financial info: Tax exemptions: Homeowner, Senior
- HOA & community: No master association fee required
Exterior
- Parking: Detached garage (garage owned) with garage door opener; Carport; Concrete parking; Total 1 parking space / 1 garage space
- Security: CO detectors; Ceiling fan(s)
- Utilities: Public water; Public sewer; Electric with fuses
- Home design: Detached single-family home; One-story; Fee simple ownership; Built more than 100 years ago; Built before 1978
- Construction: Brick construction; Asphalt roof; Age: 100+ years
- Exterior features: Patio; Lot approximately 50 x 152 (less than 0.25 acre)
Interior
- Kitchen: Range; Dishwasher; Refrigerator; Eating area / breakfast bar
- Bedrooms: Main-level master bedroom (12 x 10); Main-level second bedroom (12 x 10); Office on main level (12 x 12); Enclosed porch on main level (14 x 9)
- Flooring: Hardwood; Carpet; Linoleum; Vinyl
- Bathrooms: 1 full bathroom
- Heating & cooling: Natural gas heating; Central air
- Interior features: First-floor bedroom; Separate dining room; Unfinished full basement; 6 total rooms
- Laundry & utility: Main-level laundry (9 x 8); Washer; Dryer
Neighborhood map
What this means for you Summary
Snapshot
- This is a 2-bed/1.0-bath single-family listed at $138k.
Deal economics
- At list price, monthly cash flow is $334 ($4k/yr) — positive.
- The deal already cash-flows at list — no discount required.
- Meets the 1% rule at list price ($1k rent vs $138k).
- Recommended offer: $134k (3.0% below list) — sets the bar for market timing.
Location & tenants
- Location reads 63/100 on livability (#752 in IL) — a middle-class / working-renter tenant base. Strengths: cost of living A+, health & safety A+, housing B+; Watch: schools F, amenities F, commute F.
- Streator Twp Hsd 40 (town): math 11% / reading 19% proficiency, ranked #513 of 620 in IL (top 83%) — low school quality limits family demand, transient renter base, plan for 1-2y turnover.
- Market conditions: 87 active listings in the ZIP; 4 comparable units currently listed for rent nearby; rentals at typical pace (median 22d on market — plan ~3-4 weeks tenant-placement turnaround); 82 units permitted in LaSalle County in 2024 (0 in 5+ unit buildings).
- This rent runs 30% of the median local income ($59k/yr) — at the standard rent-burdened threshold; future hikes will face affordability resistance.
Forward outlook
- Local home prices are declining (-3.0%/yr); year-one equity from $954 of loan paydown is wiped out by about $4k of value loss. Plan a longer hold.
- LaSalle County population projected at -16% by 2050 — secular population decline; favor cash flow + early exit over multi-decade hold.
Negotiation context
- It's been on market 48 days — a 3% lower offer ($134k) is reasonable based on typical stale-listing flexibility.
- Current owner paid $64k; list at $138k implies a 117% gain — meaningful room to come down on a strong offer.
Risks & watch-outs
- Watch-outs: built in 1924 — expect roof / HVAC / electrical / plumbing capex.
Questions for the listing agent
- It's been on market 48 days. Have you received any prior offers? Is the seller open to a 3% concession, seller financing, or rate buy-down credit?
- Built in 1924 — when were the roof, HVAC, electrical panel, plumbing, and water heater last replaced?
- Is there a deadline driving the sale (1031 exchange, divorce, estate, relocation)? That informs how much negotiation room exists.
- Schools are F-rated, which usually means shorter tenancies and higher turnover. Who's the typical renter profile here, and what's been the actual vacancy rate?
- What's the average days-on-market for RENTAL listings here right now (not sales)? A rising rental-DOM trend means longer vacancies and softer asking-rent achievability than the comps imply.
- What's the recent tenant-quality profile in this submarket — average credit score on applications, eviction rate, late-payment / NSF rate, and stable-employment percentage? A property-management company in the area should have these aggregated.
- How much new for-sale + rental construction is in the pipeline within 1–3 miles? Heavy new supply typically softens prices + rents 12–24 months out; constrained supply supports both.
Investment metrics
- 1% rule
- 1.08% ✓
- Cap rate
- 9.19%
- Cash-on-cash
- 10.36%
- DSCR
- 1.46
- GRM
- 7.7
CMA / ARV
- ARV (on-the-fly)
- $149,520
- Comps found
- 12
Show comp detail 12 sales within ~0.75 mi
| Address | Dist | Beds/Ba | Sqft | Sold | Price | $/sf | Match |
|---|---|---|---|---|---|---|---|
| 1500 Manhattan Dr | 0.33mi | 3/1.5 (+1) | 1,424 (0%) | 4mo | $150,000 | $105 | 74 |
| 914 Laura Ave | 0.36mi | 3/1.5 (+1) | 1,498 (+5%) | 11mo | $225,000 | $150 | 59 |
| 713 Fuller Ave | 0.59mi | 3/1.0 (+1) | 1,404 (-1%) | 8mo | $148,000 | $105 | 58 |
| 1605 Sharon Rd | 0.45mi | 3/2.0 (+1) | 1,512 (+6%) | 4mo | $150,000 | $99 | 57 |
| 95 Manhattan Dr | 0.30mi | 3/2.0 (+1) | 1,300 (-9%) | 9mo | $175,000 | $135 | 55 |
| 1010 Elliott St | 0.45mi | 3/2.0 (+1) | 1,232 (-14%) | 3mo | $105,000 | $85 | 45 |
| 703 Iowa Ave | 0.44mi | 3/1.5 (+1) | 1,215 (-15%) | 4mo | $148,000 | $122 | 45 |
| 616 N Everett St | 0.64mi | 3/2.0 (+1) | 1,314 (-8%) | 7mo | $149,000 | $113 | 42 |
| 307 E Bronson St | 0.70mi | 2/1.0 | 1,236 (-13%) | 4mo | $5,000 | $4 | 42 |
| 210 N Colorado Ave | 0.74mi | 3/1.5 (+1) | 1,340 (-6%) | 10mo | $87,000 | $65 | 40 |
| 701 Fuller Ave | 0.64mi | 1/1.0 (-1) | 1,220 (-14%) | 8mo | $62,000 | $51 | 34 |
| 904 N Vermillion St | 0.71mi | 3/1.5 (+1) | 1,240 (-13%) | 6mo | $155,000 | $125 | 33 |
Match score weights: distance 35% · size 25% · config 20% · recency 20%. Top-matched comps best support the ARV.
Projected returns pro-forma
-3.0% appreciation · 3.0% rent growth · sell at horizon
- IRR
- -0.8%
- Equity multiple
- 0.97×
- Total profit
- $-1,156
- Equity at exit
- $20,576
- IRR
- 8.9%
- Equity multiple
- 1.68×
- Total profit
- $26,173
- Equity at exit
- $11,932
Cash invested: $38,640 (down + closing). Projections, not guarantees.
Landlord ↔ Tenant lean methodology
- Overall (STATE)
- 43 Moderately Tenant-Leaning
- State Illinois
- 43 Moderately Tenant-Leaning · D+7
- County
- — inherits STATE
- City
- — inherits STATE
ZIP-level market 61364
- Home prices YoY
- -31.1%
- Active inventory
- 87
- Price-to-rent
- 7.7×
Monthly cashflow live
- Estimated rent
- $1,490 medium interval (Pro) →
- Mortgage (P&I)
- −$724
- Tax from tax record
- −$62 /mo · $749/yr
- Insurance
- −$58
- HOA
- −$0
- Vacancy / Maint / Mgmt
- −$313
- Net cashflow
- $334
Break-even live
UW: 25.0% down · 7.5% · 30yr · 1.5% tax · 5.0% vac · 8.0% maint · 8.0% mgmt
Financing live
Cash to close
- Down payment
- $34,500
- Closing costs
- $4,140
- Reserves months
- —
- Total cash needed
- —
Loan-product check · same deal, 3 products live
Conventional
25% down · 7.5% · 30yr
- Down + closing
- —
- Monthly P&I
- —
- Monthly cashflow
- —
- DSCR
- —
- Eligible?
- —
Personal DTI + credit; lowest rate.
DSCR
20% down · 8.5% · 30yr
- Down + closing
- —
- Monthly P&I
- —
- Monthly cashflow
- —
- DSCR
- —
- Eligible?
- —
No personal income docs; deal must DSCR.
Hard money
10% down · 12.0% · 12mo
- Down + closing
- —
- Monthly P&I
- —
- Monthly cashflow
- —
- DSCR
- —
- Eligible?
- —
Short-term bridge; refi at stabilization.
Rent comps 4 comps
| Address | Beds | Baths | Sqft | Rent | $/sqft | DOM | Units | Dist |
|---|---|---|---|---|---|---|---|---|
| 1409 Kelly St Streator, IL | 3.0 | 1.0 | 1280 | $1,750 | $1.37 | 7d | 1 | 1.14mi |
| 402 S Illinois St Streator, IL | 2.0 | 1.0 | 1116 | $1,550 | $1.39 | 22d | 1 | 1.17mi |
| 514 Lundy St Streator, IL | 3.0 | 1.0 | 1174 | $1,700 | $1.45 | 3d | 1 | 1.30mi |
| 503 S Bloomington St Streator, IL | 3.0 | 1.0 | 1200 | $1,500 | $1.25 | 24d | 1 | 1.50mi |
Listing history 19 events
-
2026-06-19days on market $138,000 Active 48 DOM
-
2026-06-18days on market $138,000 Active 47 DOM
-
2026-06-17days on market $138,000 Active 46 DOM
-
2026-06-16days on market $138,000 Active 45 DOM
-
2026-06-15days on market $138,000 Active 44 DOM
-
2026-06-14days on market $138,000 Active 42 DOM
-
2026-06-12days on market $138,000 Active 41 DOM
-
2026-06-09days on market $138,000 Active 38 DOM
-
2026-06-08days on market $138,000 Active 37 DOM
-
2026-06-07days on market $138,000 Active 36 DOM
-
2026-06-05days on market $138,000 Active 33 DOM
-
2026-06-03days on market $138,000 Active 32 DOM
-
2026-06-02days on market $138,000 Active 31 DOM
-
2026-06-01days on market $138,000 Active 30 DOM
-
2026-05-31days on market $138,000 Active 29 DOM
-
2026-05-30days on market $138,000 Active 28 DOM
-
2026-05-23price $138,000
-
2026-05-02$140,000 Active
-
2000-09-26soldstatus $63,500
ⓘ Source: listings_history table (triggers on properties + properties_extension) + one-shot
backfill from property_details.listing_events for pre-trigger history.
Tax reassessment forecast IL · Partial reset (capped growth)
- Current annual tax
- $749 · $62/mo
- Projected year-2 tax
- $1,941 · $162/mo
- Expected delta
- +$1,192/yr (+$99/mo · 159.2%)
ⓘ Screening estimate from a state-policy table — verify with the county assessor before closing.
Climate risk First Street
- Flood 1/10 Low FEMA zone X (unshaded) · 0% chance over 30 yrs
- Wildfire 1/10 Low
- Heat 3/10 Moderate 7 d/yr ≥104°F today · 17 d/yr by 30 yrs out
- Wind 2/10 Low 100% chance of damaging wind over 30 yrs
- Air quality 2/10 Low 1 unhealthy d/yr today · 1 by 30 yrs out
Nearby sold comps map
Loading sold comps map…
Walkable amenities ~0.75 mi
Loading nearby amenities…
Taxation est. · year 1
- Rental income
- $17,882
- − Mortgage interest
- −$7,730
- − Property taxes
- −$749
- − Insurance
- −$690
- − Repairs & maintenance
- −$1,431
- − Management
- −$1,431
- − Depreciation
- −$4,015
- Taxable income
- $1,838
- Est. tax owed @ 24.0%
- −$441
- After-tax cash flow
- $3,563/yr
For passive investors: Depreciation is non-cash, so a rental often shows a tax loss while cash-flowing — sheltering income. Rental losses are passive: they offset passive income freely, and up to $25,000/yr can offset ordinary (W-2) income if you actively participate and your MAGI is under $100k (phasing out to $0 by $150k); unused losses carry forward. On sale, claimed depreciation is recaptured at up to 25%, and gains may owe capital-gains tax (a 1031 exchange can defer both). Figures are a year-1 estimate at your 24.0% rate — not tax advice; consult a CPA.
Schools (NCES district)
- District
- Streator Twp Hsd 40
- NCES district ID
- 1738100
- Math proficiency
- 11% ▼ -4.00%
- Reading proficiency
- 19% ▼ -1.00%
- Median HH income
- $43,002
- Composite
- 13.07/100
- National rank
- #9561
- State rank
- #513 of 620 in IL
Livability — Streator
- Score
- 63/100
- State rank
- #752
- US rank
- #15266
Category grades
Schools grade is shown separately in the Schools card above.
Census & demographics
- Census place
- Streator, IL
- County
- La Salle County · 41,676 people
- City population
- 17,963
- Metro
- Ottawa, IL
- Population (ZIP)
- 17,963
- Household income
- $59,060
- Rent vs Own
- Severe rent burden
- 450.0
Population outlook (LaSalle County) Hauer SSP2
- Today (2025)
- 107,080 people
- By 2030
- 104,196 · -2.7%
- By 2040
- 97,413 · -9.0%
- By 2050
- 90,294 · -15.7%
- By 2075
- 76,252 · -28.8%
- By 2100
- 61,339 · -42.7%
Race, ethnicity, and origin ACS 2023
- Neighborhood character
- Predominantly White (83%)
- Race & ethnicity
- White 83% Hispanic / Latino 11% Two or more races 4% Black 3%
- Hispanic origin (detail)
- Mexican 10%
- Common ancestry
- Romanian 3% Lithuanian 2% Slovak 2%
- Foreign-born
- 3% · Canada
- Languages at home
- 93% English-only · Spanish 6%
Political lean MEDSL · LaSalle
- 2024 margin
- R (+18.5) · D 40.1% · R 58.6% · Other 1.3%
- 2008→2024 swing
- -29.6pp toward R · 2008: 11.1pp · 2024: -18.5pp
- All cycles
- 2024: R+18.5 2020: R+14.3 2016: R+14.4 2012: R+0.4 2008: D+11.1
Not yet ingested
- Civics
- —
Market trends
- HPI YoY
- ▼ -105.28%
- Current HPI
- 233.5533
- Rent YoY
- —
- Metro
- Ottawa, IL
- State GDP YoY
- ▲ 1.59%
- F500 in state
- 60
Industry mix (Fortune 500 HQ in IL)
| Industry | F500 HQs | Revenue |
|---|---|---|
| Insurance | 4 | $201B |
|
||
| Consumer Goods | 4 | $87B |
|
||
| Industrial Machinery | 3 | $64B |
|
||
| Healthcare | 2 | $55B |
|
||
| Retail / Pharmacy | 1 | $148B |
|
||
| Agriculture / Food | 1 | $86B |
|
||
Price history
+117.3% since first listed3 events — show timeline
- 2026-05-23 Price Changed $138,000 MRED as Distributed by MLS Grid
- 2026-05-02 Listed $140,000 MRED as Distributed by MLS Grid
- 2000-09-26 Sold (Public Records) $63,500 Public Records
Property tax history
-4.1%/yrLatest (2024): $749 · -59.4% YoY. Source: county tax records.
Cash-flow waterfall
monthlySold comps — $/sqft
last 12 mo · ≤1 miLoading sold comps…