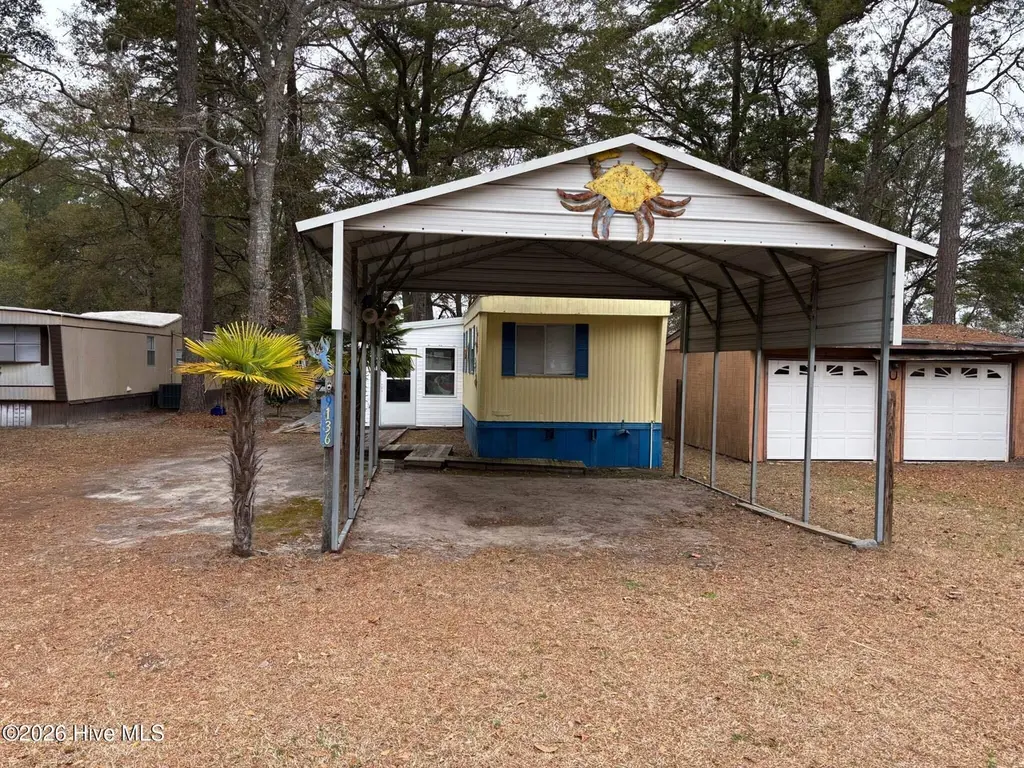
9136 E Calabash Dr SW · Calabash, NC
Flood risk 1/10 · Minimal
- FEMA flood zone
- X (unshaded)
- Chance of flooding over 30 yrs
- 0.0%
- Est. flood insurance / yr
- $507 – $1,088
Fire risk 4/10 · Minor
- Est. fire insurance / yr
- $906 – $1,684
Heat risk 9/10 · Severe
- Hot days now (above 104°F)
- 7 days/yr
- Hot days in 30 yrs
- 18 days/yr
Wind risk 8/10 · Major
- Chance of severe wind over 30 yrs
- 99.0%
Air-quality risk 2/10 · Minimal
- Unhealthy air days now
- 1 days/yr
- Unhealthy air days in 30 yrs
- 1 days/yr
Risk factors via First Street. Map © Google.
Why this score? — see what drove the C+ grade
The composite is a weighted blend of 9 inputs, each scored 0–100. Each bar is that input's sub-score; the figure is the points it added to the 100-point composite (weight × sub-score).
- Cash flow +26.4/30.0
- ARV discount +9.9/15.0
- DSCR +9.0/10.0
- 1% rule +7.2/10.0
- Schools +3.9/10.0
- Livability +3.1/5.0
- Rent growth +2.5/5.0
- Condition / age +2.5/5.0
- Appreciation +0.0/10.0
$159,900
🖨 Deal sheet 📄 Offer letter ✓ Due diligence
Listing remarks
Own your own slice of paradise just minutes from the water. This beautifully maintained 2-bedroom, 1-bath beach home offers comfort, convenience, and an unbeatable location. Prime Location: Lot located directly across from the community pool 2.5 miles to the nearest boat ramp 4 miles to Sunset Beach access and fishing pier Less than 1 mile to Calabash city limits - dining and shopping 4 miles to Little River, SC - casino boats and commercial fishing 6 miles to North Myrtle Beach Minutes to golf courses including Sea Trail and Ocean Ridge Community Perks: Golf carts allowed throughout the neighborhood Pool, tennis courts, playground, and clubhouse Low HOA - only $250 per year Pri
Key facts
- Fishing pier
- Community pool
- Sunset beach access
Tags
Property features AI
Finance
- Other: Zoning: Ca-Mfh-Ii; Subdivision: Bonaparte Retreat
- HOA & community: Homeowners association with annual fee of $250 (about $20.83/month)
Exterior
- Parking: Carport with 2 spaces; Off-street parking
- Utilities: Water connected
- Home design: Manufactured home; Single-story (one level); Entry at level 1
- Construction: Metal siding and frame construction; Metal roof; Foundation details: see remarks
- Exterior features: Deck; Has a view; Paved road access
Interior
- Bedrooms: Total of 4 rooms (bedrooms/rooms count included in room total)
- Bathrooms: 1 full bathroom
- Heating & cooling: Has heating (type: Other); Has cooling (type: Other)
- Interior features: See remarks (additional interior details in listing remarks)
Neighborhood map
What this means for you Summary
Snapshot
- This is a 2-bed/1.0-bath manufactured listed at $160k.
Deal economics
- At list price, monthly cash flow is $417 ($5k/yr) — positive.
- The deal already cash-flows at list — no discount required.
- Meets the 1% rule at list price ($2k rent vs $160k).
- Recommended offer: $150k (6.0% below list) — sets the bar for market timing.
- Cap rate 9.4% vs local median 4.1% in Calabash — top-decile yield for the area; either an underpriced asset or a hidden risk that comps aren't pricing in. Stress-test before assuming the spread holds.
Location & tenants
- Location reads 61/100 on livability (#487 in NC) — a middle-class / working-renter tenant base. Strengths: cost of living A+, housing A+, crime A; Watch: health & safety D, amenities F, commute F.
- Brunswick County Schools (rural): math 45% / reading 47% proficiency, ranked #82 of 178 in NC (top 46%) — families likely to look elsewhere, expect single-tenant / working-renter base with shorter leases.
- Zoned schools: Jessie Mae Monroe Elementary (math 43% / reading 41%, grade F, #633 of 1,410 statewide, top 48%, 394 students, 99% FRL); Shallotte Middle (math 40% / reading 50%, grade D, #160 of 475 statewide, top 35%, 674 students, 100% FRL); West Brunswick High (math 50% / reading 56%, grade C-, #281 of 535 statewide, top 53%, 1,526 students, 100% FRL) — zoned schools average 100% FRL vs 53% district-wide (46 pts higher); higher-poverty schools than district average — tighter screening recommended.
- Market conditions: 691 active listings in the ZIP; 2 comparable units currently listed for rent nearby; solid renter incomes; 6,112 units permitted in Brunswick County in 2024 (990 in 5+ unit buildings).
- This rent runs 31% of the median local income ($75k/yr) — at the standard rent-burdened threshold; future hikes will face affordability resistance.
Forward outlook
- Local home prices are declining (-3.0%/yr); year-one equity from $1k of loan paydown is wiped out by about $5k of value loss. Plan a longer hold.
- Brunswick County population projected at +36% by 2050 — long-run rental-demand tailwind backs the buy-and-hold thesis.
- At projected returns (-3.0% appreciation + 3.0% rent growth), your $45k cash investment doubles in ~10 years — after that, you're playing with house money.
Negotiation context
- It's been on market 85 days — a 6% lower offer ($150k) is reasonable based on typical stale-listing flexibility.
- 2 sale attempts since 23y ago with the ask held roughly flat each time — persistent listings suggest the price (not the market) is what's stuck; bring a comps-based counter.
- Current owner paid $38k; list at $160k implies a 321% gain — meaningful room to come down on a strong offer.
Risks & watch-outs
- Climate carrying-cost: severe wind risk, 99% chance of damaging wind over 30y; extreme-heat days projected 7→18/yr by 2055 (HVAC capex compounding) — expect insurance premiums to compound above CPI over the hold.
Questions for the listing agent
- It's been on market 85 days. Have you received any prior offers? Is the seller open to a 6% concession, seller financing, or rate buy-down credit?
- What does the HOA fee cover, when was the last increase, and are there any pending special assessments or reserve-fund shortfalls?
- Why hasn't it sold? Are there any deal-killer items the seller is aware of (foundation, flood, title, zoning, code violations)?
- Is there a deadline driving the sale (1031 exchange, divorce, estate, relocation)? That informs how much negotiation room exists.
- Schools are F-rated, which usually means shorter tenancies and higher turnover. Who's the typical renter profile here, and what's been the actual vacancy rate?
- What's the average days-on-market for RENTAL listings here right now (not sales)? A rising rental-DOM trend means longer vacancies and softer asking-rent achievability than the comps imply.
- What's the recent tenant-quality profile in this submarket — average credit score on applications, eviction rate, late-payment / NSF rate, and stable-employment percentage? A property-management company in the area should have these aggregated.
- How much new for-sale + rental construction is in the pipeline within 1–3 miles? Heavy new supply typically softens prices + rents 12–24 months out; constrained supply supports both.
Investment metrics
- 1% rule
- 1.22% ✓
- Cap rate
- 9.42%
- Cash-on-cash
- 11.16%
- DSCR
- 1.50
- GRM
- 6.8
CMA / ARV
- ARV (on-the-fly)
- $168,888
- Comps found
- 2
Show comp detail 2 sales within ~0.75 mi
| Address | Dist | Beds/Ba | Sqft | Sold | Price | $/sf | Match |
|---|---|---|---|---|---|---|---|
| 9053 Townview Pl SW | 0.27mi | 2/1.0 | 770 (+4%) | 9mo | $115,000 | $149 | 74 |
| 9040 Bonaparte Dr SW | 0.22mi | 2/2.0 | 701 (-6%) | 9mo | $159,225 | $227 | 68 |
Match score weights: distance 35% · size 25% · config 20% · recency 20%. Top-matched comps best support the ARV.
Projected returns pro-forma
-3.0% appreciation · 3.0% rent growth · sell at horizon
- IRR
- 0.4%
- Equity multiple
- 1.01×
- Total profit
- $663
- Equity at exit
- $23,842
- IRR
- 10.1%
- Equity multiple
- 1.78×
- Total profit
- $34,912
- Equity at exit
- $13,825
Cash invested: $44,772 (down + closing). Projections, not guarantees.
Landlord ↔ Tenant lean methodology
- Overall (STATE)
- 85 Strongly Landlord-Friendly
- State North Carolina
- 85 Strongly Landlord-Friendly · R+3
- County
- — inherits STATE
- City
- — inherits STATE
ZIP-level market 28467
- Home prices YoY
- -33.7%
- Active inventory
- 691
- Price-to-rent
- 6.8×
Monthly cashflow live
- Estimated rent
- $1,953 medium interval (Pro) →
- Mortgage (P&I)
- −$839
- Tax est. 1.5%
- −$200 /mo · $2,398/yr
- Insurance
- −$67
- HOA
- −$21
- Vacancy / Maint / Mgmt
- −$410
- Net cashflow
- $417
Break-even live
UW: 25.0% down · 7.5% · 30yr · 1.5% tax · 5.0% vac · 8.0% maint · 8.0% mgmt
Financing live
Cash to close
- Down payment
- $39,975
- Closing costs
- $4,797
- Reserves months
- —
- Total cash needed
- —
Loan-product check · same deal, 3 products live
Conventional
25% down · 7.5% · 30yr
- Down + closing
- —
- Monthly P&I
- —
- Monthly cashflow
- —
- DSCR
- —
- Eligible?
- —
Personal DTI + credit; lowest rate.
DSCR
20% down · 8.5% · 30yr
- Down + closing
- —
- Monthly P&I
- —
- Monthly cashflow
- —
- DSCR
- —
- Eligible?
- —
No personal income docs; deal must DSCR.
Hard money
10% down · 12.0% · 12mo
- Down + closing
- —
- Monthly P&I
- —
- Monthly cashflow
- —
- DSCR
- —
- Eligible?
- —
Short-term bridge; refi at stabilization.
Rent comps 2 comps
| Address | Beds | Baths | Sqft | Rent | $/sqft | DOM | Units | Dist |
|---|---|---|---|---|---|---|---|---|
| 660 Aubrey Ln Calabash, NC | 1.0–2.0 | 1.0–2.0 | 1081 | $2,870 | $2.65 | 13d | 69 | 1.11mi |
| 10174 Beach Dr SW #206 Calabash, NC | 1.0 | 1.0 | 650 | $1,050 | $1.62 | 23d | 1 | 1.48mi |
HOA detail
- Monthly dues
- $21 · $252/yr
- Likely covers
- waterpool
Listing history 20 events
-
2026-06-18days on market $159,900 Active 85 DOM
-
2026-06-17days on market $159,900 Active 84 DOM
-
2026-06-16days on market $159,900 Active 83 DOM
-
2026-06-15days on market $159,900 Active 82 DOM
-
2026-06-14days on market $159,900 Active 80 DOM
-
2026-06-13days on market $159,900 Active 79 DOM
-
2026-06-10days on market $159,900 Active 77 DOM
-
2026-06-09days on market $159,900 Active 76 DOM
-
2026-06-08days on market $159,900 Active 75 DOM
-
2026-06-07days on market $159,900 Active 74 DOM
-
2026-06-05days on market $159,900 Active 71 DOM
-
2026-06-03days on market $159,900 Active 70 DOM
-
2026-06-02days on market $159,900 Active 69 DOM
-
2026-06-01days on market $159,900 Active 68 DOM
-
2026-05-31days on market $159,900 Active 67 DOM
-
2026-05-30days on market $159,900 Active 66 DOM
-
2026-03-25$159,900 Active
-
2004-05-14soldstatus $38,000
-
2004-05-01soldstatus $38,000
-
2003-08-13$47,500
ⓘ Source: listings_history table (triggers on properties + properties_extension) + one-shot
backfill from property_details.listing_events for pre-trigger history.
Climate risk First Street
- Flood 1/10 Low FEMA zone X (unshaded) · 0% chance over 30 yrs
- Wildfire 4/10 Moderate
- Heat 9/10 Extreme 7 d/yr ≥104°F today · 18 d/yr by 30 yrs out
- Wind 8/10 Severe 99% chance of damaging wind over 30 yrs
- Air quality 2/10 Low 1 unhealthy d/yr today · 1 by 30 yrs out
Nearby sold comps map
Loading sold comps map…
Walkable amenities ~0.75 mi
Loading nearby amenities…
Taxation est. · year 1
- Rental income
- $23,432
- − Mortgage interest
- −$8,957
- − Property taxes
- −$2,398
- − Insurance
- −$800
- − Repairs & maintenance
- −$1,875
- − Management
- −$1,875
- − HOA
- −$252
- − Depreciation
- −$4,652
- Taxable income
- $2,624
- Est. tax owed @ 24.0%
- −$630
- After-tax cash flow
- $4,369/yr
For passive investors: Depreciation is non-cash, so a rental often shows a tax loss while cash-flowing — sheltering income. Rental losses are passive: they offset passive income freely, and up to $25,000/yr can offset ordinary (W-2) income if you actively participate and your MAGI is under $100k (phasing out to $0 by $150k); unused losses carry forward. On sale, claimed depreciation is recaptured at up to 25%, and gains may owe capital-gains tax (a 1031 exchange can defer both). Figures are a year-1 estimate at your 24.0% rate — not tax advice; consult a CPA.
Schools (NCES district)
- District
- Brunswick County Schools
- NCES district ID
- 3700420
- Math proficiency
- 45% ▲ 4.00%
- Reading proficiency
- 47% ▲ 4.00%
- Median HH income
- $47,494
- Composite
- 39.23/100
- National rank
- #4011
- State rank
- #82 of 178 in NC
Livability — Calabash
- Score
- 61/100
- State rank
- #487
- US rank
- #17866
Category grades
Schools grade is shown separately in the Schools card above.
Census & demographics
- Census place
- Calabash, NC
- County
- Brunswick County · 131,536 people
- Metro
- Myrtle Beach-Conway-North Myrtle Beach, SC-NC
- Population (ZIP)
- 13,313
- Household income
- $75,341
- Rent vs Own
- Severe rent burden
- 81.0
Population outlook (Brunswick County) Hauer SSP2
- Today (2025)
- 152,111 people
- By 2030
- 165,705 · +8.9%
- By 2040
- 188,494 · +23.9%
- By 2050
- 206,228 · +35.6%
- By 2075
- 237,876 · +56.4%
- By 2100
- 251,451 · +65.3%
Race, ethnicity, and origin ACS 2023
- Neighborhood character
- Predominantly White (90%)
- Race & ethnicity
- White 90% Two or more races 4% Black 3% Hispanic / Latino 2%
- Common ancestry
- Slovak 5% Romanian 5% Lithuanian 3%
- Foreign-born
- 3% · Canada
- Languages at home
- 98% English-only · Spanish 1%
Political lean MEDSL · Brunswick
- 2024 margin
- Strong R (+24.9) · D 37.2% · R 62.0%
- 2008→2024 swing
- -6.9pp toward R · 2008: -17.9pp · 2024: -24.9pp
- All cycles
- 2024: R+24.9 2020: R+25.0 2016: R+28.7 2012: R+22.2 2008: R+17.9
Not yet ingested
- Civics
- —
Market trends
- HPI YoY
- ▼ -67.90%
- Current HPI
- 133.7186
- Rent YoY
- —
- Metro
- Myrtle Beach-Conway-North Myrtle Beach, SC-NC
- State GDP YoY
- ▲ 3.28%
- F500 in state
- 26
Industry mix (Fortune 500 HQ in NC)
| Industry | F500 HQs | Revenue |
|---|---|---|
| Financial Services | 2 | $213B |
|
||
| Retail | 2 | $95B |
|
||
| Industrial Conglomerate | 1 | $38B |
|
||
| Metals / Steel | 1 | $35B |
|
||
| Utilities | 1 | $30B |
|
||
| Industrial Machinery | 1 | $19B |
|
||
Price history
+236.6% since first listed4 events — show timeline
- 2026-03-25 Listed $159,900 Hive MLS
- 2004-05-14 Sold (MLS) $38,000 Hive MLS
- 2004-05-01 Sold (Public Records) $38,000 Public Records
- 2003-08-13 Listed $47,500 Hive MLS
Property tax history
+0.7%/yrLatest (2025): $281 · +1.8% YoY. Source: county tax records.
Cash-flow waterfall
monthlySold comps — $/sqft
last 12 mo · ≤1 miLoading sold comps…