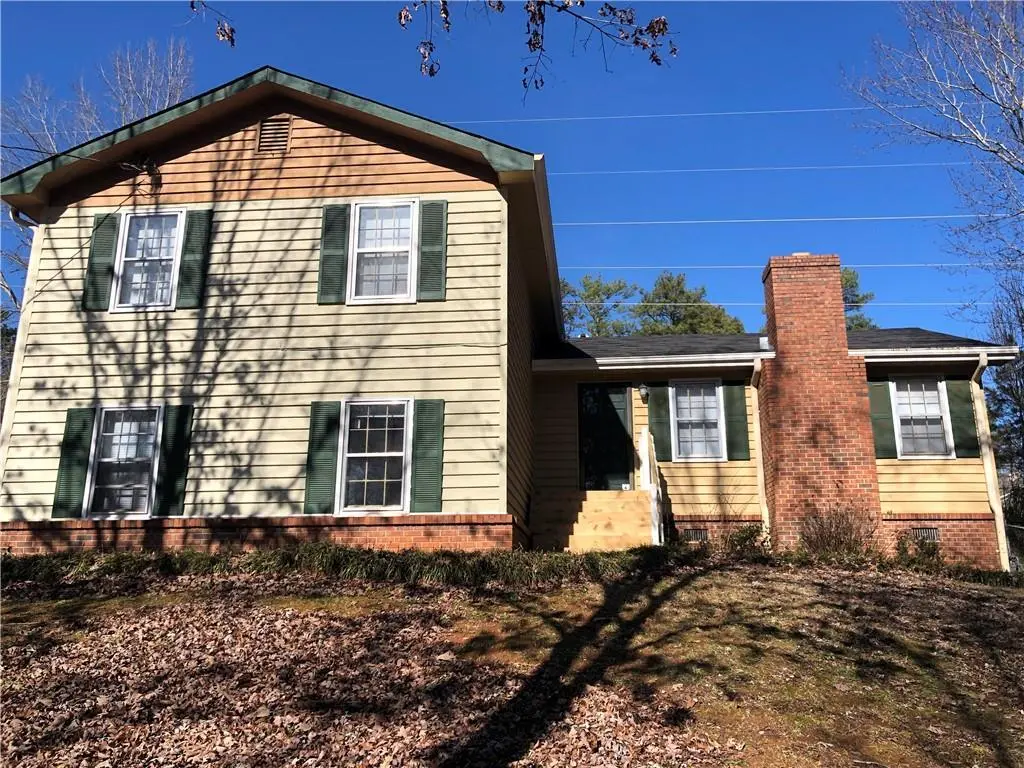
570 Pine Ridge Trl · Conyers, GA
Flood risk 1/10 · Minimal
- FEMA flood zone
- X (unshaded)
- Chance of flooding over 30 yrs
- 0.0%
- Est. flood insurance / yr
- $507 – $1,088
Fire risk 1/10 · Minimal
- Est. fire insurance / yr
- $963 – $1,789
Heat risk 6/10 · Moderate
- Hot days now (above 105°F)
- 7 days/yr
- Hot days in 30 yrs
- 18 days/yr
Wind risk 6/10 · Moderate
- Chance of severe wind over 30 yrs
- 27.0%
Air-quality risk 4/10 · Minor
- Unhealthy air days now
- 5 days/yr
- Unhealthy air days in 30 yrs
- 7 days/yr
Risk factors via First Street. Map © Google.
Why this score? — see what drove the D+ grade
The composite is a weighted blend of 9 inputs, each scored 0–100. Each bar is that input's sub-score; the figure is the points it added to the 100-point composite (weight × sub-score).
- ARV discount +14.9/15.0
- Cash flow +11.8/30.0
- 1% rule +4.0/10.0
- DSCR +3.5/10.0
- Rent growth +3.5/5.0
- Livability +3.4/5.0
- Condition / age +2.5/5.0
- Schools +1.9/10.0
- Appreciation +0.0/10.0
$219,000
🖨 Deal sheet 📄 Offer letter ✓ Due diligence
Listing remarks MLS
GREAT LOCATION! SOLD AS IS !CLOSE TO EVERYTHING! FIRESIDE FAMILY ROOM IS COZY & COMFORTABLE. QUIET TREE LINED STREET W/ PRIVATE BACKYARD. EXCELLENT SCHOOLS! SAFE & QUIET NEIGHBORHOOD! OPEN & SPACIOUS FLOORPLAN! A MUST SEE! CALL FOR DETAILS!
Key facts
- Excellent schools
- Private backyard
- Safe neighborhood
Tags
Neighborhood map
What this means for you Summary
Snapshot
- This is a 3-bed/2.5-bath single-family listed at $219k.
Deal economics
- At list price, monthly cash flow is $-62 ($-744/yr) — negative.
- To cash-flow at today's rent, offer at most $208k (5.0% below list).
- To meet the 1% rule (rent ≥ 1% of price), the offer needs to be $197k (10.2% below list).
- Recommended offer: $193k (12.0% below list) — sets the bar for market timing.
- Cap rate 6.0% vs local median 4.4% in Conyers — top-decile yield for the area; either an underpriced asset or a hidden risk that comps aren't pricing in. Stress-test before assuming the spread holds.
Location & tenants
- Location reads 67/100 on livability (#167 in GA) — a middle-class / working-renter tenant base. Strengths: cost of living A+, housing A+; Watch: schools D+, crime D, amenities D.
- Rockdale County (suburban): math 14% / reading 29% proficiency, ranked #136 of 174 in GA (top 78%) — low school quality limits family demand, transient renter base, plan for 1-2y turnover.
- Market conditions: Rents rising fast (+4.2%/yr); 386 active listings in the ZIP; 24 comparable units currently listed for rent nearby; rentals at typical pace (median 22d on market — plan ~3-4 weeks tenant-placement turnaround); solid renter incomes; 483 units permitted in Rockdale County in 2024 (0 in 5+ unit buildings).
Forward outlook
- Local home prices are declining (-3.0%/yr); year-one equity from $2k of loan paydown is wiped out by about $7k of value loss. Plan a longer hold.
- Rockdale County population projected at +29% by 2050 — long-run rental-demand tailwind backs the buy-and-hold thesis.
Negotiation context
- It's been on market 130 days — a 12% lower offer ($193k) is reasonable based on typical stale-listing flexibility.
- 2 sale attempts since 16y ago with the ask held roughly flat each time — persistent listings suggest the price (not the market) is what's stuck; bring a comps-based counter.
- Current owner paid $55k; list at $219k implies a 298% gain — meaningful room to come down on a strong offer.
Risks & watch-outs
- Climate carrying-cost: major wind risk, 27% chance of damaging wind over 30y; extreme-heat days projected 7→18/yr by 2055 (HVAC capex compounding) — expect insurance premiums to compound above CPI over the hold.
Questions for the listing agent
- What do current leases actually rent for vs. the listed asking? Can we see a recent rent roll and the last 12 months of T-12 income?
- It's been on market 130 days. Have you received any prior offers? Is the seller open to a 12% concession, seller financing, or rate buy-down credit?
- Why hasn't it sold? Are there any deal-killer items the seller is aware of (foundation, flood, title, zoning, code violations)?
- Is there a deadline driving the sale (1031 exchange, divorce, estate, relocation)? That informs how much negotiation room exists.
- Schools are D-rated, which usually means shorter tenancies and higher turnover. Who's the typical renter profile here, and what's been the actual vacancy rate?
- Crime grade is D in this area — have there been break-ins, vandalism, or insurance claims at this property in the last 3 years? What carrier currently insures it and at what premium?
- The area grade is low — what's the realistic commute time and amenity access for the typical tenant pool here? Any planned neighborhood developments (good or bad) we should know about?
- What's the average days-on-market for RENTAL listings here right now (not sales)? A rising rental-DOM trend means longer vacancies and softer asking-rent achievability than the comps imply.
- What's the recent tenant-quality profile in this submarket — average credit score on applications, eviction rate, late-payment / NSF rate, and stable-employment percentage? A property-management company in the area should have these aggregated.
- How much new for-sale + rental construction is in the pipeline within 1–3 miles? Heavy new supply typically softens prices + rents 12–24 months out; constrained supply supports both.
Investment metrics
- 1% rule
- 0.90% ✗
- Cap rate
- 5.95%
- Cash-on-cash
- -1.21%
- DSCR
- 0.95
- GRM
- 9.3
CMA / ARV
- ARV (median comp)
- $261,835
- List price
- $219,000
- Delta
- -16.36%
- Verdict
- UNDERPRICED
- Comps
- 20 within 1.0 mi
Show comp detail 12 sales within ~0.75 mi
| Address | Dist | Beds/Ba | Sqft | Sold | Price | $/sf | Match |
|---|---|---|---|---|---|---|---|
| 549 Greenview Ave SE | 0.23mi | 3/2.0 | 1,648 (-3%) | 3mo | $210,000 | $127 | 80 |
| 2805 SE Bridle Path | 0.10mi | 3/2.0 | 1,528 (-10%) | 0mo | $243,000 | $159 | 76 |
| 1511 Hillside Dr SE | 0.19mi | 3/2.5 | 1,840 (+8%) | 4mo | $257,000 | $140 | 75 |
| 2645 Laurel Woods Ln SE | 0.18mi | 4/2.0 (+1) | 1,829 (+8%) | 4mo | $325,000 | $178 | 69 |
| 1507 Hillside Dr SE | 0.20mi | 4/2.5 (+1) | 1,798 (+6%) | 9mo | $250,000 | $139 | 69 |
| 557 Greenview Ave SE | 0.22mi | 4/2.0 (+1) | 1,764 (+4%) | 9mo | $230,000 | $130 | 69 |
| 3014 Lakeridge Dr SE | 0.50mi | 3/2.0 | 1,593 (-6%) | 4mo | $219,000 | $137 | 61 |
| 1920 Logan Ln SE | 0.49mi | 4/2.5 (+1) | 1,829 (+8%) | 4mo | $328,000 | $179 | 56 |
| 224 Potts Rd SE | 0.70mi | 3/2.0 | 1,740 (+2%) | 11mo | $225,000 | $129 | 53 |
| 665 Huron Ct SE | 0.35mi | 3/2.0 | 1,456 (-14%) | 6mo | $214,000 | $147 | 52 |
| 3165 Goode Rd | 0.71mi | 3/2.0 | 1,524 (-10%) | 4mo | $230,000 | $151 | 45 |
| 2815 Highway 20 SE | 0.65mi | 3/2.0 | 1,470 (-14%) | 12mo | $264,000 | $180 | 35 |
Match score weights: distance 35% · size 25% · config 20% · recency 20%. Top-matched comps best support the ARV.
Projected returns pro-forma
-3.0% appreciation · 4.16% rent growth · sell at horizon
- IRR
- -16.9%
- Equity multiple
- 0.40×
- Total profit
- $-37,021
- Equity at exit
- $32,654
- IRR
- -6.6%
- Equity multiple
- 0.56×
- Total profit
- $-27,195
- Equity at exit
- $18,935
Cash invested: $61,320 (down + closing). Projections, not guarantees.
Landlord ↔ Tenant lean methodology
- Overall (STATE)
- 90 Strongly Landlord-Friendly
- State Georgia
- 90 Strongly Landlord-Friendly · R+3
- County
- — inherits STATE
- City
- — inherits STATE
ZIP-level market 30094
- Rents YoY
- 4.2%
- Active inventory
- 386
- Price-to-rent
- 9.3×
Monthly cashflow live
- Estimated rent
- $1,966 high interval (Pro) →
- Mortgage (P&I)
- −$1,148
- Tax from tax record
- −$375 /mo · $4,502/yr
- Insurance
- −$91
- HOA
- −$0
- Vacancy / Maint / Mgmt
- −$413
- Net cashflow
- $-62
Break-even live
UW: 25.0% down · 7.5% · 30yr · 1.5% tax · 5.0% vac · 8.0% maint · 8.0% mgmt
Financing live
Cash to close
- Down payment
- $54,750
- Closing costs
- $6,570
- Reserves months
- —
- Total cash needed
- —
Loan-product check · same deal, 3 products live
Conventional
25% down · 7.5% · 30yr
- Down + closing
- —
- Monthly P&I
- —
- Monthly cashflow
- —
- DSCR
- —
- Eligible?
- —
Personal DTI + credit; lowest rate.
DSCR
20% down · 8.5% · 30yr
- Down + closing
- —
- Monthly P&I
- —
- Monthly cashflow
- —
- DSCR
- —
- Eligible?
- —
No personal income docs; deal must DSCR.
Hard money
10% down · 12.0% · 12mo
- Down + closing
- —
- Monthly P&I
- —
- Monthly cashflow
- —
- DSCR
- —
- Eligible?
- —
Short-term bridge; refi at stabilization.
Rent comps 24 comps
| Address | Beds | Baths | Sqft | Rent | $/sqft | DOM | Units | Dist |
|---|---|---|---|---|---|---|---|---|
| 661 Greenview Ave SE Conyers, GA | 3.0 | 2.0 | 1393 | $1,700 | $1.22 | 24d | 1 | 0.23mi |
| 1419 Hillside Pl SE Conyers, GA | 4.0 | 2.0 | 1536 | $1,955 | $1.27 | 5d | 1 | 0.28mi |
| 619 Lakeridge Cir SE Conyers, GA | 3.0 | 2.0 | 1350 | $1,545 | $1.14 | 20d | 1 | 0.38mi |
| 595 Lakeridge Cir SE Conyers, GA | 3.0 | 2.0 | 1304 | $1,656 | $1.27 | 5d | 1 | 0.46mi |
| 1510 Marshall Ln SE Conyers, GA | 4.0 | 2.0 | 1525 | $2,073 | $1.36 | 43d | 1 | 0.48mi |
| 2641 Rolling Hills Way SE Conyers, GA | 3.0 | 2.0 | 1452 | $1,791 | $1.23 | 12d | 1 | 0.60mi |
| 2856 Bay Leaf Dr SE Conyers, GA | 3.0 | 2.0 | 1296 | $2,400 | $1.85 | 24d | 1 | 0.61mi |
| 1103 Sunset Rd SE , GA | 3.0–4.0 | 2.5 | 1850 | $2,040 | $1.10 | 18d | 24 | 0.64mi |
| 3131 Goode Rd Conyers, GA | 3.0 | 2.0 | 1824 | $2,000 | $1.10 | 20d | 1 | 0.66mi |
| 3144 Goode Rd Conyers, GA | 3.0 | 1.5 | 1468 | $1,500 | $1.02 | 43d | 1 | 0.70mi |
| 411 Cindy Dr SE Conyers, GA | 3.0 | 2.0 | 1424 | $1,830 | $1.29 | 2d | 1 | 0.71mi |
| 337 Windsor Walk SE Conyers, GA | 3.0 | 2.0 | 1247 | $1,695 | $1.36 | 12d | 1 | 0.72mi |
| 359 Cindy Dr SE Conyers, GA | 3.0 | 1.0 | 1265 | $1,326 | $1.05 | 43d | 1 | 0.81mi |
| 325 Morris Ct SE Conyers, GA | 3.0 | 2.0 | 1256 | $1,770 | $1.41 | 43d | 1 | 0.91mi |
| 2133 Boxwood Cir Conyers, GA | 4.0 | 2.5 | 2087 | $2,250 | $1.08 | 24d | 1 | 1.00mi |
| 2365 Highway 20 SE Conyers, GA | 1.0–2.0 | 1.0–2.0 | 984 | $1,730 | $1.76 | 1d | 7 | 1.02mi |
| 288 Morris Dr SE Conyers, GA | 3.0 | 2.0 | 1251 | $1,731 | $1.38 | 12d | 1 | 1.05mi |
| 2165 Boxwood Cir Conyers, GA | 4.0 | 2.5 | 2091 | $2,250 | $1.08 | 43d | 1 | 1.05mi |
| 2120 Weatherstone Cir SE Conyers, GA | 3.0 | 2.0 | 2076 | $2,250 | $1.08 | 24d | 1 | 1.14mi |
| 2511 Nugget Dr SW Conyers, GA | 3.0 | 2.0 | 1311 | $1,755 | $1.34 | 22d | 1 | 1.17mi |
| 3438 Creekwood Dr SE Conyers, GA | 3.0 | 2.0 | 1840 | $1,845 | $1.00 | 24d | 1 | 1.21mi |
| 1576 Cherry Hill Ct SW Conyers, GA | 3.0 | 2.0 | 1392 | $1,450 | $1.04 | 20d | 1 | 1.34mi |
| 2146 Miller Chapel Rd SE Conyers, GA | 3.0 | 2.5 | 1875 | $2,265 | $1.21 | 43d | 2 | 1.39mi |
| 1616 Cherry Hill Rd SW Conyers, GA | 3.0 | 2.0 | 1250 | $1,639 | $1.31 | 2d | 1 | 1.47mi |
Listing history 22 events
-
2026-06-18days on market $219,000 Active 130 DOM
-
2026-06-17days on market $219,000 Active 129 DOM
-
2026-06-16days on market $219,000 Active 128 DOM
-
2026-06-15days on market $219,000 Active 127 DOM
-
2026-06-13days on market $219,000 Active 125 DOM
-
2026-06-09days on market $219,000 Active 121 DOM
-
2026-06-08days on market $219,000 Active 120 DOM
-
2026-06-07days on market $219,000 Active 119 DOM
-
2026-06-04days on market $219,000 Active 116 DOM
-
2026-06-03days on market $219,000 Active 115 DOM
-
2026-06-02days on market $219,000 Active 114 DOM
-
2026-06-01days on market $219,000 Active 113 DOM
-
2026-05-31days on market $219,000 Active 112 DOM
-
2026-04-27price $219,000 252-char remark
Show marketing remark (252 chars)
GREAT LOCATION! SOLD AS IS !CLOSE TO EVERYTHING! FIRESIDE FAMILY ROOM IS COZY & COMFORTABLE. QUIET TREE LINED STREET W/ PRIVATE BACKYARD. EXCELLENT SCHOOLS! SAFE & QUIET NEIGHBORHOOD! OPEN & SPACIOUS FLOORPLAN! A MUST SEE! CALL FOR DETAILS!
-
2026-02-08$229,000 Active 252-char remark
Show marketing remark (252 chars)
GREAT LOCATION! SOLD AS IS !CLOSE TO EVERYTHING! FIRESIDE FAMILY ROOM IS COZY & COMFORTABLE. QUIET TREE LINED STREET W/ PRIVATE BACKYARD. EXCELLENT SCHOOLS! SAFE & QUIET NEIGHBORHOOD! OPEN & SPACIOUS FLOORPLAN! A MUST SEE! CALL FOR DETAILS!
-
2010-06-10historical 240-char remark
Show marketing remark (240 chars)
GREAT LOCATION! CLOSE TO EVERYTHING! FIRESIDE FAMILY ROOM IS COZY & COMFORTABLE. QUIET TREE LINED STREET W/ PRIVATE BACKYARD. EXCELLENT SCHOOLS! SAFE & QUIET NEIGHBORHOOD! OPEN & SPACIOUS FLOORPLAN! A MUST SEE! CALL FOR DETAILS!
-
2010-04-08soldstatus $55,000 Sold 240-char remark
Show marketing remark (240 chars)
GREAT LOCATION! CLOSE TO EVERYTHING! FIRESIDE FAMILY ROOM IS COZY & COMFORTABLE. QUIET TREE LINED STREET W/ PRIVATE BACKYARD. EXCELLENT SCHOOLS! SAFE & QUIET NEIGHBORHOOD! OPEN & SPACIOUS FLOORPLAN! A MUST SEE! CALL FOR DETAILS!
-
2010-03-23status Pending 240-char remark
Show marketing remark (240 chars)
GREAT LOCATION! CLOSE TO EVERYTHING! FIRESIDE FAMILY ROOM IS COZY & COMFORTABLE. QUIET TREE LINED STREET W/ PRIVATE BACKYARD. EXCELLENT SCHOOLS! SAFE & QUIET NEIGHBORHOOD! OPEN & SPACIOUS FLOORPLAN! A MUST SEE! CALL FOR DETAILS!
-
2010-03-09$55,000 Active 240-char remark
Show marketing remark (240 chars)
GREAT LOCATION! CLOSE TO EVERYTHING! FIRESIDE FAMILY ROOM IS COZY & COMFORTABLE. QUIET TREE LINED STREET W/ PRIVATE BACKYARD. EXCELLENT SCHOOLS! SAFE & QUIET NEIGHBORHOOD! OPEN & SPACIOUS FLOORPLAN! A MUST SEE! CALL FOR DETAILS!
-
2010-02-05price $55,000 Extended
-
2003-12-30soldstatus $126,100
-
1989-10-04soldstatus $79,900
ⓘ Source: listings_history table (triggers on properties + properties_extension) + one-shot
backfill from property_details.listing_events for pre-trigger history.
Tax reassessment forecast GA · Resets to sale price
- Current annual tax
- $4,502 · $375/mo
- Projected year-2 tax
- $4,502 · $375/mo
- Expected delta
- $0/yr ($0/mo · 0.0%)
ⓘ Screening estimate from a state-policy table — verify with the county assessor before closing.
Climate risk First Street
- Flood 1/10 Low FEMA zone X (unshaded) · 0% chance over 30 yrs
- Wildfire 1/10 Low
- Heat 6/10 Major 7 d/yr ≥105°F today · 18 d/yr by 30 yrs out
- Wind 6/10 Major 27% chance of damaging wind over 30 yrs
- Air quality 4/10 Moderate 5 unhealthy d/yr today · 7 by 30 yrs out
Nearby sold comps map
Loading sold comps map…
Walkable amenities ~0.75 mi
Loading nearby amenities…
Taxation est. · year 1
- Rental income
- $23,589
- − Mortgage interest
- −$12,267
- − Property taxes
- −$4,502
- − Insurance
- −$1,095
- − Repairs & maintenance
- −$1,887
- − Management
- −$1,887
- − Depreciation
- −$6,371
- Taxable loss
- −$4,421
- Est. tax savings @ 24.0%
- +$1,061
- After-tax cash flow
- $317/yr
For passive investors: Depreciation is non-cash, so a rental often shows a tax loss while cash-flowing — sheltering income. Rental losses are passive: they offset passive income freely, and up to $25,000/yr can offset ordinary (W-2) income if you actively participate and your MAGI is under $100k (phasing out to $0 by $150k); unused losses carry forward. On sale, claimed depreciation is recaptured at up to 25%, and gains may owe capital-gains tax (a 1031 exchange can defer both). Figures are a year-1 estimate at your 24.0% rate — not tax advice; consult a CPA.
Schools (NCES district)
- District
- Rockdale County
- NCES district ID
- 1304410
- Math proficiency
- 14% ▼ -17.00%
- Reading proficiency
- 29% ▼ -11.00%
- Median HH income
- $53,325
- Composite
- 19.42/100
- National rank
- #8776
- State rank
- #136 of 174 in GA
Livability — Conyers
- Score
- 67/100
- State rank
- #167
- US rank
- #10533
Category grades
Schools grade is shown separately in the Schools card above.
Census & demographics
- County
- Rockdale County · 96,534 people
- City population
- 96,534
- Metro
- Atlanta-Sandy Springs-Alpharetta, GA
- Population (ZIP)
- 33,731
- Household income
- $88,530
- Rent vs Own
- Severe rent burden
- 549.0
Population outlook (Rockdale County) Hauer SSP2
- Today (2025)
- 99,145 people
- By 2030
- 104,558 · +5.5%
- By 2040
- 116,100 · +17.1%
- By 2050
- 127,827 · +28.9%
- By 2075
- 159,113 · +60.5%
- By 2100
- 181,178 · +82.7%
Race, ethnicity, and origin ACS 2023
- Neighborhood character
- Diverse neighborhood (Simpson 0.60)
- Race & ethnicity
- Black 56% White 29% Two or more races 9% Hispanic / Latino 7% Asian 1%
- Hispanic origin (detail)
- Mexican 4% Puerto Rican 1%
- Common ancestry
- Hispanic 1% Serbian 1% Slovak 1%
- Foreign-born
- 7% · Canada
- Languages at home
- 91% English-only · Spanish 5% French/Haitian/Cajun 1%
Political lean MEDSL · Rockdale
- 2024 margin
- Solid D (+47.5) · D 73.4% · R 25.9%
- 2008→2024 swing
- +37.9pp toward D · 2008: 9.6pp · 2024: 47.5pp
- All cycles
- 2024: D+47.5 2020: D+40.8 2016: D+25.9 2012: D+16.4 2008: D+9.6
Not yet ingested
- Civics
- —
Market trends
- HPI YoY
- ▼ -168.06%
- Current HPI
- 205.627
- Rent YoY
- ▲ 4.16%
- Metro
- Atlanta-Sandy Springs-Alpharetta, GA
- State GDP YoY
- ▲ 2.66%
- F500 in state
- 28
Industry mix (Fortune 500 HQ in GA)
| Industry | F500 HQs | Revenue |
|---|---|---|
| Paper / Packaging | 2 | $29B |
|
||
| Retail | 1 | $160B |
|
||
| Transportation / Logistics | 1 | $91B |
|
||
| Airlines | 1 | $62B |
|
||
| Consumer Goods | 1 | $47B |
|
||
| Utilities | 1 | $25B |
|
||
Price history
+174.1% since first listed9 events — show timeline
- 2026-04-27 Price Changed $219,000 FMLS
- 2026-02-08 Listed $229,000 FMLS
- 2010-06-10 Listing Removed — FMLS
- 2010-04-08 Sold (MLS) $55,000 FMLS
- 2010-03-23 Pending — FMLS
- 2010-03-09 Listed $55,000 FMLS
- 2010-02-05 Price Changed $55,000 GAMLS
- 2003-12-30 Sold (Public Records) $126,100 Public Records
- 1989-10-04 Sold (Public Records) $79,900 Public Records
Property tax history
+5.6%/yrLatest (2025): $4,502 · +5.4% YoY. Source: county tax records.
Cash-flow waterfall
monthlySold comps — $/sqft
last 12 mo · ≤1 miLoading sold comps…