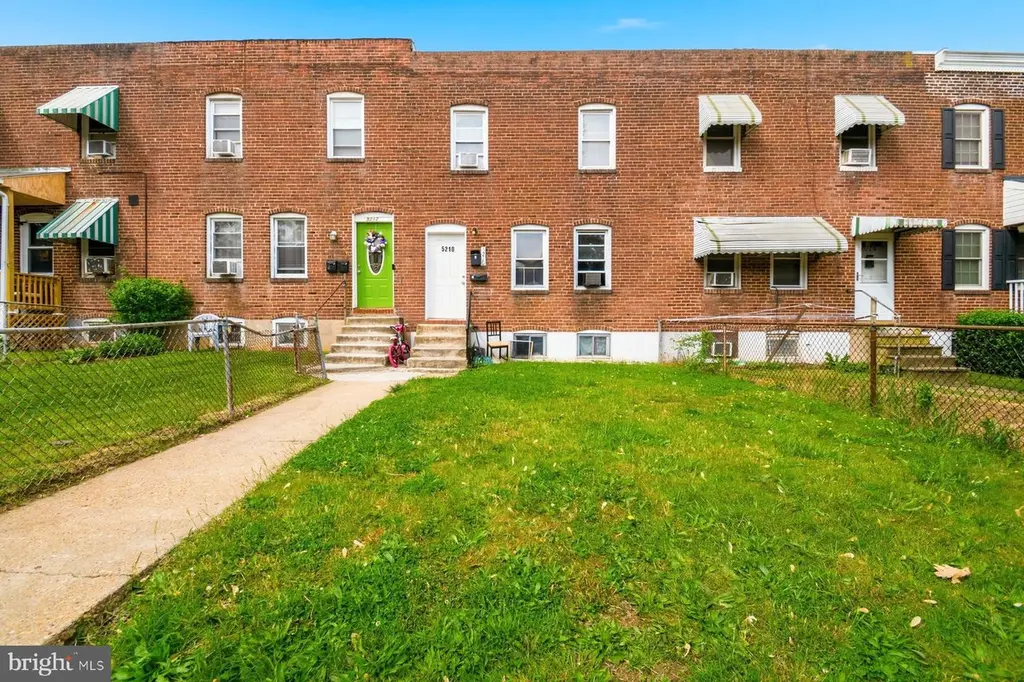
5210 Brookwood Rd · Brooklyn Park, MD
Flood risk 3/10 · Minor
- FEMA flood zone
- X (unshaded)
- Chance of flooding over 30 yrs
- 0.1%
- Est. flood insurance / yr
- $473 – $860
Fire risk 1/10 · Minimal
- Est. fire insurance / yr
- $755 – $1,403
Heat risk 8/10 · Major
- Hot days now (above 103°F)
- 7 days/yr
- Hot days in 30 yrs
- 14 days/yr
Wind risk 6/10 · Moderate
- Chance of severe wind over 30 yrs
- 27.0%
Air-quality risk 4/10 · Minor
- Unhealthy air days now
- 5 days/yr
- Unhealthy air days in 30 yrs
- 7 days/yr
Risk factors via First Street. Map © Google.
Why this score? — see what drove the C grade
The composite is a weighted blend of 9 inputs, each scored 0–100. Each bar is that input's sub-score; the figure is the points it added to the 100-point composite (weight × sub-score).
- Cash flow +25.1/30.0
- DSCR +8.2/10.0
- 1% rule +6.1/10.0
- ARV discount +5.5/15.0
- Livability +3.9/5.0
- Rent growth +3.5/5.0
- Schools +2.9/10.0
- Condition / age +2.5/5.0
- Appreciation +0.0/10.0
$179,000
🖨 Deal sheet 📄 Offer letter ✓ Due diligence
Listing remarks
Excellent investment opportunity! This lead-free 2-unit property is a strong income-producing asset generating $26,868 annually. Unit 1 features 3 bedrooms and 2 bathrooms, while Unit 2 offers 2 bedrooms and 1 bathroom, providing attractive layouts for tenants. Well-maintained and conveniently located near shopping, dining, and major commuter routes, this property offers steady cash flow and great long-term potential for any investor looking to expand their portfolio. Turnkey investment opportunity you won’t want to miss!
Key facts
- 2,223 sq ft lot
- 2 parking spots
- Built 1948
Property features AI
Exterior
- Parking: Detached carport with 2 spaces; Total of 2 garage/parking spaces
- Utilities: Public water; Public sewer
- Home design: Interior townhouse/rowhouse; Fee simple ownership
- Construction: Brick construction; Other foundation type; Finished above-grade area and finished lower level
- Exterior features: No tidal water on the property; Above-grade and below-grade structures
Interior
- Bedrooms: One two-bedroom unit; One three-bedroom unit
- Heating & cooling: Electric baseboard heating; Hot water system (unspecified type)
- Interior features: Estimated living area; Finished lower level space
Neighborhood map
What this means for you Summary
Snapshot
- This is a 4-bed/2.0-bath townhouse listed at $179k.
Deal economics
- At list price, monthly cash flow is $396 ($5k/yr) — positive.
- The deal already cash-flows at list — no discount required.
- Meets the 1% rule at list price ($2k rent vs $179k).
- Cap rate 8.9% vs local median 4.4% in Brooklyn Park — top-decile yield for the area; either an underpriced asset or a hidden risk that comps aren't pricing in. Stress-test before assuming the spread holds.
Location & tenants
- Location reads 77/100 on livability (#81 in MD, #3,091 nationally) — a middle-class / working-renter tenant base. Strengths: commute A+, housing A+, health & safety A+; Watch: schools C-, crime F, amenities F.
- Anne Arundel County Public Schools (suburban): math 20% / reading 37% proficiency, ranked #10 of 24 in MD (top 42%) — low school quality limits family demand, transient renter base, plan for 1-2y turnover.
- Market conditions: Rents rising fast (+4.1%/yr); 165 active listings in the ZIP; 21 comparable units currently listed for rent nearby; rentals at typical pace (median 24d on market — plan ~3-4 weeks tenant-placement turnaround); 1,303 units permitted in Anne Arundel County in 2024 (299 in 5+ unit buildings).
- This rent runs 44% of the median local income ($54k/yr) — at the standard rent-burdened threshold; future hikes will face affordability resistance.
Forward outlook
- Local home prices are declining (-3.0%/yr); year-one equity from $1k of loan paydown is wiped out by about $5k of value loss. Plan a longer hold.
- Anne Arundel County population projected at +17% by 2050 — long-run rental-demand tailwind backs the buy-and-hold thesis.
- At projected returns (-3.0% appreciation + 4.1% rent growth), your $50k cash investment doubles in ~10 years — after that, you're playing with house money.
Negotiation context
- Only 9 days on market — expect competitive offers; lowballing is unlikely to land.
- 4 sale attempts with the ask held roughly flat each time — persistent listings suggest the price (not the market) is what's stuck; bring a comps-based counter.
Risks & watch-outs
- Watch-outs: built in 1948 — expect roof / HVAC / electrical / plumbing capex.
- Climate carrying-cost: major wind risk, 27% chance of damaging wind over 30y; extreme-heat days projected 7→14/yr by 2055 (HVAC capex compounding) — expect insurance premiums to compound above CPI over the hold.
Questions for the listing agent
- Built in 1948 — when were the roof, HVAC, electrical panel, plumbing, and water heater last replaced?
- Is there a deadline driving the sale (1031 exchange, divorce, estate, relocation)? That informs how much negotiation room exists.
- Crime grade is F in this area — have there been break-ins, vandalism, or insurance claims at this property in the last 3 years? What carrier currently insures it and at what premium?
- What's the average days-on-market for RENTAL listings here right now (not sales)? A rising rental-DOM trend means longer vacancies and softer asking-rent achievability than the comps imply.
- What's the recent tenant-quality profile in this submarket — average credit score on applications, eviction rate, late-payment / NSF rate, and stable-employment percentage? A property-management company in the area should have these aggregated.
- How much new for-sale + rental construction is in the pipeline within 1–3 miles? Heavy new supply typically softens prices + rents 12–24 months out; constrained supply supports both.
Investment metrics
- 1% rule
- 1.11% ✓
- Cap rate
- 8.95%
- Cash-on-cash
- 9.48%
- DSCR
- 1.42
- GRM
- 7.5
CMA / ARV
- ARV (median comp)
- $171,238
- List price
- $179,000
- Delta
- 4.53%
- Verdict
- FAIR
- Comps
- 6 within 1.0 mi
Show comp detail 12 sales within ~0.75 mi
| Address | Dist | Beds/Ba | Sqft | Sold | Price | $/sf | Match |
|---|---|---|---|---|---|---|---|
| 5201 Brookwood Rd | 0.03mi | 5/3.0 (+1) | 1,320 (+5%) | 0mo | $165,000 | $125 | 81 |
| 435 Seward Ave | 0.23mi | 3/1.0 (-1) | 1,324 (+6%) | 1mo | $215,500 | $163 | 70 |
| 406 Seward Ave | 0.20mi | 3/1.5 (-1) | 1,140 (-9%) | 8mo | $160,000 | $140 | 62 |
| 4213 Doris Ave | 0.49mi | 3/1.5 (-1) | 1,240 (-1%) | 10mo | $200,000 | $161 | 60 |
| 921 Victory Ave | 0.19mi | 3/2.0 (-1) | 1,104 (-12%) | 9mo | $140,000 | $127 | 59 |
| 458 Seward Ave | 0.18mi | 3/1.0 (-1) | 1,088 (-13%) | 5mo | $170,000 | $156 | 56 |
| 123 8th Ave | 0.49mi | 3/1.0 (-1) | 1,216 (-3%) | 9mo | $240,000 | $197 | 56 |
| 5101 4th St | 0.30mi | 3/1.0 (-1) | 1,120 (-11%) | 12mo | $223,000 | $199 | 50 |
| 4128 Audrey Ave | 0.60mi | 3/2.0 (-1) | 1,380 (+10%) | 7mo | $99,000 | $72 | 45 |
| 4041 6th St | 0.70mi | 4/2.0 | 1,109 (-12%) | 5mo | $165,000 | $149 | 44 |
| 4135 Doris Ave | 0.54mi | 3/1.5 (-1) | 1,392 (+11%) | 9mo | $211,000 | $152 | 42 |
| 3948 Brooklyn Ave | 0.70mi | 3/1.5 (-1) | 1,080 (-14%) | 0mo | $90,000 | $83 | 37 |
Match score weights: distance 35% · size 25% · config 20% · recency 20%. Top-matched comps best support the ARV.
Projected returns pro-forma
-3.0% appreciation · 4.08% rent growth · sell at horizon
- IRR
- -0.8%
- Equity multiple
- 0.97×
- Total profit
- $-1,619
- Equity at exit
- $26,689
- IRR
- 9.9%
- Equity multiple
- 1.80×
- Total profit
- $40,152
- Equity at exit
- $15,477
Cash invested: $50,120 (down + closing). Projections, not guarantees.
Landlord ↔ Tenant lean methodology
- Overall (STATE)
- 27 Tenant-Leaning
- State Maryland
- 27 Tenant-Leaning · D+14
- County
- — inherits STATE
- City
- — inherits STATE
ZIP-level market 21225
- Home prices YoY
- -31.9%
- Rents YoY
- 4.1%
- Active inventory
- 165
- Price-to-rent
- 7.5×
Monthly cashflow live
- Estimated rent
- $1,982 high interval (Pro) →
- Mortgage (P&I)
- −$939
- Tax from tax record
- −$156 /mo · $1,877/yr
- Insurance
- −$75
- HOA
- −$0
- Vacancy / Maint / Mgmt
- −$416
- Net cashflow
- $396
Break-even live
UW: 25.0% down · 7.5% · 30yr · 1.5% tax · 5.0% vac · 8.0% maint · 8.0% mgmt
Financing live
Cash to close
- Down payment
- $44,750
- Closing costs
- $5,370
- Reserves months
- —
- Total cash needed
- —
Loan-product check · same deal, 3 products live
Conventional
25% down · 7.5% · 30yr
- Down + closing
- —
- Monthly P&I
- —
- Monthly cashflow
- —
- DSCR
- —
- Eligible?
- —
Personal DTI + credit; lowest rate.
DSCR
20% down · 8.5% · 30yr
- Down + closing
- —
- Monthly P&I
- —
- Monthly cashflow
- —
- DSCR
- —
- Eligible?
- —
No personal income docs; deal must DSCR.
Hard money
10% down · 12.0% · 12mo
- Down + closing
- —
- Monthly P&I
- —
- Monthly cashflow
- —
- DSCR
- —
- Eligible?
- —
Short-term bridge; refi at stabilization.
Rent comps 21 comps
| Address | Beds | Baths | Sqft | Rent | $/sqft | DOM | Units | Dist |
|---|---|---|---|---|---|---|---|---|
| 5215 Wasena Ave Brooklyn, MD | 3.0 | 1.0 | 1030 | $1,650 | $1.60 | 43d | 1 | 0.35mi |
| 4206 Audrey Ave Brooklyn, MD | 3.0 | 3.0 | 1104 | $1,950 | $1.77 | 23d | 1 | 0.57mi |
| 3840 8th St Brooklyn, MD | 3.0 | 1.5 | 1088 | $1,606 | $1.48 | 4d | 1 | 0.84mi |
| 3822 6th St Brooklyn, MD | 3.0 | 3.0 | 1580 | $1,850 | $1.17 | 23d | 1 | 0.85mi |
| 140 Bethlehem Pl Brooklyn, MD | 3.0 | 3.5 | 1120 | $1,500 | $1.34 | 43d | 1 | 0.86mi |
| 507 Washburn Ave Brooklyn, MD | 3.0 | 1.5 | 1024 | $2,500 | $2.44 | 20d | 1 | 0.89mi |
| 507 Washburn Ave Brooklyn, MD | 3.0 | 1.5 | 1024 | $2,500 | $2.44 | 4d | 1 | 0.89mi |
| 507 Washburn Ave Brooklyn, MD | 3.0 | 1.5 | 1024 | $2,500 | $2.44 | 23d | 1 | 0.89mi |
| 303 Arden Rd W Brooklyn, MD | 3.0 | 2.0 | 1388 | $2,500 | $1.80 | 17d | 1 | 0.89mi |
| 3828 10th St Brooklyn, MD | 3.0 | 2.0 | 1215 | $2,350 | $1.93 | 43d | 1 | 0.91mi |
| 3826 10th St Unit Entire House Baltimore, MD | 3.0 | 2.0 | 1110 | $2,400 | $2.16 | 23d | 1 | 0.92mi |
| 732 Old Riverside Rd Brooklyn, MD | 3.0 | 2.5 | 1570 | $1,900 | $1.21 | 43d | 1 | 0.93mi |
| 202 W Edgevale Rd Unit A Baltimore, MD | 3.0 | 1.0 | 1824 | $1,650 | $0.90 | 4d | 1 | 0.98mi |
| 4216 Prudence St Curtis Bay, MD | 4.0 | 3.0 | 1116 | $2,100 | $1.88 | 43d | 1 | 0.99mi |
| 217 W Edgevale Rd Brooklyn, MD | 3.0 | 1.5 | 992 | $1,800 | $1.81 | 23d | 1 | 1.00mi |
| 3544 4th St Brooklyn, MD | 4.0 | 2.5 | 1800 | $1,940 | $1.08 | 23d | 1 | 1.15mi |
| 1305 E Patapsco Ave Brooklyn, MD | 3.0 | 1.5 | 930 | $1,650 | $1.77 | 4d | 1 | 1.18mi |
| 1353 Cambria St Brooklyn, MD | 3.0 | 2.0 | 986 | $1,600 | $1.62 | 17d | 1 | 1.18mi |
| 1517 Sycamore St Curtis Bay, MD | 3.0 | 1.5 | 1210 | $1,999 | $1.65 | 23d | 1 | 1.19mi |
| 3513 Horton Ave Brooklyn, MD | 3.0 | 1.0 | 1020 | $1,600 | $1.57 | 17d | 1 | 1.20mi |
| 116-B Warwickshire Ln Glen Burnie, MD | 1.0–3.0 | 1.0–1.5 | 800 | $1,650 | $2.06 | 1d | 43 | 1.47mi |
Listing history 9 events
-
2026-05-12$179,000 Active 533-char remark
-
2026-02-18historical
-
2026-02-17status Active
-
2025-11-14historical Active Under Contract
-
2025-09-04$89,474 Active
-
2025-07-07soldstatus $1,025,000
-
2025-02-28historical $1,099
-
2025-01-10$1,099
-
1977-11-25soldstatus $25,000
ⓘ Source: listings_history table (triggers on properties + properties_extension) + one-shot
backfill from property_details.listing_events for pre-trigger history.
Tax reassessment forecast MD · Partial reset (capped growth)
- Current annual tax
- $1,877 · $156/mo
- Projected year-2 tax
- $1,914 · $160/mo
- Expected delta
- +$37/yr (+$3/mo · 2.0%)
ⓘ Screening estimate from a state-policy table — verify with the county assessor before closing.
Climate risk First Street
- Flood 3/10 Moderate FEMA zone X (unshaded) · 10% chance over 30 yrs
- Wildfire 1/10 Low
- Heat 8/10 Severe 7 d/yr ≥103°F today · 14 d/yr by 30 yrs out
- Wind 6/10 Major 27% chance of damaging wind over 30 yrs
- Air quality 4/10 Moderate 5 unhealthy d/yr today · 7 by 30 yrs out
Nearby sold comps map
Loading sold comps map…
Walkable amenities ~0.75 mi
Loading nearby amenities…
Taxation est. · year 1
- Rental income
- $23,783
- − Mortgage interest
- −$10,027
- − Property taxes
- −$1,877
- − Insurance
- −$895
- − Repairs & maintenance
- −$1,903
- − Management
- −$1,903
- − Depreciation
- −$5,207
- Taxable income
- $1,971
- Est. tax owed @ 24.0%
- −$473
- After-tax cash flow
- $4,279/yr
For passive investors: Depreciation is non-cash, so a rental often shows a tax loss while cash-flowing — sheltering income. Rental losses are passive: they offset passive income freely, and up to $25,000/yr can offset ordinary (W-2) income if you actively participate and your MAGI is under $100k (phasing out to $0 by $150k); unused losses carry forward. On sale, claimed depreciation is recaptured at up to 25%, and gains may owe capital-gains tax (a 1031 exchange can defer both). Figures are a year-1 estimate at your 24.0% rate — not tax advice; consult a CPA.
Schools (NCES district)
- District
- Anne Arundel County Public Schools
- NCES district ID
- 2400060
- Math proficiency
- 20% ▼ -21.00%
- Reading proficiency
- 37% ▼ -13.00%
- Median HH income
- $87,880
- Composite
- 28.52/100
- National rank
- #6733
- State rank
- #10 of 24 in MD
Livability — Brooklyn Park
- Score
- 77/100
- State rank
- #81
- US rank
- #3091
Category grades
Schools grade is shown separately in the Schools card above.
Census & demographics
- Census place
- Brooklyn Park, MD
- County
- Anne Arundel County · 535,653 people
- City population
- 34,062
- Metro
- Baltimore-Columbia-Towson, MD
- Population (ZIP)
- 34,062
- Household income
- $54,020
- Rent vs Own
- Severe rent burden
- 1440.0
Population outlook (Anne Arundel County) Hauer SSP2
- Today (2025)
- 617,384 people
- By 2030
- 642,094 · +4.0%
- By 2040
- 686,621 · +11.2%
- By 2050
- 723,031 · +17.1%
- By 2075
- 809,346 · +31.1%
- By 2100
- 837,658 · +35.7%
Race, ethnicity, and origin ACS 2023
- Neighborhood character
- Diverse neighborhood (Simpson 0.68)
- Race & ethnicity
- Black 42% White 32% Hispanic / Latino 20% Two or more races 8% Native American 3% Asian 2%
- Hispanic origin (detail)
- Mexican 5% Puerto Rican 1%
- Common ancestry
- Romanian 2% Lithuanian 1% Iranian 1%
- Foreign-born
- 12% · Canada, China
- Languages at home
- 81% English-only · Spanish 16% Other Indo-European 1% French/Haitian/Cajun 1%
Political lean MEDSL · Anne Arundel
- 2024 margin
- D (+13.9) · D 55.7% · R 41.7% · Other 2.6%
- 2008→2024 swing
- +15.7pp toward D · 2008: -1.8pp · 2024: 13.9pp
- All cycles
- 2024: D+13.9 2020: D+14.5 2016: D+0.7 2012: R+0.9 2008: R+1.8
Not yet ingested
- Civics
- —
Market trends
- HPI YoY
- ▼ -119.44%
- Current HPI
- 254.5089
- Rent YoY
- ▲ 4.08%
- Metro
- Baltimore-Columbia-Towson, MD
- State GDP YoY
- ▲ 2.97%
- F500 in state
- 12
Industry mix (Fortune 500 HQ in MD)
| Industry | F500 HQs | Revenue |
|---|---|---|
| Aerospace / Defense | 1 | $71B |
|
||
| Utilities | 1 | $25B |
|
||
| Hotels | 1 | $24B |
|
||
| Consumer Goods | 1 | $7B |
|
||
| Real Estate | 1 | $6B |
|
||
| Chemicals | 1 | $2B |
|
||
Price history
+600.0% since first listed11 events — show timeline
- 2026-05-28 Sold (MLS) $175,000 BRIGHT MLS
- 2026-05-21 Pending — BRIGHT MLS
- 2026-05-12 Listed $179,000 BRIGHT MLS
- 2026-02-18 Listing Removed — BRIGHT MLS
- 2026-02-17 Relisted — BRIGHT MLS
- 2025-11-14 Contingent — BRIGHT MLS
- 2025-09-04 Listed $89,474 BRIGHT MLS
- 2025-07-07 Sold (Public Records) $1,025,000 Public Records
- 2025-02-28 Rental Removed $1,099 RENTALBEAST
- 2025-01-10 Listed for Rent $1,099 RENTALBEAST
- 1977-11-25 Sold (Public Records) $25,000 Public Records
Property tax history
+5.5%/yrLatest (2025): $1,877 · +5.6% YoY. Source: county tax records.
Cash-flow waterfall
monthlySold comps — $/sqft
last 12 mo · ≤1 miLoading sold comps…