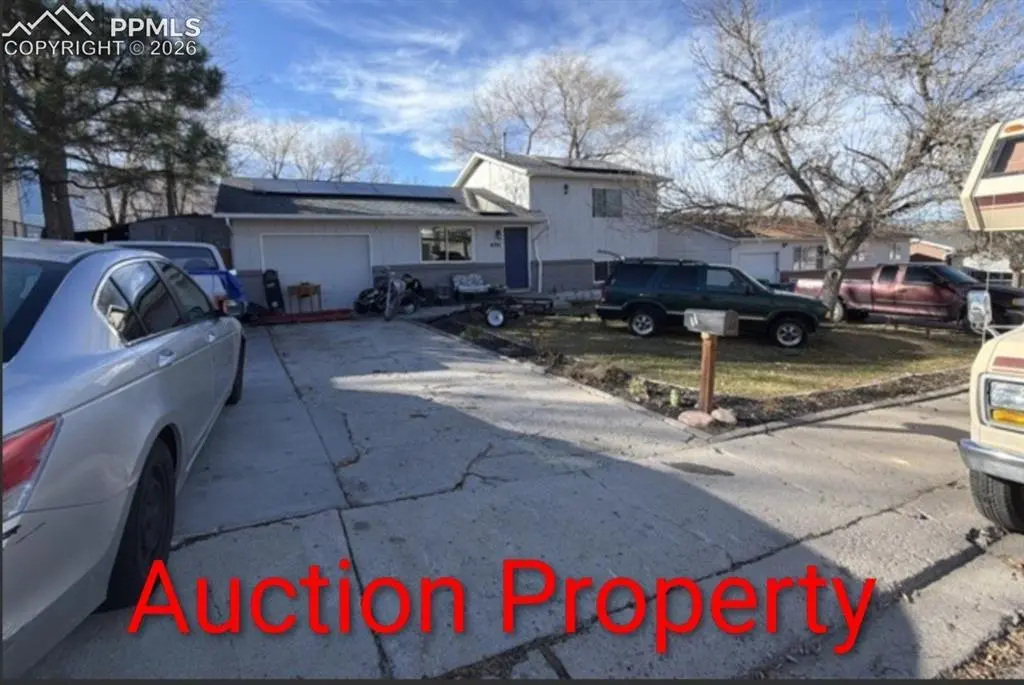
4336 Chamberlin St · Stratmoor, CO
Flood risk 1/10 · Minimal
- FEMA flood zone
- X (unshaded)
- Chance of flooding over 30 yrs
- 0.0%
- Est. flood insurance / yr
- $473 – $860
Fire risk 6/10 · Moderate
- Est. fire insurance / yr
- $939 – $1,743
Heat risk 3/10 · Minor
- Hot days now (above 91°F)
- 7 days/yr
- Hot days in 30 yrs
- 19 days/yr
Wind risk 2/10 · Minimal
- Chance of severe wind over 30 yrs
- —
Air-quality risk 1/10 · Minimal
- Unhealthy air days now
- 0 days/yr
- Unhealthy air days in 30 yrs
- 0 days/yr
Risk factors via First Street. Map © Google.
Why this score? — see what drove the B- grade
The composite is a weighted blend of 9 inputs, each scored 0–100. Each bar is that input's sub-score; the figure is the points it added to the 100-point composite (weight × sub-score).
- Cash flow +30.0/30.0
- DSCR +10.0/10.0
- 1% rule +9.6/10.0
- ARV discount +7.5/15.0
- Livability +3.2/5.0
- Condition / age +2.5/5.0
- Rent growth +2.4/5.0
- Schools +2.1/10.0
- Appreciation +0.0/10.0
$125,000
🖨 Deal sheet 📄 Offer letter ✓ Due diligence
Listing remarks
* * * * AUCTION PROPERTY * * * * This property has been placed in an upcoming RESERVE auction. Property is subject to buyer's premium pursuant to the Auction Participation Agreement. The list price is the opening bid only and does not indicate the reserve or the sales price. No visiting the site or disturbing the occupants. NO INSPECTIONS allowed. Sold as-is. Rooms were used off tax records and past MLS information and not confirmed.
Key facts
- 7,326 sq ft lot
- Garage
- Built 1973
Property features AI
Finance
- Financial info: Cash terms available
- HOA & community: Homeowners association present; No association fee
Exterior
- Parking: Attached 1-car garage
- Utilities: Water provided by association/district; Electricity available; Telephone available
- Home design: Single-family home; Existing home
- Construction: Framed on lot; Masonite-type siding; Composite shingle roof; Crawl space foundation; Basement fully finished
- Exterior features: Level lot
Interior
- Bedrooms: Primary bedroom located on the upper level
- Bathrooms: 1 full bath; 1 three-quarter bath
- Heating & cooling: Forced air heating (natural gas); No cooling
- Interior features: Forced air heating with natural gas; No cooling
Neighborhood map
What this means for you Summary
Snapshot
- This is a 3-bed/2.0-bath single-family listed at $125k.
Deal economics
- At list price, monthly cash flow is $605 ($7k/yr) — positive.
- The deal already cash-flows at list — no discount required.
- Meets the 1% rule at list price ($2k rent vs $125k).
- Recommended offer: $121k (3.0% below list) — sets the bar for market timing.
- Cap rate 12.1% vs local median 4.2% in Stratmoor — top-decile yield for the area; either an underpriced asset or a hidden risk that comps aren't pricing in. Stress-test before assuming the spread holds.
Location & tenants
- Location reads 65/100 on livability (#156 in CO) — a middle-class / working-renter tenant base. Strengths: housing A+, health & safety A+, cost of living B+; Watch: schools F, crime F, amenities F.
- Harrison School District No. 2 In The County Of El Paso An (urban): math 16% / reading 35% proficiency, ranked #67 of 86 in CO (top 78%) — low school quality limits family demand, transient renter base, plan for 1-2y turnover; 62% free/reduced lunch — lower-income household profile, screen leases tightly.
- Market conditions: Rents soft (-0.4%/yr); 300 active listings in the ZIP; 23 comparable units currently listed for rent nearby; rentals leasing fast (median 3d on market — plan ~1-2 weeks tenant-placement turnaround); solid renter incomes; 3,906 units permitted in El Paso County in 2024 (872 in 5+ unit buildings).
Forward outlook
- Local home prices are declining (-3.0%/yr); year-one equity from $864 of loan paydown is wiped out by about $4k of value loss. Plan a longer hold.
- El Paso County population projected at +28% by 2050 — long-run rental-demand tailwind backs the buy-and-hold thesis.
- At projected returns (-3.0% appreciation + 0.0% rent growth), your $35k cash investment doubles in ~8 years — after that, you're playing with house money.
Negotiation context
- It's been on market 41 days — a 3% lower offer ($121k) is reasonable based on typical stale-listing flexibility.
Risks & watch-outs
- Climate carrying-cost: major wildfire risk — expect insurance premiums to compound above CPI over the hold.
Questions for the listing agent
- It's been on market 41 days. Have you received any prior offers? Is the seller open to a 3% concession, seller financing, or rate buy-down credit?
- Built in 1973 — when were the roof, HVAC, electrical panel, plumbing, and water heater last replaced?
- Is there a deadline driving the sale (1031 exchange, divorce, estate, relocation)? That informs how much negotiation room exists.
- Schools are F-rated, which usually means shorter tenancies and higher turnover. Who's the typical renter profile here, and what's been the actual vacancy rate?
- Crime grade is F in this area — have there been break-ins, vandalism, or insurance claims at this property in the last 3 years? What carrier currently insures it and at what premium?
- What's the average days-on-market for RENTAL listings here right now (not sales)? A rising rental-DOM trend means longer vacancies and softer asking-rent achievability than the comps imply.
- What's the recent tenant-quality profile in this submarket — average credit score on applications, eviction rate, late-payment / NSF rate, and stable-employment percentage? A property-management company in the area should have these aggregated.
- How much new for-sale + rental construction is in the pipeline within 1–3 miles? Heavy new supply typically softens prices + rents 12–24 months out; constrained supply supports both.
Investment metrics
- 1% rule
- 1.46% ✓
- Cap rate
- 12.10%
- Cash-on-cash
- 20.75%
- DSCR
- 1.92
- GRM
- 5.7
CMA / ARV
- ARV (on-the-fly)
- $388,542
- Comps found
- 12
Show comp detail 12 sales within ~0.75 mi
| Address | Dist | Beds/Ba | Sqft | Sold | Price | $/sf | Match |
|---|---|---|---|---|---|---|---|
| 1910 S Chamberlin | 0.12mi | 4/2.0 (+1) | 1,666 (-1%) | 3mo | $369,900 | $222 | 86 |
| 2010 Hampton South | 0.31mi | 4/2.0 (+1) | 1,666 (-1%) | 4mo | $377,600 | $227 | 76 |
| 637 Catalina Dr | 0.34mi | 4/2.0 (+1) | 1,666 (-1%) | 3mo | $290,000 | $174 | 75 |
| 3935 Sagemont Ct | 0.53mi | 3/3.0 | 1,652 (-2%) | 2mo | $400,000 | $242 | 66 |
| 4425 Millburn Dr | 0.11mi | 4/2.0 (+1) | 1,502 (-11%) | 7mo | $290,000 | $193 | 66 |
| 3883 Glenhurst St | 0.65mi | 3/1.5 | 1,652 (-2%) | 1mo | $390,000 | $236 | 64 |
| 1235 Grass Valley Dr | 0.75mi | 3/2.0 | 1,700 (+1%) | 2mo | $402,000 | $236 | 62 |
| 1338 Grass Valley Dr | 0.59mi | 3/3.0 | 1,752 (+4%) | 1mo | $450,000 | $257 | 61 |
| 326 Catalina Dr | 0.70mi | 3/3.0 | 1,664 (-1%) | 5mo | $355,500 | $214 | 57 |
| 3865 Rosemere St | 0.60mi | 4/2.0 (+1) | 1,788 (+6%) | 6mo | $413,000 | $231 | 52 |
| 3751 Red Cedar Dr | 0.74mi | 3/2.0 | 1,831 (+9%) | 5mo | $265,000 | $145 | 47 |
| 3925 Glendale St | 0.69mi | 4/2.0 (+1) | 1,901 (+13%) | 1mo | $460,000 | $242 | 40 |
Match score weights: distance 35% · size 25% · config 20% · recency 20%. Top-matched comps best support the ARV.
Projected returns pro-forma
-3.0% appreciation · 0.0% rent growth · sell at horizon
- IRR
- 9.7%
- Equity multiple
- 1.37×
- Total profit
- $12,939
- Equity at exit
- $18,638
- IRR
- 16.3%
- Equity multiple
- 2.15×
- Total profit
- $40,223
- Equity at exit
- $10,808
Cash invested: $35,000 (down + closing). Projections, not guarantees.
Landlord ↔ Tenant lean methodology
- Overall (STATE)
- 38 Tenant-Leaning
- State Colorado
- 38 Tenant-Leaning · D+4
- County
- — inherits STATE
- City
- — inherits STATE
ZIP-level market 80906
- Rents YoY
- -0.4%
- Active inventory
- 300
- Price-to-rent
- 5.7×
Monthly cashflow live
- Estimated rent
- $1,831 high interval (Pro) →
- Mortgage (P&I)
- −$656
- Tax from tax record
- −$133 /mo · $1,600/yr
- Insurance
- −$52
- HOA
- −$0
- Vacancy / Maint / Mgmt
- −$384
- Net cashflow
- $605
Break-even live
UW: 25.0% down · 7.5% · 30yr · 1.5% tax · 5.0% vac · 8.0% maint · 8.0% mgmt
Financing live
Cash to close
- Down payment
- $31,250
- Closing costs
- $3,750
- Reserves months
- —
- Total cash needed
- —
Loan-product check · same deal, 3 products live
Conventional
25% down · 7.5% · 30yr
- Down + closing
- —
- Monthly P&I
- —
- Monthly cashflow
- —
- DSCR
- —
- Eligible?
- —
Personal DTI + credit; lowest rate.
DSCR
20% down · 8.5% · 30yr
- Down + closing
- —
- Monthly P&I
- —
- Monthly cashflow
- —
- DSCR
- —
- Eligible?
- —
No personal income docs; deal must DSCR.
Hard money
10% down · 12.0% · 12mo
- Down + closing
- —
- Monthly P&I
- —
- Monthly cashflow
- —
- DSCR
- —
- Eligible?
- —
Short-term bridge; refi at stabilization.
Rent comps 23 comps
| Address | Beds | Baths | Sqft | Rent | $/sqft | DOM | Units | Dist |
|---|---|---|---|---|---|---|---|---|
| 1624 Hampton S Colorado Springs, CO | 1.0–4.0 | 1.0–2.0 | 858 | $693 | $0.81 | 2d | 1 | 0.20mi |
| 1472 Meadow Peak Vw Colorado Springs, CO | 1.0–3.0 | 1.0–2.0 | 932 | $1,683 | $1.80 | 2d | 10 | 0.40mi |
| 1345 Coolcrest Dr Colorado Springs, CO | 4.0 | 2.5 | 1783 | $2,321 | $1.30 | 2d | 1 | 0.58mi |
| 4241 Prestige Pt Colorado Springs, CO | 2.0 | 2.5 | 1333 | $2,000 | $1.50 | 2d | 1 | 0.88mi |
| 973 Mountain Crest Vw Colorado Springs, CO | 2.0 | 2.5 | 1351 | $2,172 | $1.61 | 2d | 1 | 0.89mi |
| 3770 Strawberry Field Grv Colorado Springs, CO | 2.0 | 2.0 | 1137 | $1,700 | $1.50 | 2d | 1 | 0.91mi |
| 3750 Strawberry Field Grv Unit E Colorado Springs, CO | 2.0 | 2.0 | 1137 | $1,650 | $1.45 | 23d | 1 | 0.91mi |
| 3850 Strawberry Field Grv Unit B Colorado Springs, CO | 2.0 | 2.0 | 1084 | $1,650 | $1.52 | 23d | 1 | 0.93mi |
| 3870 Strawberry Field Grv Unit F Colorado Springs, CO | 2.0 | 2.0 | 1084 | $1,595 | $1.47 | 10d | 1 | 0.95mi |
| 4125 Pebble Ridge Cir Colorado Springs, CO | 1.0–2.0 | 1.0–2.0 | 885 | $1,902 | $2.15 | 2d | 13 | 0.96mi |
| 3750 Penny Pt Unit G Colorado Springs, CO | 2.0 | 1.5 | 1084 | $1,550 | $1.43 | 23d | 1 | 0.98mi |
| 3650 Strawberry Field Grv Unit G Colorado Springs, CO | 3.0 | 2.0 | 1265 | $1,895 | $1.50 | 23d | 1 | 1.03mi |
| 1308 Hartford St Colorado Springs, CO | 4.0 | 2.0 | 1666 | $1,950 | $1.17 | 23d | 1 | 1.05mi |
| 918 London Green Way Colorado Springs, CO | 3.0 | 1.5 | 1327 | $1,710 | $1.29 | 23d | 1 | 1.08mi |
| 862 London Green Way Colorado Springs, CO | 3.0 | 2.5 | 1334 | $1,900 | $1.42 | 2d | 1 | 1.17mi |
| 555 Cougar Bluff Pt #205 Colorado Springs, CO | 2.0 | 2.0 | 1171 | $1,700 | $1.45 | 23d | 1 | 1.17mi |
| 1810 Eldorado Springs Hts Colorado Springs, CO | 1.0–3.0 | 1.0–2.0 | 1081 | $3,145 | $2.91 | 2d | 14 | 1.18mi |
| 3308 Quail Lake Rd Colorado Springs, CO | 1.0–2.0 | 1.0–2.0 | 943 | $1,909 | $2.02 | 2d | 1 | 1.29mi |
| 780 San Bruno Pl Colorado Springs, CO | 3.0 | 2.0 | 1148 | $2,150 | $1.87 | 14d | 1 | 1.31mi |
| 850 Quail Lake Cir Colorado Springs, CO | 4.0 | 3.0 | 2117 | $2,250 | $1.06 | 10d | 1 | 1.36mi |
| 3119 Cliveden Hts Colorado Springs, CO | 2.0–3.0 | 2.5 | 1184 | $1,985 | $1.68 | 3d | 1 | 1.39mi |
| 890 Quail Lake Cir Colorado Springs, CO | 1.0–3.0 | 1.0–2.0 | 1147 | $2,070 | $1.80 | 2d | 21 | 1.41mi |
| 366 Cobblestone Dr Colorado Springs, CO | 4.0 | 3.0 | 2058 | $2,300 | $1.12 | 23d | 1 | 1.47mi |
Listing history 24 events
-
2026-06-18days on market $125,000 Active 41 DOM
-
2026-06-17days on market $125,000 Active 40 DOM
-
2026-06-16days on market $125,000 Active 39 DOM
-
2026-06-15days on market $125,000 Active 38 DOM
-
2026-06-14days on market $125,000 Active 36 DOM
-
2026-06-13days on market $125,000 Active 35 DOM
-
2026-06-10days on market $125,000 Active 33 DOM
-
2026-06-09days on market $125,000 Active 32 DOM
-
2026-06-08days on market $125,000 Active 31 DOM
-
2026-06-07days on market $125,000 Active 30 DOM
-
2026-06-05days on market $125,000 Active 27 DOM
-
2026-06-03days on market $125,000 Active 26 DOM
-
2026-06-03days on market $125,000 Active 25 DOM
-
2026-06-01days on market $125,000 Active 24 DOM
-
2026-05-31days on market $125,000 Active 23 DOM
-
2026-05-08$125,000 Active
-
2022-07-18soldstatus $332,500
-
2017-09-11soldstatus $212,500
-
2016-11-18price $125,000
-
2016-07-29price $130,000
-
2016-06-10price $140,000
-
2008-04-07soldstatus $122,000
-
1999-07-07soldstatus $87,900
-
1973-11-01soldstatus $20,400
ⓘ Source: listings_history table (triggers on properties + properties_extension) + one-shot
backfill from property_details.listing_events for pre-trigger history.
Tax reassessment forecast CO · Resets to sale price
- Current annual tax
- $1,600 · $133/mo
- Projected year-2 tax
- $1,600 · $133/mo
- Expected delta
- $0/yr ($0/mo · 0.0%)
ⓘ Screening estimate from a state-policy table — verify with the county assessor before closing.
Climate risk First Street
- Flood 1/10 Low FEMA zone X (unshaded) · 0% chance over 30 yrs
- Wildfire 6/10 Major
- Heat 3/10 Moderate 7 d/yr ≥91°F today · 19 d/yr by 30 yrs out
- Wind 2/10 Low
- Air quality 1/10 Low 0 unhealthy d/yr today · 0 by 30 yrs out
Nearby sold comps map
Loading sold comps map…
Walkable amenities ~0.75 mi
Loading nearby amenities…
Taxation est. · year 1
- Rental income
- $21,966
- − Mortgage interest
- −$7,002
- − Property taxes
- −$1,600
- − Insurance
- −$625
- − Repairs & maintenance
- −$1,757
- − Management
- −$1,757
- − Depreciation
- −$3,636
- Taxable income
- $5,589
- Est. tax owed @ 24.0%
- −$1,341
- After-tax cash flow
- $5,921/yr
For passive investors: Depreciation is non-cash, so a rental often shows a tax loss while cash-flowing — sheltering income. Rental losses are passive: they offset passive income freely, and up to $25,000/yr can offset ordinary (W-2) income if you actively participate and your MAGI is under $100k (phasing out to $0 by $150k); unused losses carry forward. On sale, claimed depreciation is recaptured at up to 25%, and gains may owe capital-gains tax (a 1031 exchange can defer both). Figures are a year-1 estimate at your 24.0% rate — not tax advice; consult a CPA.
Schools (NCES district)
- District
- Harrison School District No. 2 In The County Of El Paso An
- NCES district ID
- 0804530
- Math proficiency
- 16% ▼ -13.00%
- Reading proficiency
- 35% ▼ -7.00%
- Median HH income
- $40,242
- Composite
- 21.47/100
- National rank
- #8333
- State rank
- #67 of 86 in CO
Livability — Stratmoor
- Score
- 65/100
- State rank
- #156
- US rank
- #12505
Category grades
Schools grade is shown separately in the Schools card above.
Census & demographics
- Census place
- Stratmoor, CO
- County
- El Paso County · 689,348 people
- Metro
- Colorado Springs, CO
- Population (ZIP)
- 37,502
- Household income
- $89,984
- Rent vs Own
- Severe rent burden
- 1572.0
Population outlook (El Paso County) Hauer SSP2
- Today (2025)
- 768,926 people
- By 2030
- 815,739 · +6.1%
- By 2040
- 903,489 · +17.5%
- By 2050
- 981,204 · +27.6%
- By 2075
- 1,155,542 · +50.3%
- By 2100
- 1,202,070 · +56.3%
Race, ethnicity, and origin ACS 2023
- Neighborhood character
- Predominantly White (70%)
- Race & ethnicity
- White 70% Hispanic / Latino 18% Two or more races 11% Black 4% Asian 3% Native American 1%
- Hispanic origin (detail)
- Mexican 8% Puerto Rican 2%
- Common ancestry
- Italian 3% Romanian 3% Slovak 3%
- Foreign-born
- 7% · Canada, South Korea, Vietnam
- Languages at home
- 89% English-only · Spanish 6% Russian/Polish/Slavic 1% German/W. Germanic 1%
Political lean MEDSL · El Paso
- 2024 margin
- Lean R (+9.8) · D 43.8% · R 53.5% · Other 2.7%
- 2008→2024 swing
- +9.0pp toward D · 2008: -18.8pp · 2024: -9.8pp
- All cycles
- 2024: R+9.8 2020: R+10.8 2016: R+22.6 2012: R+21.4 2008: R+18.8
Not yet ingested
- Civics
- —
Market trends
- HPI YoY
- ▼ -272.61%
- Current HPI
- 248.2125
- Rent YoY
- ▼ -0.43%
- Metro
- Colorado Springs, CO
- State GDP YoY
- ▲ 1.95%
- F500 in state
- 14
Industry mix (Fortune 500 HQ in CO)
| Industry | F500 HQs | Revenue |
|---|---|---|
| Technology Distribution | 1 | $31B |
|
||
| Food / Agriculture | 1 | $18B |
|
||
| Packaging | 1 | $14B |
|
||
| Healthcare | 1 | $13B |
|
||
| Energy | 1 | $10B |
|
||
| Technology | 1 | $4B |
|
||
Price history
+512.7% since first listed9 events — show timeline
- 2026-05-08 Listed $125,000 elevateMLS
- 2022-07-18 Sold (Public Records) $332,500 Public Records
- 2017-09-11 Sold (Public Records) $212,500 Public Records
- 2016-11-18 Price Changed $125,000 elevateMLS
- 2016-07-29 Price Changed $130,000 elevateMLS
- 2016-06-10 Price Changed $140,000 elevateMLS
- 2008-04-07 Sold (Public Records) $122,000 Public Records
- 1999-07-07 Sold (Public Records) $87,900 Public Records
- 1973-11-01 Sold (Public Records) $20,400 Public Records
Property tax history
+7.3%/yrLatest (2024): $1,600 · +42.8% YoY. Source: county tax records.
Cash-flow waterfall
monthlySold comps — $/sqft
last 12 mo · ≤1 miLoading sold comps…