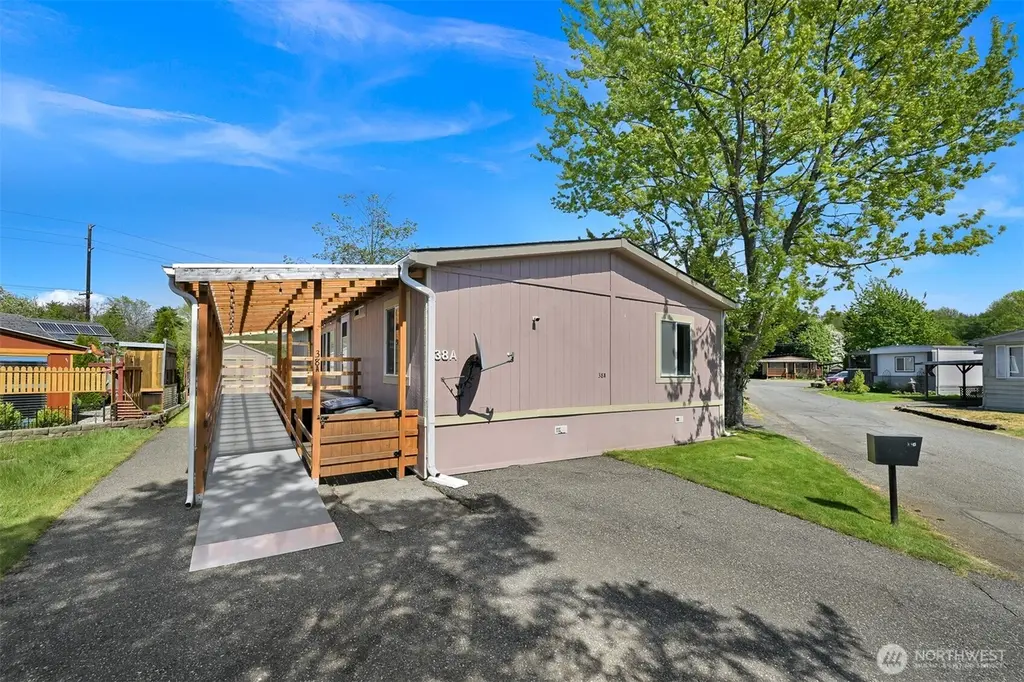
2400 Donovan Ave Unit 38A · Bellingham, WA
Flood risk 4/10 · Minor
- FEMA flood zone
- X (unshaded)
- Chance of flooding over 30 yrs
- 0.24%
- Est. flood insurance / yr
- $507 – $1,088
Fire risk 2/10 · Minimal
- Est. fire insurance / yr
- $604 – $1,122
Heat risk 3/10 · Minor
- Hot days now (above 83°F)
- 8 days/yr
- Hot days in 30 yrs
- 20 days/yr
Wind risk 1/10 · Minimal
- Chance of severe wind over 30 yrs
- —
Air-quality risk 6/10 · Moderate
- Unhealthy air days now
- 9 days/yr
- Unhealthy air days in 30 yrs
- 10 days/yr
Risk factors via First Street. Map © Google.
Why this score? — see what drove the B grade
The composite is a weighted blend of 9 inputs, each scored 0–100. Each bar is that input's sub-score; the figure is the points it added to the 100-point composite (weight × sub-score).
- Cash flow +30.0/30.0
- ARV discount +11.9/15.0
- DSCR +10.0/10.0
- 1% rule +8.6/10.0
- Schools +4.8/10.0
- Livability +4.0/5.0
- Rent growth +3.2/5.0
- Condition / age +2.5/5.0
- Appreciation +0.0/10.0
$225,000
🖨 Deal sheet 📄 Offer letter ✓ Due diligence
Listing remarks
Discover Fairhaven’s most affordable gem! This charming 3-bedroom, 2-bath, 1,512 sq. ft. home offers an inviting open-concept design with all the features you’ll love. The kitchen features bar seating and a dining area + breakfast nook, complemented by laminate floors for a modern touch (no carpet). Vaulted ceilings flow seamlessly into the living area, where two ceiling fans keep the space comfortable year-round. The spacious primary suite boasts an oversized shower plus an auxiliary shower, while the guest bathroom offers a full bath with a tub. Bonus office or den with French doors. Located in a welcoming 55+ community, this home is brimming with potential and perfectly situa
Key facts
- Open-concept design
- Laminate floors
- Ceiling fans
Tags
Property features AI
Finance
- Other: Bus route nearby (Route 14)
- Financial info: Land lease: $800; Listing terms: Cash
- HOA & community: Located in South End Mobile Estates (park approved for sale); Clubhouse in park; 83 homes in park; Senior community; Pets allowed: cats and dogs (see remarks)
Exterior
- Parking: Open/uncovered parking; 2 open parking spaces
- Security: Security system
- Utilities: Public water; City sewer; Electric service; Electric water heater; Puget Sound Energy power
- Home design: Manufactured double-wide home; One level; Southeast-facing entry
- Construction: Wood construction; Composition roof; Pillar/Post/Pier foundation; Manufactured after 6/15/1976; Skirted with wood
- Exterior features: Wood exterior materials; Patio/porch/deck; Paved lot; Shed for storage; Has view
Interior
- Kitchen: Dishwasher; Stove/Range; Refrigerator
- Bedrooms: 3 bedrooms
- Flooring: Laminate; Vinyl
- Bathrooms: 1 full bath; 1 three-quarter bath; 1 bathtub; 3 showers
- Heating & cooling: Forced air heating; Has cooling
- Interior features: Water heater; Skylights; Vaulted ceilings; Ceiling fan(s); Walk-in closet; Bath off primary; Security system
- Laundry & utility: Washer; Dryer; Utility room
Neighborhood map
What this means for you Summary
Snapshot
- This is a 3-bed/2.0-bath manufactured listed at $225k.
Deal economics
- At list price, monthly cash flow is $997 ($12k/yr) — positive.
- The deal already cash-flows at list — no discount required.
- Meets the 1% rule at list price ($3k rent vs $225k).
- Recommended offer: $222k (1.5% below list) — sets the bar for market timing.
- Cap rate 11.6% vs local median 2.0% in Bellingham — top-decile yield for the area; either an underpriced asset or a hidden risk that comps aren't pricing in. Stress-test before assuming the spread holds.
Location & tenants
- Location reads 80/100 on livability (#102 in WA, #1,947 nationally) — a professional / high-income tenant draw. Strengths: amenities A+, commute A+, health & safety A+; Watch: crime F, cost of living F.
- Bellingham School District (urban): math 47% / reading 63% proficiency, ranked #106 of 291 in WA (top 36%) — acceptable for families but not a draw, mixed tenant base, ~2y average lease.
- Zoned schools: Sehome High School (1,163 students, 25% FRL).
- Market conditions: Rents rising (+2.7%/yr); 235 active listings in the ZIP; 12 comparable units currently listed for rent nearby; rentals at typical pace (median 21d on market — plan ~3-4 weeks tenant-placement turnaround); 1,190 units permitted in Whatcom County in 2024 (327 in 5+ unit buildings).
- At $3,051/mo this rent would consume 57% of the median local household income ($64k/yr) (locally 4351% of renters already pay >50% of income on rent) — very limited rent-growth headroom before tenants either downsize or default.
Forward outlook
- Local home prices are declining (-3.0%/yr); year-one equity from $2k of loan paydown is wiped out by about $7k of value loss. Plan a longer hold.
- Whatcom County population projected at +28% by 2050 — long-run rental-demand tailwind backs the buy-and-hold thesis.
- At projected returns (-3.0% appreciation + 2.7% rent growth), your $63k cash investment doubles in ~7 years — after that, you're playing with house money.
Negotiation context
- It's been on market 23 days — a 2% lower offer ($222k) is reasonable based on typical stale-listing flexibility.
- 6 sale attempts since 17y ago; this cycle's ask has dropped $25k (10%) from the opening price — seller is motivated, your offer sets the floor, not the list.
Questions for the listing agent
- Is there a deadline driving the sale (1031 exchange, divorce, estate, relocation)? That informs how much negotiation room exists.
- Schools are B-rated — typically a magnet for longer-tenancy family renters. What's the average tenant stay here, and is there a school-zone premium baked into asking?
- Crime grade is F in this area — have there been break-ins, vandalism, or insurance claims at this property in the last 3 years? What carrier currently insures it and at what premium?
- What's the average days-on-market for RENTAL listings here right now (not sales)? A rising rental-DOM trend means longer vacancies and softer asking-rent achievability than the comps imply.
- What's the recent tenant-quality profile in this submarket — average credit score on applications, eviction rate, late-payment / NSF rate, and stable-employment percentage? A property-management company in the area should have these aggregated.
- How much new for-sale + rental construction is in the pipeline within 1–3 miles? Heavy new supply typically softens prices + rents 12–24 months out; constrained supply supports both.
Investment metrics
- 1% rule
- 1.36% ✓
- Cap rate
- 11.61%
- Cash-on-cash
- 18.99%
- DSCR
- 1.84
- GRM
- 6.1
CMA / ARV
- ARV (on-the-fly)
- $249,480
- Comps found
- 12
Show comp detail 12 sales within ~0.75 mi
| Address | Dist | Beds/Ba | Sqft | Sold | Price | $/sf | Match |
|---|---|---|---|---|---|---|---|
| 2015 24th St #102 | 0.11mi | 3/2.0 | 1,555 (+3%) | 11mo | $185,000 | $119 | 81 |
| 2015 24th St #94 | 0.10mi | 2/2.0 (-1) | 1,590 (+5%) | 2mo | $215,000 | $135 | 81 |
| 2015 24th St #24 | 0.16mi | 3/2.0 | 1,539 (+2%) | 16mo | $250,000 | $162 | 76 |
| 2015 24th #44 | 0.22mi | 2/2.5 (-1) | 1,479 (-2%) | 11mo | $340,000 | $230 | 70 |
| 2015 24th St #31 | 0.22mi | 2/2.0 (-1) | 1,426 (-6%) | 6mo | $235,000 | $165 | 70 |
| 2015 24th St #82 | 0.17mi | 2/2.0 (-1) | 1,498 (-1%) | 18mo | $255,000 | $170 | 70 |
| 2015 24th St | 0.15mi | 3/2.0 | 1,298 (-14%) | 1mo | $335,000 | $258 | 68 |
| 2400 Donovan Ave #66 | 0.00mi | 2/2.0 (-1) | 1,386 (-8%) | 18mo | $105,000 | $76 | 66 |
| 2015 24th St #10 | 0.08mi | 2/2.0 (-1) | 1,303 (-14%) | 10mo | $230,000 | $177 | 60 |
| 425 Chuckanut Dr N #37 | 0.72mi | 3/2.0 | 1,512 (0%) | 15mo | $238,500 | $158 | 54 |
| 425 Chuckanut Dr #16 | 0.66mi | 2/2.0 (-1) | 1,604 (+6%) | 15mo | $134,000 | $84 | 42 |
| 425 Chuckanut Dr N #5 | 0.70mi | 2/2.0 (-1) | 1,296 (-14%) | 6mo | $330,000 | $255 | 33 |
Match score weights: distance 35% · size 25% · config 20% · recency 20%. Top-matched comps best support the ARV.
Projected returns pro-forma
-3.0% appreciation · 2.67% rent growth · sell at horizon
- IRR
- 10.5%
- Equity multiple
- 1.41×
- Total profit
- $25,974
- Equity at exit
- $33,548
- IRR
- 19.3%
- Equity multiple
- 2.59×
- Total profit
- $100,082
- Equity at exit
- $19,454
Cash invested: $63,000 (down + closing). Projections, not guarantees.
Landlord ↔ Tenant lean methodology
- Overall (STATE)
- 28 Tenant-Leaning
- State Washington
- 28 Tenant-Leaning · D+8
- County
- — inherits STATE
- City
- — inherits STATE
ZIP-level market 98225
- Rents YoY
- 2.7%
- Active inventory
- 235
- Price-to-rent
- 6.1×
Monthly cashflow live
- Estimated rent
- $3,051 high interval (Pro) →
- Mortgage (P&I)
- −$1,180
- Tax from tax record
- −$140 /mo · $1,679/yr
- Insurance
- −$94
- HOA
- −$0
- Vacancy / Maint / Mgmt
- −$641
- Net cashflow
- $997
Break-even live
UW: 25.0% down · 7.5% · 30yr · 1.5% tax · 5.0% vac · 8.0% maint · 8.0% mgmt
Financing live
Cash to close
- Down payment
- $56,250
- Closing costs
- $6,750
- Reserves months
- —
- Total cash needed
- —
Loan-product check · same deal, 3 products live
Conventional
25% down · 7.5% · 30yr
- Down + closing
- —
- Monthly P&I
- —
- Monthly cashflow
- —
- DSCR
- —
- Eligible?
- —
Personal DTI + credit; lowest rate.
DSCR
20% down · 8.5% · 30yr
- Down + closing
- —
- Monthly P&I
- —
- Monthly cashflow
- —
- DSCR
- —
- Eligible?
- —
No personal income docs; deal must DSCR.
Hard money
10% down · 12.0% · 12mo
- Down + closing
- —
- Monthly P&I
- —
- Monthly cashflow
- —
- DSCR
- —
- Eligible?
- —
Short-term bridge; refi at stabilization.
Rent comps 12 comps
| Address | Beds | Baths | Sqft | Rent | $/sqft | DOM | Units | Dist |
|---|---|---|---|---|---|---|---|---|
| 1326 22nd St Bellingham, WA | 4.0 | 2.0 | 1296 | $3,450 | $2.66 | 21d | 1 | 0.31mi |
| 1324 22nd St Bellingham, WA | 4.0 | 2.0 | 1296 | $3,450 | $2.66 | 21d | 1 | 0.31mi |
| 1310 22nd St Bellingham, WA | 4.0 | 2.0 | 1296 | $3,450 | $2.66 | 21d | 1 | 0.35mi |
| 2120 Harris Ave Bellingham, WA | 4.0 | 2.0 | 1296 | $3,450 | $2.66 | 21d | 1 | 0.35mi |
| 2170 Douglas Ave Bellingham, WA | 3.0–4.0 | 2.0 | 1069 | $2,325 | $2.17 | 13d | 4 | 0.62mi |
| 1002 21st St Bellingham, WA | 3.0 | 2.0 | 1300 | $2,550 | $1.96 | 21d | 1 | 0.65mi |
| 2305 Douglas Ave Bellingham, WA | 1.0–4.0 | 1.0–4.0 | 1089 | $2,898 | $2.66 | 13d | 16 | 0.65mi |
| 919 24th St Bellingham, WA | 4.0 | 2.0 | 1322 | $3,195 | $2.42 | 13d | 1 | 0.66mi |
| 930 22nd St Bellingham, WA | 1.0–3.0 | 1.0–2.0 | 900 | $2,580 | $2.87 | 21d | 5 | 0.68mi |
| 506 Cypress Rd Bellingham, WA | 3.0 | 2.0 | 1950 | $3,320 | $1.70 | 13d | 1 | 0.94mi |
| 524 32nd St Bellingham, WA | 3.0 | 2.0 | 1100 | $2,480 | $2.25 | 21d | 3 | 1.04mi |
| 3805 Elwood Ave Bellingham, WA | 4.0 | 1.0–2.5 | 1213 | $3,079 | $2.54 | 13d | 49 | 1.39mi |
Listing history 17 events
-
2026-06-01status $225,000 Pending 23 DOM
-
2026-05-31days on market $225,000 Active 23 DOM
-
2026-05-30days on market $225,000 Active 22 DOM
-
2026-05-08$249,900 Active
-
2022-06-24soldstatus $215,000 Closed
-
2022-06-02status Pending
-
2022-03-30$249,900 Active
-
2022-03-30Active
-
2016-06-28historical
-
2016-06-10soldstatus $53,250 Sold
-
2016-05-20status Pending Inspection
-
2016-05-14$52,000 Active
-
2009-09-11soldstatus $51,500 Sold
-
2009-08-10status Pending
-
2009-06-23status
-
2009-06-12historical
-
2009-06-03$59,900
ⓘ Source: listings_history table (triggers on properties + properties_extension) + one-shot
backfill from property_details.listing_events for pre-trigger history.
Tax reassessment forecast WA · Resets to sale price
- Current annual tax
- $1,679 · $140/mo
- Projected year-2 tax
- $2,205 · $184/mo
- Expected delta
- +$526/yr (+$44/mo · 31.3%)
ⓘ Screening estimate from a state-policy table — verify with the county assessor before closing.
Climate risk First Street
- Flood 4/10 Moderate FEMA zone X (unshaded) · 24% chance over 30 yrs
- Wildfire 2/10 Low
- Heat 3/10 Moderate 8 d/yr ≥83°F today · 20 d/yr by 30 yrs out
- Wind 1/10 Low
- Air quality 6/10 Major 9 unhealthy d/yr today · 10 by 30 yrs out
Nearby sold comps map
Loading sold comps map…
Walkable amenities ~0.75 mi
Loading nearby amenities…
Taxation est. · year 1
- Rental income
- $36,613
- − Mortgage interest
- −$12,603
- − Property taxes
- −$1,679
- − Insurance
- −$1,125
- − Repairs & maintenance
- −$2,929
- − Management
- −$2,929
- − Depreciation
- −$6,545
- Taxable income
- $8,802
- Est. tax owed @ 24.0%
- −$2,112
- After-tax cash flow
- $9,849/yr
For passive investors: Depreciation is non-cash, so a rental often shows a tax loss while cash-flowing — sheltering income. Rental losses are passive: they offset passive income freely, and up to $25,000/yr can offset ordinary (W-2) income if you actively participate and your MAGI is under $100k (phasing out to $0 by $150k); unused losses carry forward. On sale, claimed depreciation is recaptured at up to 25%, and gains may owe capital-gains tax (a 1031 exchange can defer both). Figures are a year-1 estimate at your 24.0% rate — not tax advice; consult a CPA.
Schools (NCES district)
- District
- Bellingham School District
- NCES district ID
- 5300420
- Math proficiency
- 47% ▼ -6.00%
- Reading proficiency
- 63% ▼ -1.00%
- Median HH income
- $47,678
- Composite
- 48.49/100
- National rank
- #4632
- State rank
- #106 of 291 in WA
Livability — Bellingham
- Score
- 80/100
- State rank
- #102
- US rank
- #1947
Category grades
Schools grade is shown separately in the Schools card above.
Census & demographics
- Census place
- Bellingham, WA
- County
- Whatcom County · 209,776 people
- City population
- 130,296
- Metro
- Bellingham, WA
- Population (ZIP)
- 50,216
- Household income
- $63,941
- Rent vs Own
- Severe rent burden
- 4351.0
Population outlook (Whatcom County) Hauer SSP2
- Today (2025)
- 240,408 people
- By 2030
- 254,667 · +5.9%
- By 2040
- 281,365 · +17.0%
- By 2050
- 307,592 · +27.9%
- By 2075
- 375,576 · +56.2%
- By 2100
- 421,637 · +75.4%
Race, ethnicity, and origin ACS 2023
- Neighborhood character
- Predominantly White (78%)
- Race & ethnicity
- White 78% Hispanic / Latino 10% Two or more races 9% Asian 4% Black 1%
- Hispanic origin (detail)
- Mexican 5%
- Common ancestry
- Italian 5% Portuguese 5% Slovak 4%
- Foreign-born
- 7% · Canada, China, Vietnam
- Languages at home
- 89% English-only · Spanish 6% Chinese 1% Other Indo-European 1%
Political lean MEDSL · Whatcom
- 2024 margin
- Strong D (+24.9) · D 60.8% · R 35.9% · Other 3.3%
- 2008→2024 swing
- +6.9pp toward D · 2008: 18.0pp · 2024: 24.9pp
- All cycles
- 2024: D+24.9 2020: D+23.9 2016: D+17.7 2012: D+12.1 2008: D+18.0
Not yet ingested
- Civics
- —
Market trends
- HPI YoY
- ▼ -1126.32%
- Current HPI
- 463.2721
- Rent YoY
- ▲ 2.67%
- Metro
- Bellingham, WA
- State GDP YoY
- ▲ 4.65%
- F500 in state
- 22
Industry mix (Fortune 500 HQ in WA)
| Industry | F500 HQs | Revenue |
|---|---|---|
| Retail | 2 | $269B |
|
||
| Technology / Retail | 1 | $638B |
|
||
| Technology | 1 | $245B |
|
||
| Telecommunications | 1 | $38B |
|
||
| Food / Beverage | 1 | $36B |
|
||
| Automotive / Trucks | 1 | $34B |
|
||
Price history
+317.2% since first listed14 events — show timeline
- 2026-05-08 Listed $249,900 NWMLS as Distributed by MLS Grid
- 2022-06-24 Sold (MLS) $215,000 NWMLS as Distributed by MLS Grid
- 2022-06-02 Pending — NWMLS as Distributed by MLS Grid
- 2022-03-30 Listed — NWMLS as Distributed by MLS Grid
- 2022-03-30 Listed $249,900 NWMLS as Distributed by MLS Grid
- 2016-06-28 Delisted — NWMLS as Distributed by MLS Grid
- 2016-06-10 Sold (MLS) $53,250 NWMLS as Distributed by MLS Grid
- 2016-05-20 Pending — NWMLS as Distributed by MLS Grid
- 2016-05-14 Listed $52,000 NWMLS as Distributed by MLS Grid
- 2009-09-11 Sold (MLS) $51,500 NWMLS as Distributed by MLS Grid
- 2009-08-10 Pending — NWMLS as Distributed by MLS Grid
- 2009-06-23 Relisted — NWMLS as Distributed by MLS Grid
- 2009-06-12 Delisted — NWMLS as Distributed by MLS Grid
- 2009-06-03 Listed $59,900 NWMLS as Distributed by MLS Grid
Property tax history
+6.6%/yrLatest (2026): $1,679 · +125.1% YoY. Source: county tax records.
Cash-flow waterfall
monthlySold comps — $/sqft
last 12 mo · ≤1 miLoading sold comps…