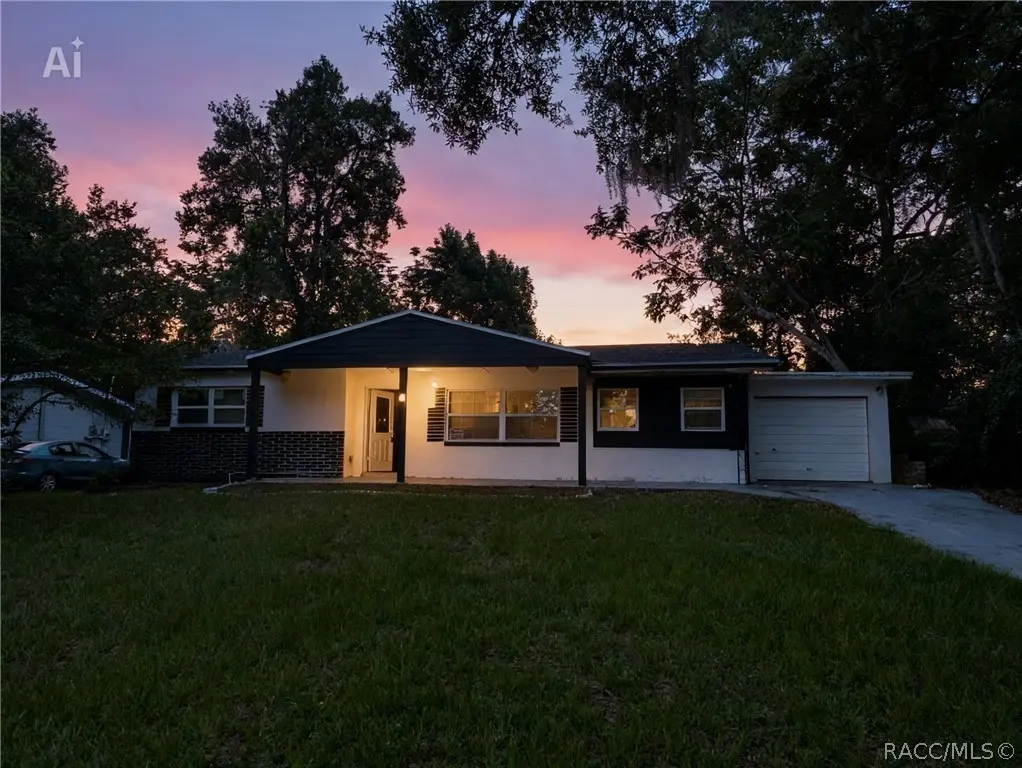
11 S Tyler St · Beverly Hills, FL
Flood risk 1/10 · Minimal
- FEMA flood zone
- X (unshaded)
- Chance of flooding over 30 yrs
- 0.0%
- Est. flood insurance / yr
- $507 – $1,088
Fire risk 4/10 · Minor
- Est. fire insurance / yr
- $947 – $1,759
Heat risk 9/10 · Severe
- Hot days now (above 108°F)
- 7 days/yr
- Hot days in 30 yrs
- 23 days/yr
Wind risk 9/10 · Severe
- Chance of severe wind over 30 yrs
- 99.0%
Air-quality risk 1/10 · Minimal
- Unhealthy air days now
- 0 days/yr
- Unhealthy air days in 30 yrs
- 0 days/yr
Risk factors via First Street. Map © Google.
Why this score? — see what drove the C+ grade
The composite is a weighted blend of 9 inputs, each scored 0–100. Each bar is that input's sub-score; the figure is the points it added to the 100-point composite (weight × sub-score).
- Cash flow +22.6/30.0
- ARV discount +15.0/15.0
- DSCR +7.3/10.0
- 1% rule +6.1/10.0
- Schools +4.1/10.0
- Livability +3.2/5.0
- Rent growth +2.5/5.0
- Condition / age +2.5/5.0
- Appreciation +0.0/10.0
$140,000
🖨 Deal sheet 📄 Offer letter ✓ Due diligence
Listing remarks
Located in the heart of Beverly Hills, this 3-bedroom, 1-bathroom home is a great opportunity for investors or buyers looking for their next fix-and-flip project. The heavy lifting has already been started by the previous owner, with major updates already completed including a new roof, new A/C system, and new water heater. With some additional work and vision, this property has the potential to become a great investment or starter home. Conveniently located near shopping, restaurants, schools, and everyday essentials, this home offers both value and location. Whether you’re an investor searching for your next project or a buyer looking to add your personal touch, this could be the op
Key facts
- New a/c system
- New water heater
- New roof
Tags
Property features AI
Exterior
- Parking: Attached garage (1 space); Paved driveway
- Utilities: Public water; Public sewer
- Home design: Single-family residence; One story
- Construction: Stucco construction; Asphalt shingle roof; Block and slab foundation; Built as residential single-family home
- Exterior features: Level lot; Paved roads and driveway; City street frontage; Publicly maintained road; No pool
Interior
- Kitchen: Oven; Range; Refrigerator
- Flooring: Tile
- Bathrooms: 1 full bathroom
- Heating & cooling: Central air
- Interior features: Oven, Range, Refrigerator; Tile flooring; Central air conditioning
Neighborhood map
What this means for you Summary
Snapshot
- This is a 3-bed/1.0-bath single-family listed at $140k.
Deal economics
- At list price, monthly cash flow is $239 ($3k/yr) — positive.
- The deal already cash-flows at list — no discount required.
- Meets the 1% rule at list price ($2k rent vs $140k).
- Recommended offer: $138k (1.5% below list) — sets the bar for market timing.
- Cap rate 8.3% vs local median 5.8% in Beverly Hills — top-decile yield for the area; either an underpriced asset or a hidden risk that comps aren't pricing in. Stress-test before assuming the spread holds.
Location & tenants
- Location reads 64/100 on livability (#666 in FL) — a middle-class / working-renter tenant base. Strengths: cost of living A+, housing A+, health & safety A+; Watch: amenities F, commute F, employment F.
- Citrus (rural): math 49% / reading 50% proficiency, ranked #44 of 73 in FL (top 60%) — families likely to look elsewhere, expect single-tenant / working-renter base with shorter leases.
- Zoned schools: Forest Ridge Elementary School (math 55% / reading 59%, grade C+, #781 of 2,144 statewide, top 38%, 708 students, 67% FRL); Citrus Springs Middle School (math 55% / reading 54%, grade B-, #183 of 571 statewide, top 34%, 821 students, 59% FRL); Lecanto High School (math 46% / reading 53%, grade D, #179 of 667 statewide, top 29%, 1,630 students, 46% FRL) — zoned schools at 57% FRL track the district average.
- Market conditions: 396 active listings in the ZIP; 20 comparable units currently listed for rent nearby; rentals at typical pace (median 21d on market — plan ~3-4 weeks tenant-placement turnaround); 2,443 units permitted in Citrus County in 2024 (0 in 5+ unit buildings).
- This rent runs 34% of the median local income ($55k/yr) — at the standard rent-burdened threshold; future hikes will face affordability resistance.
Forward outlook
- Local home prices are declining (-3.0%/yr); year-one equity from $968 of loan paydown is wiped out by about $4k of value loss. Plan a longer hold.
- Citrus County population projected to shrink 10% by 2050 — rents likely to lag national; underwrite the cash flow, not the appreciation.
Negotiation context
- It's been on market 22 days — a 2% lower offer ($138k) is reasonable based on typical stale-listing flexibility.
- 4 sale attempts since 25y ago with the ask held roughly flat each time — persistent listings suggest the price (not the market) is what's stuck; bring a comps-based counter.
- Current owner paid $90k; list at $140k implies a 56% gain — meaningful room to come down on a strong offer.
Risks & watch-outs
- Climate carrying-cost: severe wind risk, 99% chance of damaging wind over 30y; extreme-heat days projected 7→23/yr by 2055 (HVAC capex compounding) — expect insurance premiums to compound above CPI over the hold.
Questions for the listing agent
- Built in 1967 — when were the roof, HVAC, electrical panel, plumbing, and water heater last replaced?
- Is there a deadline driving the sale (1031 exchange, divorce, estate, relocation)? That informs how much negotiation room exists.
- Schools are F-rated, which usually means shorter tenancies and higher turnover. Who's the typical renter profile here, and what's been the actual vacancy rate?
- What's the average days-on-market for RENTAL listings here right now (not sales)? A rising rental-DOM trend means longer vacancies and softer asking-rent achievability than the comps imply.
- What's the recent tenant-quality profile in this submarket — average credit score on applications, eviction rate, late-payment / NSF rate, and stable-employment percentage? A property-management company in the area should have these aggregated.
- How much new for-sale + rental construction is in the pipeline within 1–3 miles? Heavy new supply typically softens prices + rents 12–24 months out; constrained supply supports both.
Investment metrics
- 1% rule
- 1.11% ✓
- Cap rate
- 8.34%
- Cash-on-cash
- 7.32%
- DSCR
- 1.33
- GRM
- 7.5
CMA / ARV
- ARV (on-the-fly)
- $205,020
- Comps found
- 12
Show comp detail 12 sales within ~0.75 mi
| Address | Dist | Beds/Ba | Sqft | Sold | Price | $/sf | Match |
|---|---|---|---|---|---|---|---|
| 62 S Tyler St | 0.37mi | 4/2.0 (+1) | 1,344 (+0%) | 1mo | $227,000 | $169 | 73 |
| 36 S Harrison St | 0.20mi | 3/1.0 | 1,208 (-10%) | 2mo | $150,000 | $124 | 73 |
| 15 S Fillmore St | 0.06mi | 3/2.0 | 1,159 (-14%) | 2mo | $195,000 | $168 | 69 |
| 7 N Adams St | 0.31mi | 2/1.0 (-1) | 1,196 (-11%) | 2mo | $170,000 | $142 | 61 |
| 23 N Tyler St | 0.26mi | 2/2.0 (-1) | 1,464 (+9%) | 4mo | $149,900 | $102 | 60 |
| 24 N Davis St | 0.33mi | 3/2.0 | 1,172 (-12%) | 2mo | $157,000 | $134 | 59 |
| 52 S Columbus St | 0.43mi | 2/2.0 (-1) | 1,446 (+8%) | 4mo | $192,500 | $133 | 55 |
| 5 S Melbourne St | 0.50mi | 2/1.0 (-1) | 1,204 (-10%) | 4mo | $156,000 | $130 | 52 |
| 9 James Ct | 0.73mi | 2/1.0 (-1) | 1,233 (-8%) | 1mo | $195,000 | $158 | 47 |
| 4385 N Bacall Loop | 0.51mi | 2/2.0 (-1) | 1,489 (+11%) | 2mo | $228,000 | $153 | 47 |
| 4360 N Mae West Way | 0.61mi | 2/2.0 (-1) | 1,214 (-9%) | 2mo | $210,000 | $173 | 46 |
| 6 Oak Hollow Dr | 0.55mi | 2/2.0 (-1) | 1,169 (-13%) | 2mo | $195,500 | $167 | 42 |
Match score weights: distance 35% · size 25% · config 20% · recency 20%. Top-matched comps best support the ARV.
Projected returns pro-forma
-3.0% appreciation · 3.0% rent growth · sell at horizon
- IRR
- -5.1%
- Equity multiple
- 0.81×
- Total profit
- $-7,425
- Equity at exit
- $20,874
- IRR
- 4.6%
- Equity multiple
- 1.34×
- Total profit
- $13,287
- Equity at exit
- $12,105
Cash invested: $39,200 (down + closing). Projections, not guarantees.
Landlord ↔ Tenant lean methodology
- Overall (STATE)
- 87 Strongly Landlord-Friendly
- State Florida
- 87 Strongly Landlord-Friendly · R+3
- County
- — inherits STATE
- City
- — inherits STATE
ZIP-level market 34465
- Home prices YoY
- -33.1%
- Active inventory
- 396
- Price-to-rent
- 7.5×
Monthly cashflow live
- Estimated rent
- $1,554 high interval (Pro) →
- Mortgage (P&I)
- −$734
- Tax from tax record
- −$196 /mo · $2,349/yr
- Insurance
- −$58
- HOA
- −$0
- Vacancy / Maint / Mgmt
- −$326
- Net cashflow
- $239
Break-even live
UW: 25.0% down · 7.5% · 30yr · 1.5% tax · 5.0% vac · 8.0% maint · 8.0% mgmt
Financing live
Cash to close
- Down payment
- $35,000
- Closing costs
- $4,200
- Reserves months
- —
- Total cash needed
- —
Loan-product check · same deal, 3 products live
Conventional
25% down · 7.5% · 30yr
- Down + closing
- —
- Monthly P&I
- —
- Monthly cashflow
- —
- DSCR
- —
- Eligible?
- —
Personal DTI + credit; lowest rate.
DSCR
20% down · 8.5% · 30yr
- Down + closing
- —
- Monthly P&I
- —
- Monthly cashflow
- —
- DSCR
- —
- Eligible?
- —
No personal income docs; deal must DSCR.
Hard money
10% down · 12.0% · 12mo
- Down + closing
- —
- Monthly P&I
- —
- Monthly cashflow
- —
- DSCR
- —
- Eligible?
- —
Short-term bridge; refi at stabilization.
Rent comps 20 comps
| Address | Beds | Baths | Sqft | Rent | $/sqft | DOM | Units | Dist |
|---|---|---|---|---|---|---|---|---|
| 41 S Monroe St Beverly Hills, FL | 2.0 | 1.0 | 932 | $1,300 | $1.39 | 21d | 1 | 0.28mi |
| 45 S Jackson St Beverly Hills, FL | 2.0 | 1.0 | 1108 | $1,275 | $1.15 | 21d | 1 | 0.28mi |
| 23 N Lee St Beverly Hills, FL | 2.0 | 1.0 | 1416 | $1,350 | $0.95 | 21d | 1 | 0.31mi |
| 17 N Davis St Beverly Hills, FL | 2.0 | 1.0 | 1108 | $1,000 | $0.90 | 21d | 1 | 0.31mi |
| 31 S Barbour St Beverly Hills, FL | 2.0 | 1.0 | 1027 | $1,525 | $1.48 | 21d | 1 | 0.35mi |
| 13 S Washington St Beverly Hills, FL | 3.0 | 1.0 | 1062 | $1,350 | $1.27 | 21d | 1 | 0.43mi |
| 42 Roosevelt Blvd Unit 1 Beverly Hills, FL | 3.0 | 1.5 | 1612 | $1,449 | $0.90 | 21d | 1 | 0.47mi |
| 95 S Fillmore St Beverly Hills, FL | 2.0 | 1.0 | 1056 | $1,300 | $1.23 | 21d | 1 | 0.64mi |
| 95 S Desoto St Beverly Hills, FL | 2.0 | 2.0 | 1152 | $1,435 | $1.25 | 21d | 1 | 0.70mi |
| 3263 N Maidencane Dr Beverly Hills, FL | 2.0 | 1.0 | 1380 | $1,350 | $0.98 | 21d | 1 | 0.78mi |
| 3660 N Laurelwood Loop Beverly Hills, FL | 2.0 | 2.5 | 1543 | $1,800 | $1.17 | 21d | 1 | 0.81mi |
| 209 S Tyler St Beverly Hills, FL | 2.0 | 2.0 | 1604 | $1,500 | $0.94 | 21d | 1 | 0.82mi |
| 661 W Twisted Oaks Dr Beverly Hills, FL | 4.0 | 2.0 | 1864 | $1,695 | $0.91 | 21d | 1 | 1.12mi |
| 703 W Sunbird Path Hernando, FL | 2.0 | 2.0 | 1298 | $1,700 | $1.31 | 21d | 1 | 1.14mi |
| 229 W Casurina Pl Beverly Hills, FL | 3.0 | 2.0 | 1604 | $1,399 | $0.87 | 21d | 1 | 1.17mi |
| 3442 N Tamarisk Ave Unit NA Beverly Hills, FL | 3.0 | 2.0 | 1530 | $1,800 | $1.18 | 21d | 1 | 1.21mi |
| 1984 W Marsten Ct Lecanto, FL | 3.0 | 2.0 | 1854 | $2,000 | $1.08 | 21d | 1 | 1.31mi |
| 174 W Romany Loop Beverly Hills, FL | 2.0 | 2.0 | 1748 | $2,200 | $1.26 | 21d | 1 | 1.35mi |
| 1882 W Angelica Loop Lecanto, FL | 3.0 | 2.0 | 1706 | $1,900 | $1.11 | 21d | 1 | 1.38mi |
| 144 W Sugarmaple Ln Beverly Hills, FL | 3.0 | 2.0 | 1600 | $1,700 | $1.06 | 21d | 1 | 1.43mi |
Listing history 34 events
-
2026-06-19days on market $140,000 Active 22 DOM
-
2026-06-18days on market $140,000 Active 21 DOM
-
2026-06-17days on market $140,000 Active 20 DOM
-
2026-06-16days on market $140,000 Active 19 DOM
-
2026-06-15days on market $140,000 Active 18 DOM
-
2026-06-14days on market $140,000 Active 16 DOM
-
2026-06-13days on market $140,000 Active 15 DOM
-
2026-06-10days on market $140,000 Active 13 DOM
-
2026-06-09days on market $140,000 Active 12 DOM
-
2026-06-08days on market $140,000 Active 11 DOM
-
2026-06-07days on market $140,000 Active 10 DOM
-
2026-06-03days on market $140,000 Active 6 DOM
-
2026-06-02days on market $140,000 Active 5 DOM
-
2026-06-01days on market $140,000 Active 4 DOM
-
2026-05-31days on market $140,000 Active 3 DOM
-
2026-05-30days on market $140,000 Active 2 DOM
-
2026-05-28$140,000 Active
-
2025-07-17price $162,000
-
2025-05-29price $167,000
-
2025-04-03price $172,000
-
2025-01-04price $177,000
-
2024-09-06price $216,500
-
2023-04-06price $49,990
-
2023-04-01$59,990 Active
-
2021-08-27soldstatus $90,000
-
2011-07-05soldstatus $32,000
-
2011-06-24soldstatus $32,000
-
2010-10-26$35,900
-
2004-03-22soldstatus $58,000
-
2001-05-11soldstatus $31,000
-
2001-04-06soldstatus $157,285
-
2001-04-05$35,900
-
1979-06-01soldstatus $28,000
-
1976-12-01soldstatus $23,000
ⓘ Source: listings_history table (triggers on properties + properties_extension) + one-shot
backfill from property_details.listing_events for pre-trigger history.
Tax reassessment forecast FL · Resets to sale price
- Current annual tax
- $2,349 · $196/mo
- Projected year-2 tax
- $2,349 · $196/mo
- Expected delta
- $0/yr ($0/mo · 0.0%)
ⓘ Screening estimate from a state-policy table — verify with the county assessor before closing.
Climate risk First Street
- Flood 1/10 Low FEMA zone X (unshaded) · 0% chance over 30 yrs
- Wildfire 4/10 Moderate
- Heat 9/10 Extreme 7 d/yr ≥108°F today · 23 d/yr by 30 yrs out
- Wind 9/10 Extreme 99% chance of damaging wind over 30 yrs
- Air quality 1/10 Low 0 unhealthy d/yr today · 0 by 30 yrs out
Nearby sold comps map
Loading sold comps map…
Walkable amenities ~0.75 mi
Loading nearby amenities…
Taxation est. · year 1
- Rental income
- $18,642
- − Mortgage interest
- −$7,842
- − Property taxes
- −$2,349
- − Insurance
- −$700
- − Repairs & maintenance
- −$1,491
- − Management
- −$1,491
- − Depreciation
- −$4,073
- Taxable income
- $696
- Est. tax owed @ 24.0%
- −$167
- After-tax cash flow
- $2,702/yr
For passive investors: Depreciation is non-cash, so a rental often shows a tax loss while cash-flowing — sheltering income. Rental losses are passive: they offset passive income freely, and up to $25,000/yr can offset ordinary (W-2) income if you actively participate and your MAGI is under $100k (phasing out to $0 by $150k); unused losses carry forward. On sale, claimed depreciation is recaptured at up to 25%, and gains may owe capital-gains tax (a 1031 exchange can defer both). Figures are a year-1 estimate at your 24.0% rate — not tax advice; consult a CPA.
Schools (NCES district)
- District
- Citrus
- NCES district ID
- 1200270
- Math proficiency
- 49% ▼ -10.00%
- Reading proficiency
- 50% ▼ -6.00%
- Median HH income
- $38,618
- Composite
- 41.28/100
- National rank
- #3519
- State rank
- #44 of 73 in FL
Livability — Beverly Hills
- Score
- 64/100
- State rank
- #666
- US rank
- #13671
Category grades
Schools grade is shown separately in the Schools card above.
Census & demographics
- Census place
- Beverly Hills, FL
- County
- Citrus County · 111,314 people
- City population
- 18,879
- Metro
- Homosassa Springs, FL
- Population (ZIP)
- 18,879
- Household income
- $54,869
- Rent vs Own
- Severe rent burden
- 334.0
Population outlook (Citrus County) Hauer SSP2
- Today (2025)
- 138,622 people
- By 2030
- 136,886 · -1.3%
- By 2040
- 132,009 · -4.8%
- By 2050
- 125,196 · -9.7%
- By 2075
- 108,570 · -21.7%
- By 2100
- 84,454 · -39.1%
Race, ethnicity, and origin ACS 2023
- Neighborhood character
- Predominantly White (82%)
- Race & ethnicity
- White 82% Hispanic / Latino 8% Black 4% Two or more races 3% Asian 2%
- Hispanic origin (detail)
- Mexican 1% Puerto Rican 3%
- Common ancestry
- Romanian 4% Lithuanian 3% Slovak 2%
- Foreign-born
- 8% · Canada, Vietnam, Dominican Republic
- Languages at home
- 93% English-only · Spanish 4% French/Haitian/Cajun 1% Other Asian/Pacific 1%
Political lean MEDSL · Citrus
- 2024 margin
- Solid R (+45.9) · D 26.8% · R 72.6%
- 2008→2024 swing
- -29.8pp toward R · 2008: -16.1pp · 2024: -45.9pp
- All cycles
- 2024: R+45.9 2020: R+41.0 2016: R+39.7 2012: R+21.9 2008: R+16.1
Not yet ingested
- Civics
- —
Market trends
- HPI YoY
- ▼ -138.62%
- Current HPI
- 279.7183
- Rent YoY
- —
- Metro
- Homosassa Springs, FL
- State GDP YoY
- ▲ 3.28%
- F500 in state
- 36
Industry mix (Fortune 500 HQ in FL)
| Industry | F500 HQs | Revenue |
|---|---|---|
| Industrial Technology | 2 | $29B |
|
||
| Insurance | 2 | $17B |
|
||
| Retail | 1 | $60B |
|
||
| Technology Distribution | 1 | $58B |
|
||
| Homebuilding | 1 | $35B |
|
||
| Technology Manufacturing | 1 | $35B |
|
||
Price history
+508.7% since first listed18 events — show timeline
- 2026-05-28 Listed $140,000 RACC
- 2025-07-17 Price Changed $162,000 RACC
- 2025-05-29 Price Changed $167,000 RACC
- 2025-04-03 Price Changed $172,000 RACC
- 2025-01-04 Price Changed $177,000 RACC
- 2024-09-06 Price Changed $216,500 RACC
- 2023-04-06 Price Changed $49,990 Stellar MLS as Distributed by MLS Grid
- 2023-04-01 Listed $59,990 Stellar MLS as Distributed by MLS Grid
- 2021-08-27 Sold (Public Records) $90,000 Public Records
- 2011-07-05 Sold (Public Records) $32,000 Public Records
- 2011-06-24 Sold (MLS) $32,000 RACC
- 2010-10-26 Listed $35,900 RACC
- 2004-03-22 Sold (Public Records) $58,000 Public Records
- 2001-05-11 Sold (MLS) $31,000 RACC
- 2001-04-06 Sold (Public Records) $157,285 Public Records
- 2001-04-05 Listed $35,900 RACC
- 1979-06-01 Sold (Public Records) $28,000 Public Records
- 1976-12-01 Sold (Public Records) $23,000 Public Records
Property tax history
+12.9%/yrLatest (2025): $2,349 · +4.2% YoY. Source: county tax records.
Cash-flow waterfall
monthlySold comps — $/sqft
last 12 mo · ≤1 miLoading sold comps…