 🌊 Lakefront
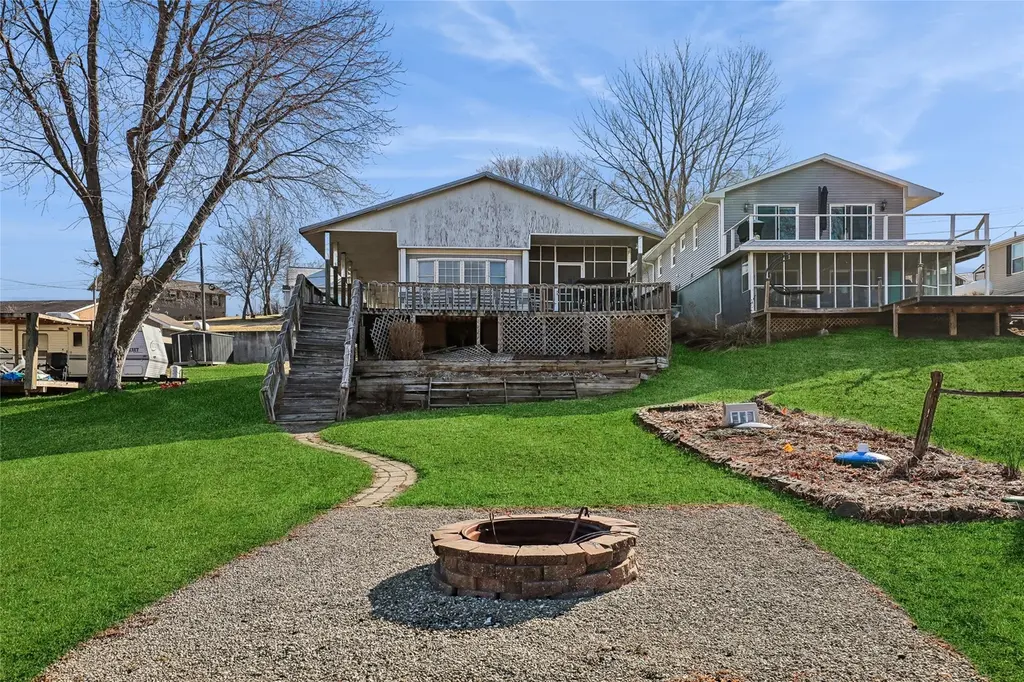
204 Eastside Ln · Montezuma, IA
Flood risk 1/10 · Minimal
- FEMA flood zone
- X (shaded)
- Chance of flooding over 30 yrs
- 0.0%
- Est. flood insurance / yr
- $507 – $1,088
Fire risk 3/10 · Minor
- Est. fire insurance / yr
- $902 – $1,676
Heat risk 3/10 · Minor
- Hot days now (above 103°F)
- 7 days/yr
- Hot days in 30 yrs
- 15 days/yr
Wind risk 2/10 · Minimal
- Chance of severe wind over 30 yrs
- —
Air-quality risk 2/10 · Minimal
- Unhealthy air days now
- 1 days/yr
- Unhealthy air days in 30 yrs
- 1 days/yr
Risk factors via First Street. Map © Google.
Why this score? — see what drove the F grade
The composite is a weighted blend of 9 inputs, each scored 0–100. Each bar is that input's sub-score; the figure is the points it added to the 100-point composite (weight × sub-score).
- Appreciation +10.0/10.0
- ARV discount +7.5/15.0
- Schools +6.5/10.0
- Livability +3.8/5.0
- Rent growth +2.5/5.0
- Condition / age +2.5/5.0
- Cash flow +1.3/30.0
- 1% rule +0.0/10.0
- DSCR +0.0/10.0
$368,000
🖨 Deal sheet (PDF) 📄 Offer letter ✓ Due diligence
Listing remarks MLS
Jump into lake life at an affordable price! This lakefront mobile home at Lake Ponderosa features 3 bedrooms, 2 bathrooms, and an open feel with the kitchen and living room to enjoy family. Then there is a bright, roomy four-season space that’s perfect for hanging out rain or shine that leads out to a screened in area and large deck. The flat lot makes outdoor fun easy, and the dock, lift, and calm water views let you enjoy the lake from day one. Don’t miss your chance—come see it today!
Key facts
- Large deck
- Four-season space
- Dock
Tags
Neighborhood map
What this means for you Summary
Snapshot
- This is a 3-bed/1.5-bath manufactured listed at $368k.
Deal economics
- At list price, monthly cash flow is $-1k ($-18k/yr) — negative.
- To cash-flow at today's rent, offer at most $109k (70.4% below list).
- To meet the 1% rule (rent ≥ 1% of price), the offer needs to be $101k (72.5% below list).
- Recommended offer: $101k (72.5% below list) — sets the bar for 1% rule.
Location & tenants
- Location reads 75/100 on livability (#228 in IA, #4,319 nationally) — a middle-class / working-renter tenant base. Strengths: crime A+, cost of living A+, housing A+; Watch: amenities F, commute F, employment F.
- Montezuma Community School District (rural): math 73% / reading 79% proficiency, ranked #55 of 289 in IA (top 19%) — strong family-tenant draw, lease renewals of 3-5y typical.
- Zoned schools: Montezuma Elementary School (math 92% / reading 77%, grade A+, #31 of 616 statewide, top 6%, 229 students, 34% FRL); Montezuma Junior High School (math 62% / reading 72%, grade A-, #140 of 246 statewide, top 60%, 112 students, 39% FRL); Montezuma High School (math 67% / reading 87%, grade A-, #60 of 336 statewide, top 21%, 148 students, 28% FRL).
- Market conditions: 67 active listings in the ZIP; 27 units permitted in Poweshiek County in 2024 (0 in 5+ unit buildings).
Forward outlook
- In year one you build about $39k of equity ($3k loan paydown + $37k appreciation (10.0% local appreciation)).
- Poweshiek County population projected to shrink 3% by 2050 — rents likely to lag national; underwrite the cash flow, not the appreciation.
- By year 2, paydown + projected appreciation supports a ~$63k cash-out refi (75% LTV) — recoverable capital for the next deal without selling this one.
Negotiation context
- It's been on market 101 days — a 9% lower offer ($335k) is reasonable based on typical stale-listing flexibility.
- 4 sale attempts since 8y ago with the ask held roughly flat each time — persistent listings suggest the price (not the market) is what's stuck; bring a comps-based counter.
- Current owner paid $205k; list at $368k implies a 80% gain — meaningful room to come down on a strong offer.
Questions for the listing agent
- What do current leases actually rent for vs. the listed asking? Can we see a recent rent roll and the last 12 months of T-12 income?
- It's been on market 101 days. Have you received any prior offers? Is the seller open to a 72% concession, seller financing, or rate buy-down credit?
- Built in 1976 — when were the roof, HVAC, electrical panel, plumbing, and water heater last replaced?
- Why hasn't it sold? Are there any deal-killer items the seller is aware of (foundation, flood, title, zoning, code violations)?
- Is there a deadline driving the sale (1031 exchange, divorce, estate, relocation)? That informs how much negotiation room exists.
- Schools are A-rated — typically a magnet for longer-tenancy family renters. What's the average tenant stay here, and is there a school-zone premium baked into asking?
- The area grade is low — what's the realistic commute time and amenity access for the typical tenant pool here? Any planned neighborhood developments (good or bad) we should know about?
- This sits on a lake — are riparian / water-frontage rights deeded with the parcel? Any dock permits, shoreline easements, or HOA water-use restrictions?
- What's the documented flood / surge / shoreline-erosion history here (FEMA AND non-FEMA — e.g., storm surge, creek backup, septic-field saturation)?
- Any water-quality or seasonal algae-bloom issues that affect tenant satisfaction or short-term-rental demand?
- What's the average days-on-market for RENTAL listings here right now (not sales)? A rising rental-DOM trend means longer vacancies and softer asking-rent achievability than the comps imply.
- What's the recent tenant-quality profile in this submarket — average credit score on applications, eviction rate, late-payment / NSF rate, and stable-employment percentage? A property-management company in the area should have these aggregated.
- How much new for-sale + rental construction is in the pipeline within 1–3 miles? Heavy new supply typically softens prices + rents 12–24 months out; constrained supply supports both.
Investment metrics
- 1% rule
- 0.28% ✗
- Cap rate
- 1.51%
- Cash-on-cash
- -17.08%
- DSCR
- 0.24
- GRM
- 30.3
CMA / ARV
- ARV (median comp)
- $794,398
- List price
- $368,000
- Delta
- -53.68%
- Verdict
- UNDERPRICED
- Comps
- 12 within 1.0 mi
Show comp detail 1 sale within ~0.75 mi
| Address | Dist | Beds/Ba | Sqft | Sold | Price | $/sf | Match |
|---|---|---|---|---|---|---|---|
| 108 Willow Rd | 1.22mi | 2/1.0 (-1) | 960 (+6%) | 14mo | $160,000 | $167 | 37 |
Match score weights: distance 35% · size 25% · config 20% · recency 20%. Top-matched comps best support the ARV.
Projected returns pro-forma
10.0% appreciation · 3.0% rent growth · sell at horizon
- IRR
- 12.5%
- Equity multiple
- 2.04×
- Total profit
- $106,849
- Equity at exit
- $331,524
- IRR
- 12.9%
- Equity multiple
- 4.76×
- Total profit
- $387,808
- Equity at exit
- $714,943
Cash invested: $103,040 (down + closing). Projections, not guarantees.
Landlord ↔ Tenant lean methodology
- Overall (STATE)
- 83 Strongly Landlord-Friendly
- State Iowa
- 83 Strongly Landlord-Friendly · R+6
- County
- — inherits STATE
- City
- — inherits STATE
ZIP-level market 50171
- Home prices YoY
- 9.3%
- Active inventory
- 67
- Price-to-rent
- 30.3×
Monthly cashflow live
- Estimated rent
- $1,012 medium interval (Pro) →
- Mortgage (P&I)
- −$1,930
- Tax from tax record
- −$183 /mo · $2,200/yr
- Insurance
- −$153
- HOA
- −$0
- Vacancy / Maint / Mgmt
- −$213
- Net cashflow
- $-1,467
Break-even live
Sensitivity live
| Price | -10% $-1,258 | -5% $-1,363 | +0% $-1,467 | +5% $-1,571 | +10% $-1,675 |
|---|---|---|---|---|---|
| Rent | -10% $-1,547 | -5% $-1,507 | +0% $-1,467 | +5% $-1,427 | +10% $-1,387 |
| Rate | -1.0pp $-1,281 | -0.5pp $-1,373 | base $-1,467 | +0.5pp $-1,562 | +1.0pp $-1,659 |
UW: 25.0% down · 7.5% · 30yr · 1.5% tax · 5.0% vac · 8.0% maint · 8.0% mgmt
Financing live
Cash to close
- Down payment
- $92,000
- Closing costs
- $11,040
- Reserves months
- —
- Total cash needed
- —
Loan-product check · same deal, 3 products live
Conventional
25% down · 7.5% · 30yr
- Down + closing
- —
- Monthly P&I
- —
- Monthly cashflow
- —
- DSCR
- —
- Eligible?
- —
Personal DTI + credit; lowest rate.
DSCR
20% down · 8.5% · 30yr
- Down + closing
- —
- Monthly P&I
- —
- Monthly cashflow
- —
- DSCR
- —
- Eligible?
- —
No personal income docs; deal must DSCR.
Hard money
10% down · 12.0% · 12mo
- Down + closing
- —
- Monthly P&I
- —
- Monthly cashflow
- —
- DSCR
- —
- Eligible?
- —
Short-term bridge; refi at stabilization.
Listing history 23 events
-
2026-06-22days on market $368,000 Active 101 DOM
-
2026-06-21days on market $368,000 Active 100 DOM
-
2026-06-21days on market $368,000 Active 99 DOM
-
2026-06-18days on market $368,000 Active 97 DOM
-
2026-06-17days on market $368,000 Active 96 DOM
-
2026-06-16days on market $368,000 Active 95 DOM
-
2026-06-15days on market $368,000 Active 94 DOM
-
2026-06-13days on market $368,000 Active 92 DOM
-
2026-06-12days on market $368,000 Active 91 DOM
-
2026-06-09days on market $368,000 Active 88 DOM
-
2026-06-08days on market $368,000 Active 87 DOM
-
2026-06-07pricedays on market $368,000 Active 86 DOM
-
2026-06-05days on market $378,000 Active 84 DOM
-
2026-06-04days on market $378,000 Active 82 DOM
-
2026-06-02days on market $378,000 Active 81 DOM
-
2026-06-01days on market $378,000 Active 80 DOM
-
2026-05-31days on market $378,000 Active 79 DOM
-
2026-05-31days on market $378,000 Active 78 DOM
-
2026-03-13$378,000 Active 510-char remark
Show marketing remark (510 chars)
Jump into lake life at an affordable price! This lakefront mobile home at Lake Ponderosa features 3 bedrooms, 2 bathrooms, and an open feel with the kitchen and living room to enjoy family. Then there is a bright, roomy four-season space that’s perfect for hanging out rain or shine that leads out to a screened in area and large deck. The flat lot makes outdoor fun easy, and the dock, lift, and calm water views let you enjoy the lake from day one. Don’t miss your chance—come see it today!
-
2020-06-08soldstatus $205,000
-
2020-05-16
-
2019-04-01$213,000
-
2018-08-07$235,000
ⓘ Source: listings_history table (triggers on properties + properties_extension) + one-shot
backfill from property_details.listing_events for pre-trigger history.
Tax reassessment forecast IA · Partial reset (capped growth)
- Current annual tax
- $2,200 · $183/mo
- Projected year-2 tax
- $3,989 · $332/mo
- Expected delta
- +$1,789/yr (+$149/mo · 81.3%)
ⓘ Screening estimate from a state-policy table — verify with the county assessor before closing.
Climate risk First Street
- Flood 1/10 Low FEMA zone X (shaded) · 0% chance over 30 yrs
- Wildfire 3/10 Moderate
- Heat 3/10 Moderate 7 d/yr ≥103°F today · 15 d/yr by 30 yrs out
- Wind 2/10 Low
- Air quality 2/10 Low 1 unhealthy d/yr today · 1 by 30 yrs out
Nearby sold comps map
Loading sold comps map…
Walkable amenities ~0.75 mi
Loading nearby amenities…
Taxation est. · year 1
- Rental income
- $12,148
- − Mortgage interest
- −$20,614
- − Property taxes
- −$2,200
- − Insurance
- −$1,840
- − Repairs & maintenance
- −$972
- − Management
- −$972
- − Depreciation
- −$10,705
- Taxable loss
- −$25,155
- Est. tax savings @ 24.0%
- +$6,037
- After-tax cash flow
- $-11,564/yr
For passive investors: Depreciation is non-cash, so a rental often shows a tax loss while cash-flowing — sheltering income. Rental losses are passive: they offset passive income freely, and up to $25,000/yr can offset ordinary (W-2) income if you actively participate and your MAGI is under $100k (phasing out to $0 by $150k); unused losses carry forward. On sale, claimed depreciation is recaptured at up to 25%, and gains may owe capital-gains tax (a 1031 exchange can defer both). Figures are a year-1 estimate at your 24.0% rate — not tax advice; consult a CPA.
Schools (NCES district)
- District
- Montezuma Community School District
- NCES district ID
- 1919590
- Math proficiency
- 73% ▼ -6.00%
- Reading proficiency
- 79% ▲ 3.00%
- Median HH income
- $57,449
- Composite
- 65.04/100
- National rank
- #503
- State rank
- #55 of 289 in IA
Livability — Montezuma
- Score
- 75/100
- State rank
- #228
- US rank
- #4319
Category grades
Schools grade is shown separately in the Schools card above.
Census & demographics
- City population
- 2,445
- Population (ZIP)
- 2,445
Population outlook (Poweshiek County) Hauer SSP2
- Today (2025)
- 18,601 people
- By 2030
- 18,342 · -1.4%
- By 2040
- 17,944 · -3.5%
- By 2050
- 18,029 · -3.1%
- By 2075
- 19,945 · +7.2%
- By 2100
- 22,637 · +21.7%
Race, ethnicity, and origin ACS 2023
- Neighborhood character
- Predominantly White (93%)
- Race & ethnicity
- White 93% Two or more races 5% Hispanic / Latino 3%
- Common ancestry
- Iranian 5% Portuguese 5% Lithuanian 3%
- Foreign-born
- 1% · Canada, Jamaica
- Languages at home
- 98% English-only · Spanish 2%
Political lean MEDSL · Poweshiek
- 2024 margin
- R (+17.0) · D 40.8% · R 57.8% · Other 1.5%
- 2008→2024 swing
- -28.7pp toward R · 2008: 11.8pp · 2024: -17.0pp
- All cycles
- 2024: R+17.0 2020: R+13.3 2016: R+6.8 2012: D+9.1 2008: D+11.8
Not yet ingested
- Civics
- —
Market trends
- HPI YoY
- ▲ 30.91%
- Current HPI
- 364.6554
- Rent YoY
- —
- Metro
- —
- State GDP YoY
- ▲ 2.48%
- F500 in state
- 4
Industry mix (Fortune 500 HQ in IA)
| Industry | F500 HQs | Revenue |
|---|---|---|
| Financial Services | 1 | $16B |
|
||
| Retail / Convenience | 1 | $15B |
|
||
Price history
+60.9% since first listed5 events — show timeline
- 2026-03-13 Listed $378,000 DMMLS
- 2020-06-08 Sold (Public Records) $205,000 Public Records
- 2020-05-16 Listed — NORTHSTARMLS as Distributed by MLS Grid
- 2019-04-01 Listed $213,000 IAR
- 2018-08-07 Listed $235,000 IAR
Property tax history
+4.1%/yrLatest (2025): $2,200 · -3.6% YoY. Source: county tax records.
Cash-flow waterfall
monthlySold comps — $/sqft
last 12 mo · ≤1 miLoading sold comps…