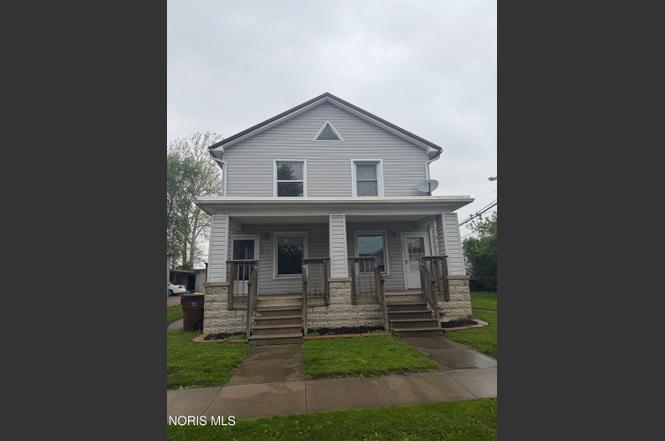
 Duplex
102 W Lynn St · Stryker, OH
Flood risk 1/10 · Minimal
- FEMA flood zone
- X
- Chance of flooding over 30 yrs
- 0.0%
- Est. flood insurance / yr
- $473 – $860
Fire risk 1/10 · Minimal
- Est. fire insurance / yr
- $713 – $1,323
Heat risk 3/10 · Minor
- Hot days now (above 100°F)
- 7 days/yr
- Hot days in 30 yrs
- 17 days/yr
Wind risk 2/10 · Minimal
- Chance of severe wind over 30 yrs
- —
Air-quality risk 2/10 · Minimal
- Unhealthy air days now
- 1 days/yr
- Unhealthy air days in 30 yrs
- 3 days/yr
Risk factors via First Street. Map © Google.
Why this score? — see what drove the B grade
The composite is a weighted blend of 9 inputs, each scored 0–100. Each bar is that input's sub-score; the figure is the points it added to the 100-point composite (weight × sub-score).
- Cash flow +30.0/30.0
- DSCR +10.0/10.0
- 1% rule +9.3/10.0
- ARV discount +7.5/15.0
- Schools +6.3/10.0
- Livability +3.6/5.0
- Rent growth +2.5/5.0
- Condition / age +2.5/5.0
- Appreciation +0.0/10.0
$149,900
🖨 Deal sheet 📄 Offer letter ✓ Due diligence
Multi-family units
County records classify this as Multi-Family (2-4 Unit). Listing-text estimate: 2 units. confirmed
Listing remarks MLS
Owner replacing 2 broken windows
Key facts
- All appliances stay
- Downtown stryker
- Duplex
Tags
Property features AI
Finance
- Other: Property located on approximately 0.19 acre lot in Tingley's Addn., Stryker, OH
- Financial info: Two-unit property (duplex) with one unit currently leased and one vacant; Tenant pays all utilities; Owner responsible for exterior maintenance, grounds care, repairs, insurance, snow removal and lawn care
- HOA & community: Dogs allowed
Exterior
- Parking: Private off-street parking; Driveway; Total of 4 parking spaces
- Utilities: Public water; Public sewer; 100 amp electric service; Electricity connected; Natural gas connected; Cable available; Internet and WiFi available
- Home design: Residential income duplex; Two-story building
- Construction: Vinyl siding; Metal roof; Block and combination foundation; Built per public records
- Exterior features: Covered porch; Level lot; Asphalt road frontage from alley and city street; Sidewalks in the community
Interior
- Kitchen: Electric range
- Bedrooms: Duplex property with multiple bedrooms across units
- Flooring: Carpet; Hardwood; Laminate; Linoleum
- Bathrooms: Bathrooms present in each unit (details not provided)
- Heating & cooling: Natural gas heating; Window air conditioning units
- Interior features: Insulated windows; Other interior features; Walk-up covered porch (see Exterior for porch)
- Laundry & utility: Washer; Dryer; Stacked washer/dryer; Washer hookup; Electric dryer hookup; Water heater
Neighborhood map
What this means for you Summary
Snapshot
- This is a 2 × 3-bed/1.0-bath units multifamily listed at $150k.
Deal economics
- At list price, monthly cash flow is $754 ($9k/yr) — positive. Per door: $377/mo.
- The deal already cash-flows at list — no discount required.
- Meets the 1% rule at list price ($2k rent vs $150k).
- Recommended offer: $145k (3.0% below list) — sets the bar for market timing.
Location & tenants
- Location reads 72/100 on livability (#361 in OH) — a middle-class / working-renter tenant base. Strengths: crime A+, cost of living A+, housing A+; Watch: amenities F, commute F, health & safety F.
- Stryker Local (rural): math 73% / reading 73% proficiency, ranked #226 of 802 in OH (top 28%) — strong family-tenant draw, lease renewals of 3-5y typical.
- Zoned schools: Stryker Elementary School (math 62% / reading 67%, grade B, #522 of 1,584 statewide, top 36%, 239 students, 0% FRL); Stryker High School (math 67% / reading 67%, grade B, #137 of 781 statewide, top 19%, 150 students, 98% FRL).
- Market conditions: 7 active listings in the ZIP; solid renter incomes; 40 units permitted in Williams County in 2024 (0 in 5+ unit buildings).
- This rent runs 32% of the median local income ($80k/yr) — at the standard rent-burdened threshold; future hikes will face affordability resistance.
Forward outlook
- Local home prices are declining (-3.0%/yr); year-one equity from $1k of loan paydown is wiped out by about $4k of value loss. Plan a longer hold.
- Williams County population projected at -14% by 2050 — secular population decline; favor cash flow + early exit over multi-decade hold.
- At projected returns (-3.0% appreciation + 3.0% rent growth), your $42k cash investment doubles in ~6 years — after that, you're playing with house money.
Negotiation context
- It's been on market 37 days — a 3% lower offer ($145k) is reasonable based on typical stale-listing flexibility.
- 10 sale attempts since 24y ago with the ask held roughly flat each time — persistent listings suggest the price (not the market) is what's stuck; bring a comps-based counter.
- Current owner paid $42k; list at $150k implies a 253% gain — meaningful room to come down on a strong offer.
Risks & watch-outs
- Watch-outs: built in 1920 — expect roof / HVAC / electrical / plumbing capex.
Questions for the listing agent
- It's been on market 37 days. Have you received any prior offers? Is the seller open to a 3% concession, seller financing, or rate buy-down credit?
- Can we see the unit-by-unit rent roll, current vacancy, and any below-market leases? What's the average tenancy length?
- What capital expenditures (roof, boiler, parking lot, exteriors) have been made in the last 5 years, and what's planned in the next 2?
- Built in 1920 — when were the roof, HVAC, electrical panel, plumbing, and water heater last replaced?
- Is there a deadline driving the sale (1031 exchange, divorce, estate, relocation)? That informs how much negotiation room exists.
- Schools are A-rated — typically a magnet for longer-tenancy family renters. What's the average tenant stay here, and is there a school-zone premium baked into asking?
- What's the average days-on-market for RENTAL listings here right now (not sales)? A rising rental-DOM trend means longer vacancies and softer asking-rent achievability than the comps imply.
- What's the recent tenant-quality profile in this submarket — average credit score on applications, eviction rate, late-payment / NSF rate, and stable-employment percentage? A property-management company in the area should have these aggregated.
- How much new apartment / multifamily construction is in the pipeline within 1–3 miles? Heavy new supply (>2% of stock underway) typically softens rents 12–24 months out; light construction supports rent growth.
Investment metrics
- 1% rule
- 1.43% ✓
- Cap rate
- 12.33%
- Cash-on-cash
- 21.56%
- DSCR
- 1.96
- GRM
- 5.8
CMA / ARV
No comps found within radius.
Projected returns pro-forma
-3.0% appreciation · 3.0% rent growth · sell at horizon
- IRR
- 14.1%
- Equity multiple
- 1.57×
- Total profit
- $23,716
- Equity at exit
- $22,351
- IRR
- 22.9%
- Equity multiple
- 2.96×
- Total profit
- $82,385
- Equity at exit
- $12,961
Cash invested: $41,972 (down + closing). Projections, not guarantees.
Landlord ↔ Tenant lean methodology
- Overall (STATE)
- 73 Landlord-Friendly
- State Ohio
- 73 Landlord-Friendly · R+6
- County
- — inherits STATE
- City
- — inherits STATE
ZIP-level market 43557
- Home prices YoY
- -8.3%
- Active inventory
- 7
- Price-to-rent
- 11.7×
Monthly cashflow live
- Estimated rent
- $2,138 medium interval (Pro) →
- Mortgage (P&I)
- −$786
- Tax from tax record
- −$86 /mo · $1,035/yr
- Insurance
- −$62
- HOA
- −$0
- Vacancy / Maint / Mgmt
- −$449
- Net cashflow
- $754
Break-even live
2-unit breakdown (identical units grouped — click to expand)
| Units | Beds | Baths | Est. rent |
|---|---|---|---|
| 2× units | 3 | 1 | $2,138 |
| #1 | 3 | 1 | $1,069 |
| #2 | 3 | 1 | $1,069 |
| Total (2 units) | $2,138 | ||
UW: 25.0% down · 7.5% · 30yr · 1.5% tax · 5.0% vac · 8.0% maint · 8.0% mgmt
Financing live
Cash to close
- Down payment
- $37,475
- Closing costs
- $4,497
- Reserves months
- —
- Total cash needed
- —
Loan-product check · same deal, 3 products live
Conventional
25% down · 7.5% · 30yr
- Down + closing
- —
- Monthly P&I
- —
- Monthly cashflow
- —
- DSCR
- —
- Eligible?
- —
Personal DTI + credit; lowest rate.
DSCR
20% down · 8.5% · 30yr
- Down + closing
- —
- Monthly P&I
- —
- Monthly cashflow
- —
- DSCR
- —
- Eligible?
- —
No personal income docs; deal must DSCR.
Hard money
10% down · 12.0% · 12mo
- Down + closing
- —
- Monthly P&I
- —
- Monthly cashflow
- —
- DSCR
- —
- Eligible?
- —
Short-term bridge; refi at stabilization.
Listing history 40 events
-
2026-06-16status $149,900 Pending 37 DOM
-
2026-06-15days on market $149,900 Contingent 37 DOM
-
2026-06-13days on market $149,900 Contingent 35 DOM
-
2026-06-12days on market $149,900 Contingent 34 DOM
-
2026-06-09days on market $149,900 Contingent 31 DOM
-
2026-06-08days on market $149,900 Contingent 30 DOM
-
2026-06-08days on market $149,900 Contingent 29 DOM
-
2026-06-07days on market $149,900 Contingent 28 DOM
-
2026-06-04days on market $149,900 Contingent 25 DOM
-
2026-06-02days on market $149,900 Contingent 24 DOM
-
2026-06-01days on market $149,900 Contingent 23 DOM
-
2026-05-31days on market $149,900 Contingent 22 DOM
-
2026-05-13historical Contingent
-
2026-05-05$149,900 Active
-
2025-10-14price $15,500 32-char remark
Show marketing remark (218 chars)
NICE UPDATED DUPLEX WITH GREAT CASH FLOW. BOTH SIDES ARE CURRENTLY RENTED. ALL THE WORK IS DONE. RENTS ARE $500 AND $550/MO. TENANTS PAY ALL UTILITIES. WILL MAKE A GREAT INVESTMENT. SET YOUR APPOINTMENT UP TODAY.
-
2025-10-14price $42,500 218-char remark
Show marketing remark (218 chars)
NICE UPDATED DUPLEX WITH GREAT CASH FLOW. BOTH SIDES ARE CURRENTLY RENTED. ALL THE WORK IS DONE. RENTS ARE $500 AND $550/MO. TENANTS PAY ALL UTILITIES. WILL MAKE A GREAT INVESTMENT. SET YOUR APPOINTMENT UP TODAY.
-
2025-10-13price $35,000
-
2015-11-25soldstatus $42,500
-
2015-11-24soldstatus $42,500 218-char remark
Show marketing remark (218 chars)
NICE UPDATED DUPLEX WITH GREAT CASH FLOW. BOTH SIDES ARE CURRENTLY RENTED. ALL THE WORK IS DONE. RENTS ARE $500 AND $550/MO. TENANTS PAY ALL UTILITIES. WILL MAKE A GREAT INVESTMENT. SET YOUR APPOINTMENT UP TODAY.
-
2015-07-13$49,999 218-char remark
Show marketing remark (218 chars)
NICE UPDATED DUPLEX WITH GREAT CASH FLOW. BOTH SIDES ARE CURRENTLY RENTED. ALL THE WORK IS DONE. RENTS ARE $500 AND $550/MO. TENANTS PAY ALL UTILITIES. WILL MAKE A GREAT INVESTMENT. SET YOUR APPOINTMENT UP TODAY.
-
2015-02-23soldstatus $15,500
-
2015-02-20soldstatus $15,500 32-char remark
Show marketing remark (32 chars)
Owner replacing 2 broken windows
-
2014-10-27$18,995 32-char remark
Show marketing remark (32 chars)
Owner replacing 2 broken windows
-
2014-08-01historical
-
2014-05-30$34,900
-
2014-05-12historical
-
2013-11-13$49,900
-
2013-11-12historical
-
2013-05-13$39,900
-
2012-10-11historical
-
2012-04-11$24,900
-
2011-09-07soldstatus $35,000
-
2009-07-06$39,900
-
2006-03-14soldstatus $43,000
-
2005-08-13historical
-
2002-12-27$79,900
-
2002-12-26historical
-
2002-06-26$79,900
-
1998-01-16soldstatus $60,000
-
1994-08-01soldstatus $30,500
ⓘ Source: listings_history table (triggers on properties + properties_extension) + one-shot
backfill from property_details.listing_events for pre-trigger history.
Tax reassessment forecast OH · Partial reset (capped growth)
- Current annual tax
- $1,035 · $86/mo
- Projected year-2 tax
- $1,687 · $141/mo
- Expected delta
- +$652/yr (+$54/mo · 63.0%)
ⓘ Screening estimate from a state-policy table — verify with the county assessor before closing.
Climate risk First Street
- Flood 1/10 Low FEMA zone X · 0% chance over 30 yrs
- Wildfire 1/10 Low
- Heat 3/10 Moderate 7 d/yr ≥100°F today · 17 d/yr by 30 yrs out
- Wind 2/10 Low
- Air quality 2/10 Low 1 unhealthy d/yr today · 3 by 30 yrs out
Nearby sold comps map
Loading sold comps map…
Walkable amenities ~0.75 mi
Loading nearby amenities…
Taxation est. · year 1
- Rental income
- $25,656
- − Mortgage interest
- −$8,397
- − Property taxes
- −$1,035
- − Insurance
- −$750
- − Repairs & maintenance
- −$2,052
- − Management
- −$2,052
- − Depreciation
- −$4,361
- Taxable income
- $7,009
- Est. tax owed @ 24.0%
- −$1,682
- After-tax cash flow
- $7,368/yr
For passive investors: Depreciation is non-cash, so a rental often shows a tax loss while cash-flowing — sheltering income. Rental losses are passive: they offset passive income freely, and up to $25,000/yr can offset ordinary (W-2) income if you actively participate and your MAGI is under $100k (phasing out to $0 by $150k); unused losses carry forward. On sale, claimed depreciation is recaptured at up to 25%, and gains may owe capital-gains tax (a 1031 exchange can defer both). Figures are a year-1 estimate at your 24.0% rate — not tax advice; consult a CPA.
Schools (NCES district)
- District
- Stryker Local
- NCES district ID
- 3905065
- Math proficiency
- 73% ▲ 3.00%
- Reading proficiency
- 73% ▲ 3.00%
- Median HH income
- $52,467
- Composite
- 63.17/100
- National rank
- #1305
- State rank
- #226 of 802 in OH
Livability — Stryker
- Score
- 72/100
- State rank
- #361
- US rank
- #5865
Category grades
Schools grade is shown separately in the Schools card above.
Census & demographics
- Census place
- Stryker, OH
- County
- Williams · 37,585 people
- Population (ZIP)
- 3,219
- Household income
- $80,163
- Rent vs Own
- Severe rent burden
- 11.6
Population outlook (Williams County) Hauer SSP2
- Today (2025)
- 36,125 people
- By 2030
- 35,264 · -2.4%
- By 2040
- 33,264 · -7.9%
- By 2050
- 31,072 · -14.0%
- By 2075
- 26,553 · -26.5%
- By 2100
- 21,318 · -41.0%
Race, ethnicity, and origin ACS 2023
- Neighborhood character
- Predominantly White (80%)
- Race & ethnicity
- White 80% Hispanic / Latino 12% Two or more races 6% Black 5% Native American 3%
- Hispanic origin (detail)
- Mexican 7% Puerto Rican 1%
- Common ancestry
- Lithuanian 4% Romanian 2% Slovak 2%
- Foreign-born
- 1% · Canada
- Languages at home
- 96% English-only · Spanish 4%
Political lean MEDSL · Williams
- 2024 margin
- Solid R (+48.2) · D 25.4% · R 73.7%
- 2008→2024 swing
- -39.0pp toward R · 2008: -9.3pp · 2024: -48.2pp
- All cycles
- 2024: R+48.2 2020: R+46.2 2016: R+43.8 2012: R+16.3 2008: R+9.3
Not yet ingested
- Civics
- —
Market trends
- HPI YoY
- ▼ -20.03%
- Current HPI
- 220.9472
- Rent YoY
- —
- Metro
- —
- State GDP YoY
- ▲ 1.98%
- F500 in state
- 48
Industry mix (Fortune 500 HQ in OH)
| Industry | F500 HQs | Revenue |
|---|---|---|
| Insurance | 3 | $145B |
|
||
| Industrial Machinery | 3 | $49B |
|
||
| Financial Services | 3 | $24B |
|
||
| Consumer Goods | 2 | $93B |
|
||
| Aerospace / Defense | 2 | $47B |
|
||
| Utilities | 2 | $33B |
|
||
Price history
+391.5% since first listed28 events — show timeline
- 2026-05-13 Contingent — NORIS
- 2026-05-05 Listed $149,900 NORIS
- 2025-10-14 Price Changed $15,500 NORIS
- 2025-10-14 Price Changed $42,500 NORIS
- 2025-10-13 Price Changed $35,000 NORIS
- 2015-11-25 Sold (Public Records) $42,500 Public Records
- 2015-11-24 Sold (MLS) $42,500 NORIS
- 2015-07-13 Listed $49,999 NORIS
- 2015-02-23 Sold (Public Records) $15,500 Public Records
- 2015-02-20 Sold (MLS) $15,500 NORIS
- 2014-10-27 Listed $18,995 NORIS
- 2014-08-01 Listing Removed — NORIS
- 2014-05-30 Listed $34,900 NORIS
- 2014-05-12 Listing Removed — NORIS
- 2013-11-13 Listed $49,900 NORIS
- 2013-11-12 Listing Removed — NORIS
- 2013-05-13 Listed $39,900 NORIS
- 2012-10-11 Listing Removed — NORIS
- 2012-04-11 Listed $24,900 NORIS
- 2011-09-07 Sold (MLS) $35,000 NORIS
- 2009-07-06 Listed $39,900 NORIS
- 2006-03-14 Sold (Public Records) $43,000 Public Records
- 2005-08-13 Listing Removed — NORIS
- 2002-12-27 Listed $79,900 NORIS
- 2002-12-26 Listing Removed — NORIS
- 2002-06-26 Listed $79,900 NORIS
- 1998-01-16 Sold (Public Records) $60,000 Public Records
- 1994-08-01 Sold (Public Records) $30,500 Public Records
Property tax history
+1.8%/yrLatest (2025): $1,035 · +0.0% YoY. Source: county tax records.
Cash-flow waterfall
monthlySold comps — $/sqft
last 12 mo · ≤1 miLoading sold comps…