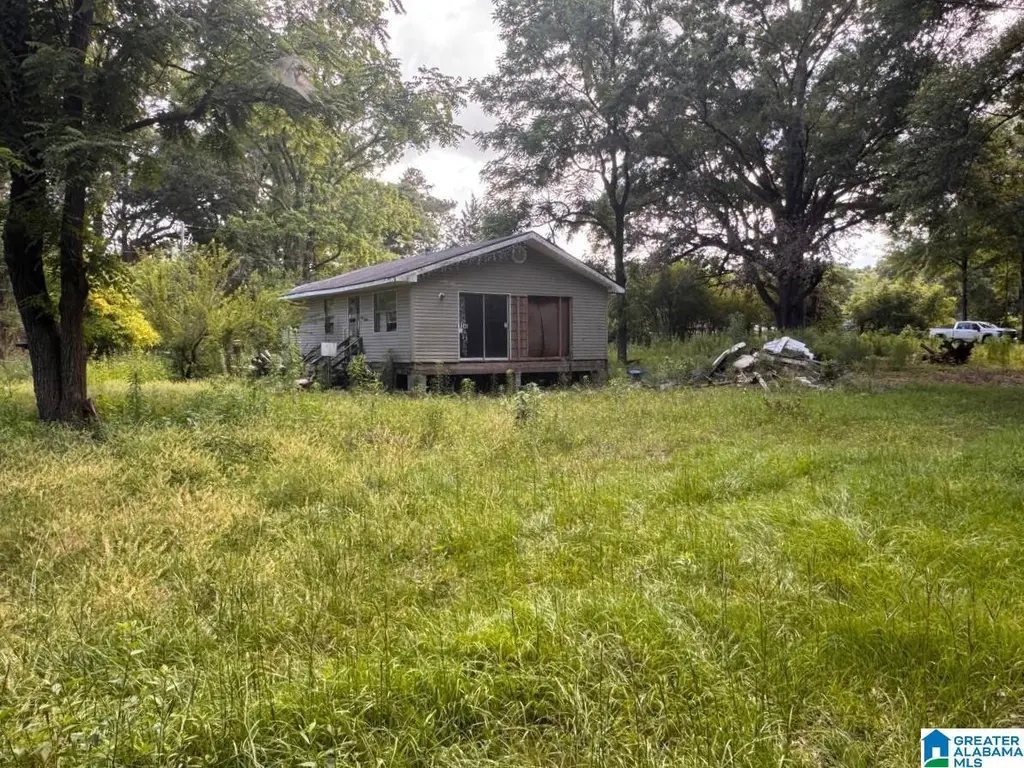
5246 Outlaw Rd · Prichard, AL
Flood risk 1/10 · Minimal
- FEMA flood zone
- X (unshaded)
- Chance of flooding over 30 yrs
- 0.0%
- Est. flood insurance / yr
- $507 – $1,088
Fire risk 5/10 · Moderate
- Est. fire insurance / yr
- $916 – $1,700
Heat risk 9/10 · Severe
- Hot days now (above 104°F)
- 7 days/yr
- Hot days in 30 yrs
- 19 days/yr
Wind risk 9/10 · Severe
- Chance of severe wind over 30 yrs
- 99.0%
Air-quality risk 1/10 · Minimal
- Unhealthy air days now
- 0 days/yr
- Unhealthy air days in 30 yrs
- 0 days/yr
Risk factors via First Street. Map © Google.
Why this score? — see what drove the B- grade
The composite is a weighted blend of 9 inputs, each scored 0–100. Each bar is that input's sub-score; the figure is the points it added to the 100-point composite (weight × sub-score).
- Cash flow +30.0/30.0
- 1% rule +10.0/10.0
- DSCR +10.0/10.0
- ARV discount +7.5/15.0
- Livability +2.7/5.0
- Rent growth +2.5/5.0
- Schools +2.3/10.0
- Condition / age +1.0/5.0
- Appreciation +0.0/10.0
$49,900
🖨 Deal sheet 📄 Offer letter ✓ Due diligence
Listing remarks
Investor special in Eight Mile - two homes, two parcels on 1.1 acres total, sold as-is. This property features two homes on crawl space sitting on a 1.1-acre parcel. House 1 has 2 bedr / 1 bath at 704 sq ft, while House 2 has 3 bed / 1 bath at 912 sq ft, for a total of 1,616 sq ft under roof across both buildings. The 1.1-acre parcel opens up real flexibility for the right investor - a duplex rent-and-hold strategy, demo-and-rebuild new construction, or work with one structure and reimagine the other. Plenty of lot to work with.
Key facts
- Two parcels
- 1.1 acres
- Crawl space
Tags
Property features AI
Finance
- Other: Driving directions available
- Financial info: No financial details provided
- HOA & community: No association fee
Exterior
- Parking: Unassigned parking
- Security: No security features listed
- Utilities: Well water; Septic sewer; Electric water heater; Internet availability unknown
- Home design: Wood and stucco construction; Existing year built description; Foundation supported on pillars; Sits on approximately 1.1 acres
- Construction: Wood and stucco exterior; Pillars/support foundation; Open deck
- Exterior features: Open deck; Porch; Storage building; No pool; No patio; No garden view; Not waterfront
Interior
- Kitchen: Laminate countertops
- Bedrooms: Master bedroom on main level; Four additional bedrooms on main level
- Flooring: Hardwood floors
- Bathrooms: Two full bathrooms; Tub/shower combo
- Heating & cooling: No heating; No air conditioning
- Interior features: Smooth ceilings; No additional interior features listed
- Laundry & utility: Electric water heater
Neighborhood map
What this means for you Summary
Snapshot
- This is a 5-bed/2.0-bath single-family listed at $50k. Condition is rated poor.
Deal economics
- At list price, monthly cash flow is $1k ($12k/yr) — positive.
- The deal already cash-flows at list — no discount required.
- Meets the 1% rule at list price ($2k rent vs $50k).
- Recommended offer: $49k (1.5% below list) — sets the bar for market timing.
- Cap rate 30.4% vs local median 11.4% in Prichard — top-decile yield for the area; either an underpriced asset or a hidden risk that comps aren't pricing in. Stress-test before assuming the spread holds.
Location & tenants
- Location reads 54/100 on livability (#472 in AL) — a working-class tenant base; expect higher turnover. Strengths: cost of living A+, housing A; Watch: crime F, amenities F, commute F.
- Mobile County (urban): math 15% / reading 39% proficiency, ranked #81 of 129 in AL (top 63%) — low school quality limits family demand, transient renter base, plan for 1-2y turnover; 67% free/reduced lunch — lower-income household profile, screen leases tightly.
- Zoned schools: Indian Springs Elementary School (math 12% / reading 27%, grade F, #467 of 627 statewide, top 76%, 368 students, 75% FRL); Mattie T Blount High School (math 2% / reading 3%, grade F, #291 of 305 statewide, top 100%, 1,176 students, 86% FRL).
- Zoned-school proficiency averages 11% at this address vs 27% district-wide (-16 pts) — the specific schools serving this property underperform the Mobile County average; the district grade overstates school quality for this exact location.
- Market conditions: 92 active listings in the ZIP; 1,678 units permitted in Mobile County in 2024 (264 in 5+ unit buildings).
Forward outlook
- Local home prices are declining (-3.0%/yr); year-one equity from $345 of loan paydown is wiped out by about $1k of value loss. Plan a longer hold.
- Mobile County population projected to shrink 8% by 2050 — rents likely to lag national; underwrite the cash flow, not the appreciation.
- At projected returns (-3.0% appreciation + 3.0% rent growth), your $14k cash investment doubles in ~2 years — after that, you're playing with house money.
Negotiation context
- It's been on market 21 days — a 2% lower offer ($49k) is reasonable based on typical stale-listing flexibility.
Risks & watch-outs
- Climate carrying-cost: severe wind risk, 99% chance of damaging wind over 30y; moderate wildfire risk; extreme-heat days projected 7→19/yr by 2055 (HVAC capex compounding) — expect insurance premiums to compound above CPI over the hold.
Questions for the listing agent
- Have any recent inspections been done? Can we get a copy of the seller's disclosures and any deferred-maintenance estimates?
- Is there a deadline driving the sale (1031 exchange, divorce, estate, relocation)? That informs how much negotiation room exists.
- Schools are D-rated, which usually means shorter tenancies and higher turnover. Who's the typical renter profile here, and what's been the actual vacancy rate?
- Crime grade is F in this area — have there been break-ins, vandalism, or insurance claims at this property in the last 3 years? What carrier currently insures it and at what premium?
- What's the average days-on-market for RENTAL listings here right now (not sales)? A rising rental-DOM trend means longer vacancies and softer asking-rent achievability than the comps imply.
- What's the recent tenant-quality profile in this submarket — average credit score on applications, eviction rate, late-payment / NSF rate, and stable-employment percentage? A property-management company in the area should have these aggregated.
- How much new for-sale + rental construction is in the pipeline within 1–3 miles? Heavy new supply typically softens prices + rents 12–24 months out; constrained supply supports both.
Investment metrics
- 1% rule
- 3.42% ✓
- Cap rate
- 30.43%
- Cash-on-cash
- 86.21%
- DSCR
- 4.84
- GRM
- 2.4
CMA / ARV
- ARV (on-the-fly)
- $213,312
- Comps found
- 1
Show comp detail 1 sale within ~0.75 mi
| Address | Dist | Beds/Ba | Sqft | Sold | Price | $/sf | Match |
|---|---|---|---|---|---|---|---|
| 4803 Outlaw Rd | 0.16mi | 4/2.0 (-1) | 1,815 (+12%) | 7mo | $240,000 | $132 | 61 |
Match score weights: distance 35% · size 25% · config 20% · recency 20%. Top-matched comps best support the ARV.
Projected returns pro-forma
-3.0% appreciation · 3.0% rent growth · sell at horizon
- IRR
- 86.7%
- Equity multiple
- 5.00×
- Total profit
- $55,867
- Equity at exit
- $7,440
- IRR
- 89.8%
- Equity multiple
- 10.38×
- Total profit
- $131,070
- Equity at exit
- $4,314
Cash invested: $13,972 (down + closing). Projections, not guarantees.
Landlord ↔ Tenant lean methodology
- Overall (STATE)
- 90 Strongly Landlord-Friendly
- State Alabama
- 90 Strongly Landlord-Friendly · R+15
- County
- — inherits STATE
- City
- — inherits STATE
ZIP-level market 36613
- Home prices YoY
- -23.9%
- Active inventory
- 92
- Price-to-rent
- 2.4×
Monthly cashflow live
- Estimated rent
- $1,707 medium interval (Pro) →
- Mortgage (P&I)
- −$262
- Tax est. 1.5%
- −$62 /mo · $748/yr
- Insurance
- −$21
- HOA
- −$0
- Vacancy / Maint / Mgmt
- −$358
- Net cashflow
- $1,004
Break-even live
UW: 25.0% down · 7.5% · 30yr · 1.5% tax · 5.0% vac · 8.0% maint · 8.0% mgmt
Financing live
Cash to close
- Down payment
- $12,475
- Closing costs
- $1,497
- Reserves months
- —
- Total cash needed
- —
Loan-product check · same deal, 3 products live
Conventional
25% down · 7.5% · 30yr
- Down + closing
- —
- Monthly P&I
- —
- Monthly cashflow
- —
- DSCR
- —
- Eligible?
- —
Personal DTI + credit; lowest rate.
DSCR
20% down · 8.5% · 30yr
- Down + closing
- —
- Monthly P&I
- —
- Monthly cashflow
- —
- DSCR
- —
- Eligible?
- —
No personal income docs; deal must DSCR.
Hard money
10% down · 12.0% · 12mo
- Down + closing
- —
- Monthly P&I
- —
- Monthly cashflow
- —
- DSCR
- —
- Eligible?
- —
Short-term bridge; refi at stabilization.
Listing history 19 events
-
2026-06-18days on market $49,900 Active 21 DOM
-
2026-06-17price $49,900 Active 20 DOM
-
2026-06-17days on market $59,900 Active 20 DOM
-
2026-06-16days on market $59,900 Active 19 DOM
-
2026-06-15days on market $59,900 Active 18 DOM
-
2026-06-14days on market $59,900 Active 16 DOM
-
2026-06-13days on market $59,900 Active 15 DOM
-
2026-06-10days on market $59,900 Active 13 DOM
-
2026-06-09pricedays on market $59,900 Active 12 DOM
-
2026-06-08days on market $69,900 Active 11 DOM
-
2026-06-07days on market $69,900 Active 10 DOM
-
2026-06-05days on market $69,900 Active 7 DOM
-
2026-06-03days on market $69,900 Active 6 DOM
-
2026-06-03price $69,900 Active 5 DOM
-
2026-06-02days on market $79,900 Active 5 DOM
-
2026-06-01days on market $79,900 Active 4 DOM
-
2026-05-31days on market $79,900 Active 3 DOM
-
2026-05-30days on market $79,900 Active 2 DOM
-
2026-05-28$79,900 Active
ⓘ Source: listings_history table (triggers on properties + properties_extension) + one-shot
backfill from property_details.listing_events for pre-trigger history.
Climate risk First Street
- Flood 1/10 Low FEMA zone X (unshaded) · 0% chance over 30 yrs
- Wildfire 5/10 Major
- Heat 9/10 Extreme 7 d/yr ≥104°F today · 19 d/yr by 30 yrs out
- Wind 9/10 Extreme 99% chance of damaging wind over 30 yrs
- Air quality 1/10 Low 0 unhealthy d/yr today · 0 by 30 yrs out
Nearby sold comps map
Loading sold comps map…
Walkable amenities ~0.75 mi
Loading nearby amenities…
Taxation est. · year 1
- Rental income
- $20,485
- − Mortgage interest
- −$2,795
- − Property taxes
- −$748
- − Insurance
- −$250
- − Repairs & maintenance
- −$1,639
- − Management
- −$1,639
- − Depreciation
- −$1,452
- Taxable income
- $11,962
- Est. tax owed @ 24.0%
- −$2,871
- After-tax cash flow
- $9,174/yr
For passive investors: Depreciation is non-cash, so a rental often shows a tax loss while cash-flowing — sheltering income. Rental losses are passive: they offset passive income freely, and up to $25,000/yr can offset ordinary (W-2) income if you actively participate and your MAGI is under $100k (phasing out to $0 by $150k); unused losses carry forward. On sale, claimed depreciation is recaptured at up to 25%, and gains may owe capital-gains tax (a 1031 exchange can defer both). Figures are a year-1 estimate at your 24.0% rate — not tax advice; consult a CPA.
Condition & rehab AI · 13 photos
This property requires extensive rehabilitation, including structural repairs, plumbing, electrical, and interior work. Immediate attention to these issues is necessary to improve the property's value and safety.
Repairs flagged
- Major Exposed plumbing — Needs full replacement
- Major Exposed water heater — Needs full replacement
- Major Exposed electrical wiring — Needs full replacement
- Major Exposed subflooring — Needs full replacement
- Major Siding — Needs full replacement
Value-add opportunities
- Both Landscaping and vegetation control — Improves curb appeal and safety
- Both Full replacement of plumbing, electrical, and water heater — Essential for functionality and safety
- Both Rehabilitation of siding and exterior — Enhances curb appeal and structural integrity
- Both Rehabilitation of interior walls and paint — Enhances interior aesthetics and safety
Renovation cost estimate screening
| Repair item | Severity | Est. cost |
|---|---|---|
| Exposed plumbing · Needs full replacement | Major | $15,000–50,000 |
| Exposed water heater · Needs full replacement | Major | $15,000–50,000 |
| Exposed electrical wiring · Needs full replacement | Major | $15,000–50,000 |
| Exposed subflooring · Needs full replacement | Major | $15,000–50,000 |
| Siding · Needs full replacement | Major | $15,000–50,000 |
| Total estimated repair cost · 5 items | $75,000–250,000 |
Value-add ROI direction
- Both Landscaping and vegetation control — Improves curb appeal and safety ↑
- Both Full replacement of plumbing, electrical, and water heater — Essential for functionality and safety ↑
- Both Rehabilitation of siding and exterior — Enhances curb appeal and structural integrity ↑
- Both Rehabilitation of interior walls and paint — Enhances interior aesthetics and safety ↑
ⓘ Cost ranges are severity-bucket heuristics (US national rule-of-thumb). Get contractor quotes + a written scope before underwriting a rehab budget.
Schools (NCES district)
- District
- Mobile County
- NCES district ID
- 0102370
- Math proficiency
- 15% ▼ -28.00%
- Reading proficiency
- 39% ▬ 0.00%
- Median HH income
- $42,455
- Composite
- 22.9/100
- National rank
- #8002
- State rank
- #81 of 129 in AL
Livability — Prichard
- Score
- 54/100
- State rank
- #472
- US rank
- #24080
Category grades
Schools grade is shown separately in the Schools card above.
Census & demographics
- Census place
- Prichard, AL
- City population
- 13,402
- Population (ZIP)
- 12,082
Population outlook (Mobile County) Hauer SSP2
- Today (2025)
- 415,303 people
- By 2030
- 411,755 · -0.9%
- By 2040
- 399,670 · -3.8%
- By 2050
- 382,616 · -7.9%
- By 2075
- 337,353 · -18.8%
- By 2100
- 283,391 · -31.8%
Race, ethnicity, and origin ACS 2023
- Neighborhood character
- Majority Black (52%)
- Race & ethnicity
- Black 52% White 44% Two or more races 3% Hispanic / Latino 2%
- Common ancestry
- Lithuanian 2% Italian 2% Slovak 2%
- Foreign-born
- 0%
- Languages at home
- 99% English-only · Spanish 1%
Political lean MEDSL · Mobile
- 2024 margin
- R (+16.4) · D 41.3% · R 57.7%
- 2008→2024 swing
- -7.7pp toward R · 2008: -8.7pp · 2024: -16.4pp
- All cycles
- 2024: R+16.4 2020: R+11.9 2016: R+13.9 2012: R+9.3 2008: R+8.7
Not yet ingested
- Civics
- —
Market trends
- HPI YoY
- ▼ -65.49%
- Current HPI
- 208.8677
- Rent YoY
- —
- Metro
- —
- State GDP YoY
- ▲ 2.94%
- F500 in state
- 4
Industry mix (Fortune 500 HQ in AL)
| Industry | F500 HQs | Revenue |
|---|---|---|
| Financial Services | 1 | $8B |
|
||
| Healthcare | 1 | $5B |
|
||
Price history
1 event — show timeline
- 2026-05-28 Listed $79,900 Greater Alabama MLS
Cash-flow waterfall
monthlySold comps — $/sqft
last 12 mo · ≤1 miLoading sold comps…