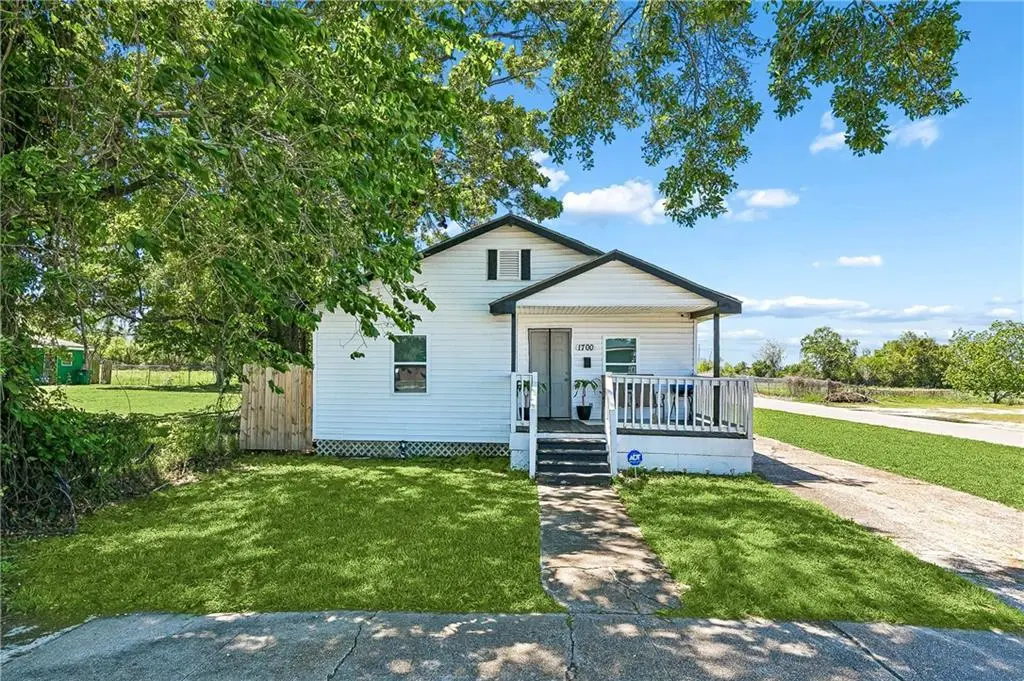
1700 Pailet Ave · Harvey, LA
Flood risk No data
- FEMA flood zone
- —
- Chance of flooding over 30 yrs
- —
- Est. flood insurance / yr
- —
Fire risk No data
- Est. fire insurance / yr
- —
Heat risk No data
- Hot days now (above threshold)
- —
- Hot days in 30 yrs
- —
Wind risk No data
- Chance of severe wind over 30 yrs
- —
Air-quality risk No data
- Unhealthy air days now
- —
- Unhealthy air days in 30 yrs
- —
Risk factors via First Street. Map © Google.
Why this score? — see what drove the B- grade
The composite is a weighted blend of 9 inputs, each scored 0–100. Each bar is that input's sub-score; the figure is the points it added to the 100-point composite (weight × sub-score).
- Cash flow +26.2/30.0
- ARV discount +14.9/15.0
- DSCR +8.9/10.0
- 1% rule +6.5/10.0
- Livability +3.2/5.0
- Schools +2.5/10.0
- Condition / age +2.5/5.0
- Rent growth +1.5/5.0
- Appreciation +0.0/10.0
$150,000
🖨 Deal sheet 📄 Offer letter ✓ Due diligence
Listing remarks MLS
Let's Turn Some Keys, Baby. .. Calling all first time homebuyers and investors. .. .Your 3bed 2bath income-producing corner home located in the heart of Harvey features a 2-year old roof, updated kitchen and bathrooms, and well designed living spaces. Each bedroom offers generous closet space and comfortable room sizes. Your home also includes expansive backyard, providing plenty of outdoor space for enjoyment or entertaining.
Key facts
- 2 year old roof
- Updated kitchen
- Expansive backyard
Tags
Neighborhood map
What this means for you Summary
Snapshot
- This is a 3-bed/2.0-bath single-family listed at $150k.
Deal economics
- At list price, monthly cash flow is $382 ($5k/yr) — positive.
- The deal already cash-flows at list — no discount required.
- Meets the 1% rule at list price ($2k rent vs $150k).
- Recommended offer: $141k (6.0% below list) — sets the bar for market timing.
- Cap rate 9.4% vs local median 4.8% in Harvey — top-decile yield for the area; either an underpriced asset or a hidden risk that comps aren't pricing in. Stress-test before assuming the spread holds.
Location & tenants
- Location reads 64/100 on livability (#166 in LA) — a middle-class / working-renter tenant base. Strengths: cost of living A+, housing A+; Watch: schools D+, crime F, amenities F.
- Jefferson Parish (suburban): math 24% / reading 34% proficiency, ranked #44 of 98 in LA (top 45%) — low school quality limits family demand, transient renter base, plan for 1-2y turnover; 70% free/reduced lunch — lower-income household profile, screen leases tightly.
- Market conditions: Rents falling (-3.9%/yr); 187 active listings in the ZIP; 34 comparable units currently listed for rent nearby; rentals at typical pace (median 24d on market — plan ~3-4 weeks tenant-placement turnaround); 518 units permitted in Jefferson Parish in 2024 (43 in 5+ unit buildings).
- This rent runs 33% of the median local income ($62k/yr) — at the standard rent-burdened threshold; future hikes will face affordability resistance.
Forward outlook
- Local home prices are declining (-3.0%/yr); year-one equity from $1k of loan paydown is wiped out by about $4k of value loss. Plan a longer hold.
Negotiation context
- It's been on market 65 days — a 6% lower offer ($141k) is reasonable based on typical stale-listing flexibility.
- 4 sale attempts since 3y ago with the ask held roughly flat each time — persistent listings suggest the price (not the market) is what's stuck; bring a comps-based counter.
- Current owner paid $56k; list at $150k implies a 168% gain — meaningful room to come down on a strong offer.
Risks & watch-outs
- Watch-outs: built in 1952 — expect roof / HVAC / electrical / plumbing capex.
Questions for the listing agent
- It's been on market 65 days. Have you received any prior offers? Is the seller open to a 6% concession, seller financing, or rate buy-down credit?
- Built in 1952 — when were the roof, HVAC, electrical panel, plumbing, and water heater last replaced?
- Why hasn't it sold? Are there any deal-killer items the seller is aware of (foundation, flood, title, zoning, code violations)?
- Is there a deadline driving the sale (1031 exchange, divorce, estate, relocation)? That informs how much negotiation room exists.
- Schools are D-rated, which usually means shorter tenancies and higher turnover. Who's the typical renter profile here, and what's been the actual vacancy rate?
- Crime grade is F in this area — have there been break-ins, vandalism, or insurance claims at this property in the last 3 years? What carrier currently insures it and at what premium?
- What's the average days-on-market for RENTAL listings here right now (not sales)? A rising rental-DOM trend means longer vacancies and softer asking-rent achievability than the comps imply.
- What's the recent tenant-quality profile in this submarket — average credit score on applications, eviction rate, late-payment / NSF rate, and stable-employment percentage? A property-management company in the area should have these aggregated.
- How much new for-sale + rental construction is in the pipeline within 1–3 miles? Heavy new supply typically softens prices + rents 12–24 months out; constrained supply supports both.
Investment metrics
- 1% rule
- 1.15% ✓
- Cap rate
- 9.35%
- Cash-on-cash
- 10.92%
- DSCR
- 1.49
- GRM
- 7.3
CMA / ARV
- ARV (median comp)
- $179,306
- List price
- $150,000
- Delta
- -16.34%
- Verdict
- UNDERPRICED
- Comps
- 20 within 1.0 mi
Show comp detail 12 sales within ~0.75 mi
| Address | Dist | Beds/Ba | Sqft | Sold | Price | $/sf | Match |
|---|---|---|---|---|---|---|---|
| 1820 Pailet Ave | 0.15mi | 2/1.5 (-1) | 1,451 (+3%) | 2mo | $105,000 | $72 | 79 |
| 1528 Estalote Ave | 0.17mi | 3/2.0 | 1,275 (-9%) | 14mo | $160,000 | $125 | 65 |
| 1309 Dogwood Dr | 0.51mi | 3/2.0 | 1,377 (-2%) | 13mo | $183,000 | $133 | 63 |
| 1357 Dogwood Dr | 0.41mi | 3/2.0 | 1,340 (-4%) | 15mo | $129,500 | $97 | 61 |
| 1349 Dogwood Dr | 0.42mi | 3/2.0 | 1,550 (+10%) | 7mo | $199,900 | $129 | 57 |
| 1320 Dogwood Dr | 0.46mi | 3/2.0 | 1,486 (+6%) | 15mo | $165,000 | $111 | 56 |
| 1077 Marvin Ct | 0.67mi | 3/1.5 | 1,320 (-6%) | 6mo | $199,900 | $151 | 52 |
| 1312 Maplewood Dr | 0.51mi | 4/1.5 (+1) | 1,331 (-5%) | 13mo | $199,000 | $150 | 50 |
| 10 Gardere Ct | 0.55mi | 3/2.0 | 1,524 (+9%) | 15mo | $245,000 | $161 | 48 |
| 1380 Redwood Dr | 0.44mi | 4/2.0 (+1) | 1,570 (+12%) | 15mo | $177,900 | $113 | 42 |
| 1030 Estalote Ave | 0.73mi | 4/2.5 (+1) | 1,497 (+7%) | 8mo | $259,995 | $174 | 41 |
| 1149 Teakwood Dr | 0.72mi | 3/2.0 | 1,610 (+15%) | 1mo | $200,000 | $124 | 41 |
Match score weights: distance 35% · size 25% · config 20% · recency 20%. Top-matched comps best support the ARV.
Projected returns pro-forma
-3.0% appreciation · 0.0% rent growth · sell at horizon
- IRR
- -3.3%
- Equity multiple
- 0.88×
- Total profit
- $-5,020
- Equity at exit
- $22,365
- IRR
- 2.8%
- Equity multiple
- 1.18×
- Total profit
- $7,422
- Equity at exit
- $12,969
Cash invested: $42,000 (down + closing). Projections, not guarantees.
Landlord ↔ Tenant lean methodology
- Overall (STATE)
- 90 Strongly Landlord-Friendly
- State Louisiana
- 90 Strongly Landlord-Friendly · R+12
- County
- — inherits STATE
- City
- — inherits STATE
ZIP-level market 70058
- Rents YoY
- -3.9%
- Active inventory
- 187
- Price-to-rent
- 7.3×
Monthly cashflow live
- Estimated rent
- $1,723 high interval (Pro) →
- Mortgage (P&I)
- −$787
- Tax from tax record
- −$130 /mo · $1,561/yr
- Insurance
- −$62
- HOA
- −$0
- Vacancy / Maint / Mgmt
- −$362
- Net cashflow
- $382
Break-even live
UW: 25.0% down · 7.5% · 30yr · 1.5% tax · 5.0% vac · 8.0% maint · 8.0% mgmt
Financing live
Cash to close
- Down payment
- $37,500
- Closing costs
- $4,500
- Reserves months
- —
- Total cash needed
- —
Loan-product check · same deal, 3 products live
Conventional
25% down · 7.5% · 30yr
- Down + closing
- —
- Monthly P&I
- —
- Monthly cashflow
- —
- DSCR
- —
- Eligible?
- —
Personal DTI + credit; lowest rate.
DSCR
20% down · 8.5% · 30yr
- Down + closing
- —
- Monthly P&I
- —
- Monthly cashflow
- —
- DSCR
- —
- Eligible?
- —
No personal income docs; deal must DSCR.
Hard money
10% down · 12.0% · 12mo
- Down + closing
- —
- Monthly P&I
- —
- Monthly cashflow
- —
- DSCR
- —
- Eligible?
- —
Short-term bridge; refi at stabilization.
Rent comps 34 comps
| Address | Beds | Baths | Sqft | Rent | $/sqft | DOM | Units | Dist |
|---|---|---|---|---|---|---|---|---|
| 2407 Florence St Harvey, LA | 2.0 | 2.0 | 945 | $1,700 | $1.80 | 23d | 1 | 0.36mi |
| 2205 Argyll St Harvey, LA | 3.0 | 2.0 | 1100 | $1,750 | $1.59 | 21d | 1 | 0.37mi |
| 1645 Dogwood Dr Harvey, LA | 4.0 | 1.0 | 1185 | $1,800 | $1.52 | 23d | 1 | 0.42mi |
| 1849 Redwood Dr Harvey, LA | 3.0 | 2.0 | 1600 | $1,900 | $1.19 | 43d | 1 | 0.58mi |
| 1849 Redwood Dr Harvey, LA | 3.0 | 2.0 | 1600 | $1,900 | $1.19 | 23d | 1 | 0.58mi |
| 1805 Redwood Dr Harvey, LA | 3.0 | 2.0 | 1270 | $1,850 | $1.46 | 21d | 1 | 0.61mi |
| 1145 Warren Dr Harvey, LA | 4.0 | 2.0 | 1315 | $1,750 | $1.33 | 4d | 1 | 0.64mi |
| 1840 Mathis Ave Harvey, LA | 3.0 | 2.0 | 1200 | $1,800 | $1.50 | 43d | 1 | 0.68mi |
| 1157 Beechwood Dr Harvey, LA | 2.0 | 2.0 | 1219 | $1,600 | $1.31 | 23d | 1 | 0.73mi |
| 1520 Orchid Dr Harvey, LA | 3.0 | 1.5 | 1100 | $1,650 | $1.50 | 4d | 1 | 0.83mi |
| 1520 Orchid Dr Harvey, LA | 3.0 | 1.5 | 1100 | $1,800 | $1.64 | 23d | 1 | 0.83mi |
| 4000 Fir Ct Marrero, LA | 3.0 | 2.0 | 1380 | $1,800 | $1.30 | 4d | 1 | 1.05mi |
| 1013 Manhattan Blvd Harvey, LA | 1.0–2.0 | 1.0–1.5 | 837 | $1,789 | $2.14 | 1d | 10 | 1.07mi |
| 4029 Chestnut St Marrero, LA | 3.0 | 2.0 | 1600 | $2,100 | $1.31 | 4d | 1 | 1.08mi |
| 4029 14th St Marrero, LA | 3.0 | 1.5 | 1511 | $1,650 | $1.09 | 4d | 1 | 1.10mi |
| 4036 14th St Marrero, LA | 4.0 | 2.0 | 1350 | $1,950 | $1.44 | 21d | 1 | 1.10mi |
| 1121 Farrington Dr Marrero, LA | 3.0 | 1.0 | 1000 | $1,750 | $1.75 | 4d | 1 | 1.12mi |
| 1124 Tallow Tree Ln #20 Harvey, LA | 2.0 | 1.5 | 1020 | $1,150 | $1.13 | 3d | 1 | 1.14mi |
| 2504 Claire Ave Gretna, LA | 2.0 | 2.0 | 1032 | $1,600 | $1.55 | 43d | 1 | 1.17mi |
| 2201 Manhattan Blvd Harvey, LA | 1.0–2.0 | 1.0–2.0 | 780 | $1,349 | $1.73 | 1d | 27 | 1.24mi |
| 1028 Gaudet Dr Marrero, LA | 3.0 | 1.5 | 1420 | $1,800 | $1.27 | 43d | 1 | 1.29mi |
| 1499 Central Park Blvd Harvey, LA | 1.0–3.0 | 1.0–2.0 | 1002 | $2,195 | $2.19 | 2d | 18 | 1.29mi |
| 9 Gerard Ct Gretna, LA | 3.0 | 1.5 | 1550 | $1,600 | $1.03 | 43d | 1 | 1.29mi |
| 2310 Stafford St Gretna, LA | 4.0 | 2.0 | 1530 | $2,050 | $1.34 | 23d | 1 | 1.30mi |
| 729 5th Ave Harvey, LA | 2.0 | 2.0 | 975 | $1,450 | $1.49 | 44d | 1 | 1.30mi |
| 1100 Avenue A Marrero, LA | 2.0 | 1.0 | 1200 | $1,500 | $1.25 | 43d | 1 | 1.36mi |
| 2110 Willow St Unit C Harvey, LA | 2.0 | 1.0 | 975 | $1,155 | $1.18 | 43d | 1 | 1.39mi |
| 526 Brown Ave Harvey, LA | 2.0 | 1.0 | 903 | $1,350 | $1.50 | 23d | 1 | 1.39mi |
| 1511a Kings Rd Harvey, LA | 2.0 | 1.5 | 1000 | $1,600 | $1.60 | 43d | 1 | 1.40mi |
| 728 Lydia Ct Marrero, LA | 3.0 | 3.5 | 1500 | $2,600 | $1.73 | 4d | 1 | 1.41mi |
| 629 Bellanger St Harvey, LA | 2.0 | 1.0 | 970 | $1,200 | $1.24 | 43d | 1 | 1.46mi |
| 532 Chalmette St Harvey, LA | 3.0 | 1.0 | 1224 | $1,450 | $1.18 | 3d | 1 | 1.46mi |
| 2331 Justin Ln Unit Justin Harvey, LA | 2.0 | 1.5 | 1384 | $1,552 | $1.12 | 43d | 1 | 1.47mi |
| 605 Bellanger St Harvey, LA | 2.0 | 1.0 | 1008 | $1,500 | $1.49 | 43d | 1 | 1.50mi |
Listing history 20 events
-
2026-06-18days on market $150,000 Active 65 DOM
-
2026-06-17days on market $150,000 Active 64 DOM
-
2026-06-16days on market $150,000 Active 63 DOM
-
2026-06-15days on market $150,000 Active 62 DOM
-
2026-06-13days on market $150,000 Active 60 DOM
-
2026-06-10days on market $150,000 Active 57 DOM
-
2026-06-09days on market $150,000 Active 56 DOM
-
2026-06-08days on market $150,000 Active 55 DOM
-
2026-06-07days on market $150,000 Active 54 DOM
-
2026-06-03days on market $150,000 Active 50 DOM
-
2026-06-02days on market $150,000 Active 49 DOM
-
2026-06-01days on market $150,000 Active 48 DOM
-
2026-05-31days on market $150,000 Active 47 DOM
-
2026-04-14$150,000 Active 430-char remark
Show marketing remark (427 chars)
Let's Turn Some Keys, Baby... Calling all first time homebuyers and investors....Your 3bed 2bath income-producing corner home located in the heart of Harvey features a 2-year old roof, updated kitchen and bathrooms, and well designed living spaces. Each bedroom offers generous closet space and comfortable room sizes. Your home also includes expansive backyard, providing plenty of outdoor space for enjoyment or entertaining.
-
2026-04-14$150,000 Active 427-char remark
Show marketing remark (427 chars)
Let's Turn Some Keys, Baby... Calling all first time homebuyers and investors....Your 3bed 2bath income-producing corner home located in the heart of Harvey features a 2-year old roof, updated kitchen and bathrooms, and well designed living spaces. Each bedroom offers generous closet space and comfortable room sizes. Your home also includes expansive backyard, providing plenty of outdoor space for enjoyment or entertaining.
-
2023-10-13soldstatus $56,000 Closed
-
2023-09-12status Pending
-
2023-09-01$52,000 Active
-
2023-09-01$52,000
-
2000-08-01soldstatus
ⓘ Source: listings_history table (triggers on properties + properties_extension) + one-shot
backfill from property_details.listing_events for pre-trigger history.
Tax reassessment forecast LA · Resets to sale price
- Current annual tax
- $1,561 · $130/mo
- Projected year-2 tax
- $1,561 · $130/mo
- Expected delta
- $0/yr ($0/mo · 0.0%)
ⓘ Screening estimate from a state-policy table — verify with the county assessor before closing.
Nearby sold comps map
Loading sold comps map…
Walkable amenities ~0.75 mi
Loading nearby amenities…
Taxation est. · year 1
- Rental income
- $20,680
- − Mortgage interest
- −$8,402
- − Property taxes
- −$1,561
- − Insurance
- −$750
- − Repairs & maintenance
- −$1,654
- − Management
- −$1,654
- − Depreciation
- −$4,364
- Taxable income
- $2,295
- Est. tax owed @ 24.0%
- −$551
- After-tax cash flow
- $4,036/yr
For passive investors: Depreciation is non-cash, so a rental often shows a tax loss while cash-flowing — sheltering income. Rental losses are passive: they offset passive income freely, and up to $25,000/yr can offset ordinary (W-2) income if you actively participate and your MAGI is under $100k (phasing out to $0 by $150k); unused losses carry forward. On sale, claimed depreciation is recaptured at up to 25%, and gains may owe capital-gains tax (a 1031 exchange can defer both). Figures are a year-1 estimate at your 24.0% rate — not tax advice; consult a CPA.
Schools (NCES district)
- District
- Jefferson Parish
- NCES district ID
- 2200840
- Math proficiency
- 24% ▼ -36.00%
- Reading proficiency
- 34% ▼ -30.00%
- Median HH income
- $48,421
- Composite
- 25.19/100
- National rank
- #7511
- State rank
- #44 of 98 in LA
Livability — Harvey
- Score
- 64/100
- State rank
- #166
- US rank
- #13980
Category grades
Schools grade is shown separately in the Schools card above.
Census & demographics
- Census place
- Harvey, LA
- County
- Jefferson Parish · 426,999 people
- City population
- 39,578
- Metro
- New Orleans-Metairie, LA
- Population (ZIP)
- 39,578
- Household income
- $62,416
- Rent vs Own
- Severe rent burden
- 1992.0
Population outlook (Jefferson County) Hauer SSP2
- Today (2025)
- 451,696 people
- By 2030
- 455,451 · +0.8%
- By 2040
- 458,308 · +1.5%
- By 2050
- 461,031 · +2.1%
- By 2075
- 476,351 · +5.5%
- By 2100
- 499,377 · +10.6%
Race, ethnicity, and origin ACS 2023
- Neighborhood character
- Diverse neighborhood (Simpson 0.60)
- Race & ethnicity
- Black 58% White 20% Hispanic / Latino 13% Asian 7% Two or more races 4%
- Hispanic origin (detail)
- Mexican 1% Dominican 1%
- Common ancestry
- Lithuanian 4% Hispanic 1%
- Foreign-born
- 13% · Canada, Vietnam
- Languages at home
- 81% English-only · Spanish 10% Vietnamese 5% French/Haitian/Cajun 2%
Political lean MEDSL · Jefferson
- 2024 margin
- R (+12.9) · D 42.5% · R 55.5% · Other 2.1%
- 2008→2024 swing
- +13.6pp toward D · 2008: -26.6pp · 2024: -12.9pp
- All cycles
- 2024: R+12.9 2020: R+11.1 2016: R+14.8 2012: R+18.4 2008: R+26.6
Not yet ingested
- Civics
- —
Market trends
- HPI YoY
- ▼ -96.82%
- Current HPI
- 156.1052
- Rent YoY
- ▼ -3.88%
- Metro
- New Orleans-Metairie, LA
- State GDP YoY
- ▲ 3.29%
- F500 in state
- 10
Industry mix (Fortune 500 HQ in LA)
| Industry | F500 HQs | Revenue |
|---|---|---|
| Telecommunications | 2 | $23B |
|
||
| Utilities | 1 | $12B |
|
||
| Wholesale / Distribution | 1 | $5B |
|
||
| Advertising | 1 | $2B |
|
||
Price history
+188.5% since first listed7 events — show timeline
- 2026-04-14 Listed $150,000 AcadianaMLS
- 2026-04-14 Listed $150,000 GSREIN
- 2023-10-13 Sold (MLS) $56,000 GSREIN
- 2023-09-12 Pending — GSREIN
- 2023-09-01 Listed $52,000 AcadianaMLS
- 2023-09-01 Listed $52,000 GSREIN
- 2000-08-01 Sold (Public Records) — Public Records
Property tax history
+5.1%/yrLatest (2025): $1,561 · +121.5% YoY. Source: county tax records.
Cash-flow waterfall
monthlySold comps — $/sqft
last 12 mo · ≤1 miLoading sold comps…