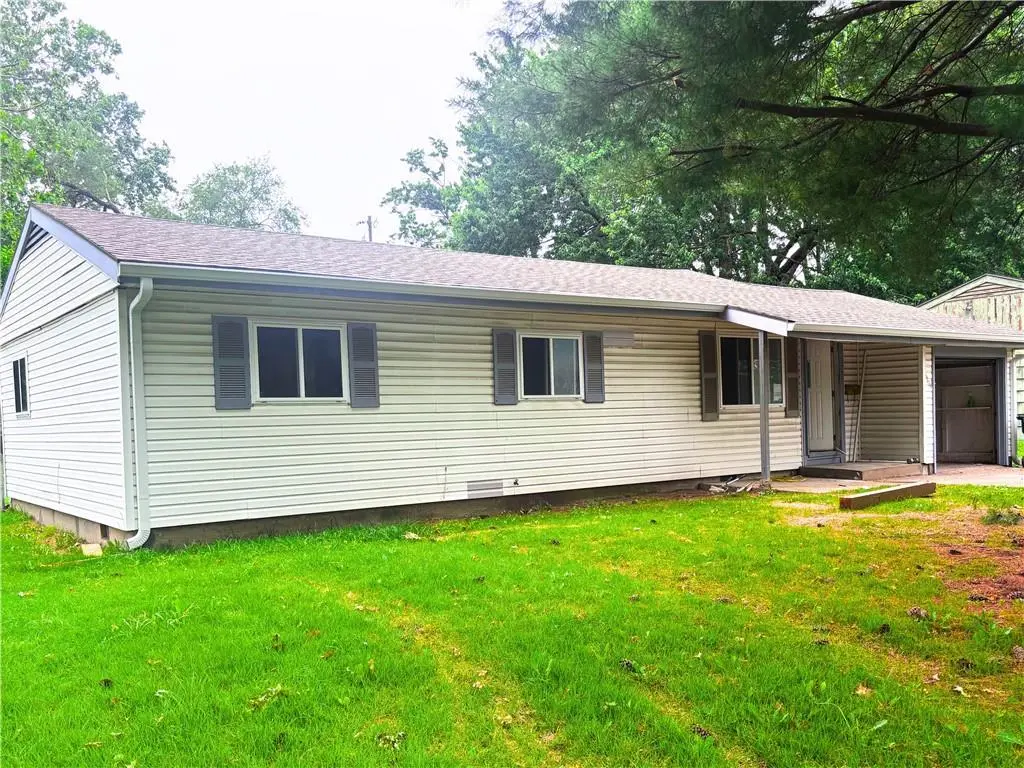
6114 N Virginia Ave · Gladstone, MO
Flood risk 1/10 · Minimal
- FEMA flood zone
- X (unshaded)
- Chance of flooding over 30 yrs
- 0.0%
- Est. flood insurance / yr
- $507 – $1,088
Fire risk 1/10 · Minimal
- Est. fire insurance / yr
- $1,054 – $1,958
Heat risk 4/10 · Minor
- Hot days now (above 106°F)
- 7 days/yr
- Hot days in 30 yrs
- 17 days/yr
Wind risk 2/10 · Minimal
- Chance of severe wind over 30 yrs
- —
Air-quality risk 3/10 · Minor
- Unhealthy air days now
- 2 days/yr
- Unhealthy air days in 30 yrs
- 3 days/yr
Risk factors via First Street. Map © Google.
Why this score? — see what drove the D+ grade
The composite is a weighted blend of 9 inputs, each scored 0–100. Each bar is that input's sub-score; the figure is the points it added to the 100-point composite (weight × sub-score).
- Cash flow +13.4/30.0
- ARV discount +13.0/15.0
- DSCR +4.0/10.0
- Schools +3.8/10.0
- Livability +3.8/5.0
- Rent growth +3.3/5.0
- 1% rule +3.2/10.0
- Condition / age +2.5/5.0
- Appreciation +0.0/10.0
$199,900
🖨 Deal sheet 📄 Offer letter ✓ Due diligence
Listing remarks MLS
THIS HOME IS BEING SOLD AS IS. NEEDS WORK INCLUDING BUT NOT LIMITED TO INSPECTIONS FOR ENVIRONMENTAL HAZARDS. SHORT SALE BUYER APPROVAL IS REQUIRED AND CAN TAKE MONTHS FOR APPROVAL, NO FINANCING, NO CREATIVE DEAL STRUCTURING, NO SIGHT AND UNSEEN OFFERS.
Key facts
- 0.24 acre lot
- Garage
- Built 1955
Property features AI
Finance
- HOA & community: No HOA
Exterior
- Parking: Attached garage facing front; 1-car garage
- Utilities: Public water; Public sewer
- Home design: Single-family residence; Residential property; Ranch floor plan; Attached property
- Construction: Vinyl siding; Composition roof
- Exterior features: Patio; Metal fencing; Satellite dish allowed; Shed(s)
Interior
- Kitchen: Dishwasher; Disposal; Free-standing electric oven
- Bedrooms: 3 bedrooms
- Flooring: Carpet; Vinyl
- Bathrooms: 1 full bathroom
- Heating & cooling: Natural gas heating; Electric cooling (central cooling present)
- Interior features: Liv/dining combo; Crawl space basement
- Laundry & utility: Main-level laundry
Neighborhood map
What this means for you Summary
Snapshot
- This is a 3-bed/1.0-bath single-family listed at $200k.
Deal economics
- At list price, monthly cash flow is $3 ($31/yr) — positive.
- The deal already cash-flows at list — no discount required.
- To meet the 1% rule (rent ≥ 1% of price), the offer needs to be $164k (18.0% below list).
- Recommended offer: $164k (18.0% below list) — sets the bar for 1% rule.
- Cap rate 6.3% vs local median 4.4% in Gladstone — top-decile yield for the area; either an underpriced asset or a hidden risk that comps aren't pricing in. Stress-test before assuming the spread holds.
Location & tenants
- Location reads 76/100 on livability (#44 in MO, #3,612 nationally) — a middle-class / working-renter tenant base. Strengths: cost of living A+, housing A+, health & safety A+; Watch: crime C-, amenities F, commute F.
- North Kansas City 74 (urban): math 38% / reading 49% proficiency, ranked #98 of 324 in MO (top 30%) — families likely to look elsewhere, expect single-tenant / working-renter base with shorter leases.
- Zoned schools: Oakwood Manor Elementary (math 22% / reading 27%, grade F, #879 of 1,115 statewide, top 81%, 194 students, 51% FRL); Oak Park High (math 36% / reading 56%, grade D-, #170 of 521 statewide, top 33%, 1,756 students, 42% FRL).
- Market conditions: Rents rising (+3.2%/yr); 183 active listings in the ZIP; 10 comparable units currently listed for rent nearby; rentals at typical pace (median 21d on market — plan ~3-4 weeks tenant-placement turnaround); 341 units permitted in Clay County in 2024 (40 in 5+ unit buildings).
Forward outlook
- Local home prices are declining (-3.0%/yr); year-one equity from $1k of loan paydown is wiped out by about $6k of value loss. Plan a longer hold.
- Clay County population projected at +24% by 2050 — long-run rental-demand tailwind backs the buy-and-hold thesis.
Negotiation context
- Only 5 days on market — expect competitive offers; lowballing is unlikely to land.
- 3 sale attempts since 17y ago with the ask held roughly flat each time — persistent listings suggest the price (not the market) is what's stuck; bring a comps-based counter.
Risks & watch-outs
- Watch-outs: built in 1955 — expect roof / HVAC / electrical / plumbing capex.
Questions for the listing agent
- Built in 1955 — when were the roof, HVAC, electrical panel, plumbing, and water heater last replaced?
- Is there a deadline driving the sale (1031 exchange, divorce, estate, relocation)? That informs how much negotiation room exists.
- The area grade is low — what's the realistic commute time and amenity access for the typical tenant pool here? Any planned neighborhood developments (good or bad) we should know about?
- What's the average days-on-market for RENTAL listings here right now (not sales)? A rising rental-DOM trend means longer vacancies and softer asking-rent achievability than the comps imply.
- What's the recent tenant-quality profile in this submarket — average credit score on applications, eviction rate, late-payment / NSF rate, and stable-employment percentage? A property-management company in the area should have these aggregated.
- How much new for-sale + rental construction is in the pipeline within 1–3 miles? Heavy new supply typically softens prices + rents 12–24 months out; constrained supply supports both.
Investment metrics
- 1% rule
- 0.82% ✗
- Cap rate
- 6.31%
- Cash-on-cash
- 0.06%
- DSCR
- 1.00
- GRM
- 10.2
CMA / ARV
- ARV (on-the-fly)
- $227,850
- Comps found
- 12
Show comp detail 12 sales within ~0.75 mi
| Address | Dist | Beds/Ba | Sqft | Sold | Price | $/sf | Match |
|---|---|---|---|---|---|---|---|
| 6114 N Virginia Ave | 0.00mi | 3/1.0 | 1,050 (0%) | 2mo | $180,000 | $171 | 98 |
| 1005 NE 62nd St | 0.17mi | 3/1.5 | 1,050 (0%) | 1mo | $227,950 | $217 | 90 |
| 6004 N Tracy Ave | 0.17mi | 3/1.0 | 1,100 (+5%) | 1mo | $235,000 | $214 | 84 |
| 6000 N Tracy Ave | 0.20mi | 3/1.0 | 940 (-10%) | 3mo | $210,000 | $223 | 71 |
| 6201 N Howard Ave | 0.55mi | 3/1.0 | 1,030 (-2%) | 3mo | $230,000 | $223 | 69 |
| 6500 N Harrison St | 0.50mi | 3/1.0 | 1,104 (+5%) | 2mo | $215,000 | $195 | 66 |
| 5818 N Garfield Ave | 0.55mi | 3/1.0 | 977 (-7%) | 2mo | $220,000 | $225 | 61 |
| 2403 NE 61st Ter | 0.73mi | 3/2.0 | 1,076 (+2%) | 1mo | $229,950 | $214 | 58 |
| 1002 NE 62nd St N/A | 0.22mi | 4/2.0 (+1) | 1,200 (+14%) | 1mo | $239,900 | $200 | 56 |
| 1007 NE 67th St | 0.68mi | 3/1.5 | 1,120 (+7%) | 0mo | $250,000 | $223 | 55 |
| 6521 N Campbell St | 0.65mi | 3/2.0 | 1,134 (+8%) | 2mo | $248,900 | $219 | 51 |
| 5709 N Woodland Ave | 0.58mi | 3/1.0 | 1,200 (+14%) | 2mo | $199,999 | $167 | 47 |
Match score weights: distance 35% · size 25% · config 20% · recency 20%. Top-matched comps best support the ARV.
Projected returns pro-forma
-3.0% appreciation · 3.2% rent growth · sell at horizon
- IRR
- -16.0%
- Equity multiple
- 0.43×
- Total profit
- $-31,928
- Equity at exit
- $29,806
- IRR
- -7.4%
- Equity multiple
- 0.53×
- Total profit
- $-26,352
- Equity at exit
- $17,284
Cash invested: $55,972 (down + closing). Projections, not guarantees.
Landlord ↔ Tenant lean methodology
- Overall (STATE)
- 81 Strongly Landlord-Friendly
- State Missouri
- 81 Strongly Landlord-Friendly · R+10
- County
- — inherits STATE
- City
- — inherits STATE
ZIP-level market 64118
- Rents YoY
- 3.2%
- Active inventory
- 183
- Price-to-rent
- 10.2×
Monthly cashflow live
- Estimated rent
- $1,639 high interval (Pro) →
- Mortgage (P&I)
- −$1,048
- Tax from tax record
- −$160 /mo · $1,924/yr
- Insurance
- −$83
- HOA
- −$0
- Vacancy / Maint / Mgmt
- −$344
- Net cashflow
- $3
Break-even live
UW: 25.0% down · 7.5% · 30yr · 1.5% tax · 5.0% vac · 8.0% maint · 8.0% mgmt
Financing live
Cash to close
- Down payment
- $49,975
- Closing costs
- $5,997
- Reserves months
- —
- Total cash needed
- —
Loan-product check · same deal, 3 products live
Conventional
25% down · 7.5% · 30yr
- Down + closing
- —
- Monthly P&I
- —
- Monthly cashflow
- —
- DSCR
- —
- Eligible?
- —
Personal DTI + credit; lowest rate.
DSCR
20% down · 8.5% · 30yr
- Down + closing
- —
- Monthly P&I
- —
- Monthly cashflow
- —
- DSCR
- —
- Eligible?
- —
No personal income docs; deal must DSCR.
Hard money
10% down · 12.0% · 12mo
- Down + closing
- —
- Monthly P&I
- —
- Monthly cashflow
- —
- DSCR
- —
- Eligible?
- —
Short-term bridge; refi at stabilization.
Rent comps 10 comps
| Address | Beds | Baths | Sqft | Rent | $/sqft | DOM | Units | Dist |
|---|---|---|---|---|---|---|---|---|
| 6011 N Forest Ave Kansas City, MO | 3.0 | 1.0 | 986 | $1,595 | $1.62 | 7d | 1 | 0.16mi |
| 900 NE 62nd St Kansas City, MO | 4.0 | 2.0 | 1317 | $1,916 | $1.45 | 23d | 1 | 0.30mi |
| 2307 NE 59th St Kansas City, MO | 3.0 | 1.0 | 1150 | $1,710 | $1.49 | 21d | 1 | 0.74mi |
| 1403 NE 67th Pl Kansas City, MO | 3.0 | 1.0 | 1132 | $1,626 | $1.44 | 4d | 1 | 0.80mi |
| 2813 A NE Kendallwood Pkwy Gladstone, MO | 1.0–3.0 | 1.0–2.5 | 1079 | $1,895 | $1.76 | 43d | 1 | 1.03mi |
| 450 NE 68th St Kansas City, MO | 1.0–2.0 | 1.0–1.5 | 835 | $1,305 | $1.56 | 2d | 17 | 1.05mi |
| 2483 NE 68th St Kansas City, MO | 2.0 | 2.0 | 928 | $1,325 | $1.43 | 4d | 1 | 1.11mi |
| 325 NW 62nd Ter Kansas City, MO | 2.0 | 1.0 | 780 | $1,150 | $1.47 | 23d | 1 | 1.14mi |
| 2404 NE 70th St Gladstone, MO | 1.0–2.0 | 1.0–2.0 | 857 | $1,075 | $1.25 | 43d | 1 | 1.32mi |
| 6024 N Jefferson St Kansas City, MO | 1.0–3.0 | 1.0–2.0 | 1109 | $1,595 | $1.44 | 2d | 11 | 1.33mi |
Listing history 18 events
-
2026-06-03days on market $199,900 Coming Soon 5 DOM
-
2026-06-02days on market $199,900 Coming Soon 4 DOM
-
2026-06-01days on market $199,900 Coming Soon 3 DOM
-
2026-05-31days on market $199,900 Coming Soon 2 DOM
-
2026-05-29historical $199,900
-
2026-04-16soldstatus Closed 253-char remark
Show marketing remark (253 chars)
THIS HOME IS BEING SOLD AS IS. NEEDS WORK INCLUDING BUT NOT LIMITED TO INSPECTIONS FOR ENVIRONMENTAL HAZARDS. SHORT SALE BUYER APPROVAL IS REQUIRED AND CAN TAKE MONTHS FOR APPROVAL, NO FINANCING, NO CREATIVE DEAL STRUCTURING, NO SIGHT AND UNSEEN OFFERS.
-
2025-11-22price $180,000 253-char remark
Show marketing remark (253 chars)
THIS HOME IS BEING SOLD AS IS. NEEDS WORK INCLUDING BUT NOT LIMITED TO INSPECTIONS FOR ENVIRONMENTAL HAZARDS. SHORT SALE BUYER APPROVAL IS REQUIRED AND CAN TAKE MONTHS FOR APPROVAL, NO FINANCING, NO CREATIVE DEAL STRUCTURING, NO SIGHT AND UNSEEN OFFERS.
-
2025-10-04historical Active Under Contract 253-char remark
Show marketing remark (253 chars)
THIS HOME IS BEING SOLD AS IS. NEEDS WORK INCLUDING BUT NOT LIMITED TO INSPECTIONS FOR ENVIRONMENTAL HAZARDS. SHORT SALE BUYER APPROVAL IS REQUIRED AND CAN TAKE MONTHS FOR APPROVAL, NO FINANCING, NO CREATIVE DEAL STRUCTURING, NO SIGHT AND UNSEEN OFFERS.
-
2025-09-23$200,000 Active 253-char remark
Show marketing remark (253 chars)
THIS HOME IS BEING SOLD AS IS. NEEDS WORK INCLUDING BUT NOT LIMITED TO INSPECTIONS FOR ENVIRONMENTAL HAZARDS. SHORT SALE BUYER APPROVAL IS REQUIRED AND CAN TAKE MONTHS FOR APPROVAL, NO FINANCING, NO CREATIVE DEAL STRUCTURING, NO SIGHT AND UNSEEN OFFERS.
-
2021-03-26soldstatus
-
2021-03-23soldstatus Closed 583-char remark
Show marketing remark (583 chars)
Your search is over. This home is fresh, updated and ready for you! You'll love the kitchen with painted cabinets, new SS appliances, granite counters & trendy backsplash. The easy care exterior with vinyl siding & windows, flat/fenced yard & patio saves you time and money. Gladstone address & no KC E-tax. Take advantage of everything Gladstone has to offer from the Community Center, pool and parks. Easy access to highways, downtown KC, KCI, Ford Claycomo, hospitals, shopping and restaurants. At this price, your house payment may be less than your rent!
-
2021-03-10status Pending 583-char remark
Show marketing remark (583 chars)
Your search is over. This home is fresh, updated and ready for you! You'll love the kitchen with painted cabinets, new SS appliances, granite counters & trendy backsplash. The easy care exterior with vinyl siding & windows, flat/fenced yard & patio saves you time and money. Gladstone address & no KC E-tax. Take advantage of everything Gladstone has to offer from the Community Center, pool and parks. Easy access to highways, downtown KC, KCI, Ford Claycomo, hospitals, shopping and restaurants. At this price, your house payment may be less than your rent!
-
2021-02-24historical Active Under Contract 583-char remark
Show marketing remark (583 chars)
Your search is over. This home is fresh, updated and ready for you! You'll love the kitchen with painted cabinets, new SS appliances, granite counters & trendy backsplash. The easy care exterior with vinyl siding & windows, flat/fenced yard & patio saves you time and money. Gladstone address & no KC E-tax. Take advantage of everything Gladstone has to offer from the Community Center, pool and parks. Easy access to highways, downtown KC, KCI, Ford Claycomo, hospitals, shopping and restaurants. At this price, your house payment may be less than your rent!
-
2021-02-19$147,500 Active 583-char remark
Show marketing remark (583 chars)
Your search is over. This home is fresh, updated and ready for you! You'll love the kitchen with painted cabinets, new SS appliances, granite counters & trendy backsplash. The easy care exterior with vinyl siding & windows, flat/fenced yard & patio saves you time and money. Gladstone address & no KC E-tax. Take advantage of everything Gladstone has to offer from the Community Center, pool and parks. Easy access to highways, downtown KC, KCI, Ford Claycomo, hospitals, shopping and restaurants. At this price, your house payment may be less than your rent!
-
2021-01-15soldstatus
-
2018-06-07soldstatus
-
2010-04-16historical
-
2009-10-16$84,900
ⓘ Source: listings_history table (triggers on properties + properties_extension) + one-shot
backfill from property_details.listing_events for pre-trigger history.
Tax reassessment forecast MO · Resets to sale price
- Current annual tax
- $1,924 · $160/mo
- Projected year-2 tax
- $1,939 · $162/mo
- Expected delta
- +$15/yr (+$1/mo · 0.8%)
ⓘ Screening estimate from a state-policy table — verify with the county assessor before closing.
Climate risk First Street
- Flood 1/10 Low FEMA zone X (unshaded) · 0% chance over 30 yrs
- Wildfire 1/10 Low
- Heat 4/10 Moderate 7 d/yr ≥106°F today · 17 d/yr by 30 yrs out
- Wind 2/10 Low
- Air quality 3/10 Moderate 2 unhealthy d/yr today · 3 by 30 yrs out
Nearby sold comps map
Loading sold comps map…
Walkable amenities ~0.75 mi
Loading nearby amenities…
Taxation est. · year 1
- Rental income
- $19,664
- − Mortgage interest
- −$11,198
- − Property taxes
- −$1,924
- − Insurance
- −$1,000
- − Repairs & maintenance
- −$1,573
- − Management
- −$1,573
- − Depreciation
- −$5,815
- Taxable loss
- −$3,419
- Est. tax savings @ 24.0%
- +$821
- After-tax cash flow
- $852/yr
For passive investors: Depreciation is non-cash, so a rental often shows a tax loss while cash-flowing — sheltering income. Rental losses are passive: they offset passive income freely, and up to $25,000/yr can offset ordinary (W-2) income if you actively participate and your MAGI is under $100k (phasing out to $0 by $150k); unused losses carry forward. On sale, claimed depreciation is recaptured at up to 25%, and gains may owe capital-gains tax (a 1031 exchange can defer both). Figures are a year-1 estimate at your 24.0% rate — not tax advice; consult a CPA.
Schools (NCES district)
- District
- North Kansas City 74
- NCES district ID
- 2922800
- Math proficiency
- 38% ▼ -11.00%
- Reading proficiency
- 49% ▼ -3.00%
- Median HH income
- $55,444
- Composite
- 37.88/100
- National rank
- #4321
- State rank
- #98 of 324 in MO
Livability — Gladstone
- Score
- 76/100
- State rank
- #44
- US rank
- #3612
Category grades
Schools grade is shown separately in the Schools card above.
Census & demographics
- Census place
- Gladstone, MO
- County
- Clay County · 220,651 people
- City population
- 41,984
- Metro
- Kansas City, MO-KS
- Population (ZIP)
- 41,984
- Household income
- $74,740
- Rent vs Own
- Severe rent burden
- 1629.0
Population outlook (Clay County) Hauer SSP2
- Today (2025)
- 266,022 people
- By 2030
- 280,057 · +5.3%
- By 2040
- 306,153 · +15.1%
- By 2050
- 328,630 · +23.5%
- By 2075
- 375,182 · +41.0%
- By 2100
- 392,861 · +47.7%
Race, ethnicity, and origin ACS 2023
- Neighborhood character
- Predominantly White (72%)
- Race & ethnicity
- White 72% Black 10% Hispanic / Latino 10% Two or more races 9% Asian 2%
- Hispanic origin (detail)
- Mexican 6%
- Common ancestry
- Slovak 2% Lithuanian 2% Italian 2%
- Foreign-born
- 7% · Canada, China, Vietnam
- Languages at home
- 90% English-only · Spanish 4% Arabic 1% Other Asian/Pacific 1%
Political lean MEDSL · Clay
- 2024 margin
- Lean R (+5.6) · D 46.4% · R 52.0% · Other 1.6%
- 2008→2024 swing
- -4.9pp toward R · 2008: -0.7pp · 2024: -5.6pp
- All cycles
- 2024: R+5.6 2020: R+4.1 2016: R+11.1 2012: R+8.4 2008: R+0.7
Not yet ingested
- Civics
- —
Market trends
- HPI YoY
- ▼ -250.16%
- Current HPI
- 240.9626
- Rent YoY
- ▲ 3.20%
- Metro
- Kansas City, MO-KS
- State GDP YoY
- ▲ 1.84%
- F500 in state
- 20
Industry mix (Fortune 500 HQ in MO)
| Industry | F500 HQs | Revenue |
|---|---|---|
| Healthcare | 1 | $163B |
|
||
| Insurance | 1 | $21B |
|
||
| Industrial Technology | 1 | $17B |
|
||
| Retail | 1 | $16B |
|
||
| Industrial Distribution | 1 | $10B |
|
||
| Utilities | 1 | $9B |
|
||
Price history
+135.5% since first listed14 events — show timeline
- 2026-05-29 Coming Soon $199,900 Heartland MLS as Distributed by MLS Grid
- 2026-04-16 Sold (MLS) — Heartland MLS as Distributed by MLS Grid
- 2025-11-22 Price Changed $180,000 Heartland MLS as Distributed by MLS Grid
- 2025-10-04 Contingent — Heartland MLS as Distributed by MLS Grid
- 2025-09-23 Listed $200,000 Heartland MLS as Distributed by MLS Grid
- 2021-03-26 Sold (Public Records) — Public Records
- 2021-03-23 Sold (MLS) — Heartland MLS as Distributed by MLS Grid
- 2021-03-10 Pending — Heartland MLS as Distributed by MLS Grid
- 2021-02-24 Contingent — Heartland MLS as Distributed by MLS Grid
- 2021-02-19 Listed $147,500 Heartland MLS as Distributed by MLS Grid
- 2021-01-15 Sold (Public Records) — Public Records
- 2018-06-07 Sold (Public Records) — Public Records
- 2010-04-16 Listing Removed — Heartland MLS as Distributed by MLS Grid
- 2009-10-16 Listed $84,900 Heartland MLS as Distributed by MLS Grid
Property tax history
+4.7%/yrLatest (2025): $1,924 · +11.6% YoY. Source: county tax records.
Cash-flow waterfall
monthlySold comps — $/sqft
last 12 mo · ≤1 miLoading sold comps…