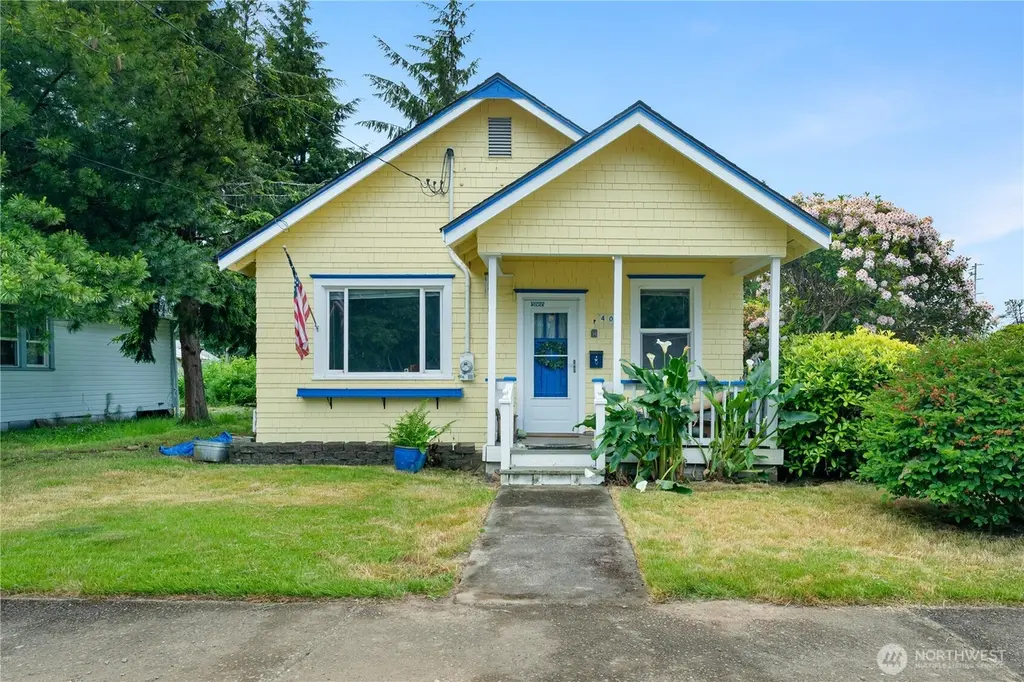
407 W King St · Aberdeen, WA
Flood risk 1/10 · Minimal
- FEMA flood zone
- X
- Chance of flooding over 30 yrs
- 0.0%
- Est. flood insurance / yr
- $507 – $1,088
Fire risk 1/10 · Minimal
- Est. fire insurance / yr
- $604 – $1,122
Heat risk 1/10 · Minimal
- Hot days now (above 78°F)
- 8 days/yr
- Hot days in 30 yrs
- 17 days/yr
Wind risk 1/10 · Minimal
- Chance of severe wind over 30 yrs
- —
Air-quality risk 6/10 · Moderate
- Unhealthy air days now
- 7 days/yr
- Unhealthy air days in 30 yrs
- 7 days/yr
Risk factors via First Street. Map © Google.
Why this score? — see what drove the C grade
The composite is a weighted blend of 9 inputs, each scored 0–100. Each bar is that input's sub-score; the figure is the points it added to the 100-point composite (weight × sub-score).
- Cash flow +20.2/30.0
- ARV discount +15.0/15.0
- DSCR +6.4/10.0
- 1% rule +4.3/10.0
- Livability +4.0/5.0
- Rent growth +3.6/5.0
- Schools +3.6/10.0
- Condition / age +2.5/5.0
- Appreciation +0.0/10.0
$150,000
🖨 Deal sheet 📄 Offer letter ✓ Due diligence
Listing remarks
Built in 1924, this cozy single-story craftsmen includes 1172 sq. ft. of living space w/ tall ceilings, original trim and softwood floors underneath. Interior layout includes 2 bed, 1 full bath w/ a full living room, dining area, primary bedroom, primary bath w/ clawfoot tub, kitchen w/ eating space and new stainless steel fridge, utility room, and previous garage converted into a 2nd bedroom. The home features a newer roof, painted exterior w/ vinyl windows, updated electrical panel, covered front patio, utility shed, spacious back yard and driveway parking for RV's or personal vehicles. Cash or Conventional offers only, seller will not make any repairs.
Key facts
- Tall ceilings
- Softwood floors
- Newer roof
Tags
Property features AI
Finance
- Other: Zoning: R1 (city jurisdiction)
- Financial info: Listing available for cash purchase
Exterior
- Parking: Driveway; Off-street parking; RV parking
- Utilities: Electric energy source; Public water; Sewer connected; Electric water heater; Cable connected (Xfinity); Internet connected (Xfinity); Power provided by GH PUD
- Home design: Single family residence, one story; Entry on main level; North-facing; Built on lot; Fair condition
- Construction: Built circa 1924 (effective year); Wood construction; Composition roof; Pillar/Post/Pier foundation
- Exterior features: Wood exterior; Deck; Patio; Outbuildings; High-speed internet available; RV parking
Interior
- Kitchen: Dishwasher; Refrigerator; Stove/Range; Kitchen with eating space
- Bedrooms: 2 bedrooms (both on the main level)
- Flooring: Vinyl; Carpet
- Bathrooms: 1 full bathroom with bathtub and shower (on the main level)
- Heating & cooling: Baseboard heating; No cooling
- Interior features: Ceiling fan(s); Water heater; No basement
- Laundry & utility: Washer; Dryer; Utility room; Water heater located in utility area (electric)
Neighborhood map
What this means for you Summary
Snapshot
- This is a 2-bed/1.0-bath single-family listed at $150k.
Deal economics
- At list price, monthly cash flow is $190 ($2k/yr) — positive.
- The deal already cash-flows at list — no discount required.
- To meet the 1% rule (rent ≥ 1% of price), the offer needs to be $140k (6.9% below list).
- Recommended offer: $140k (6.9% below list) — sets the bar for 1% rule.
- Cap rate 7.8% vs local median 4.1% in Aberdeen — top-decile yield for the area; either an underpriced asset or a hidden risk that comps aren't pricing in. Stress-test before assuming the spread holds.
Location & tenants
- Location reads 81/100 on livability (#73 in WA, #1,320 nationally) — a professional / high-income tenant draw. Strengths: amenities A+, commute A+, cost of living A+; Watch: crime D-, employment F.
- Aberdeen School District (town): math 35% / reading 45% proficiency, ranked #222 of 291 in WA (top 76%) — families likely to look elsewhere, expect single-tenant / working-renter base with shorter leases; 61% free/reduced lunch — lower-income household profile, screen leases tightly.
- Zoned schools: J M Weatherwax High School (916 students, 63% FRL) — zoned schools at 63% FRL track the district average.
- Market conditions: Rents rising fast (+4.3%/yr); 257 active listings in the ZIP; 5 comparable units currently listed for rent nearby; rentals lingering (median 44d on market — plan ~5-8 weeks vacancy on turnover, expect pricing pressure); 100% of comp listings sitting > 30 days — soft ceiling on asking rent; 297 units permitted in Grays Harbor County in 2024 (17 in 5+ unit buildings).
Forward outlook
- Local home prices are declining (-3.0%/yr); year-one equity from $1k of loan paydown is wiped out by about $4k of value loss. Plan a longer hold.
- Grays Harbor County population projected at -24% by 2050 — secular population decline; favor cash flow + early exit over multi-decade hold.
Negotiation context
- Only 11 days on market — expect competitive offers; lowballing is unlikely to land.
- Current owner paid $42k; list at $150k implies a 257% gain — meaningful room to come down on a strong offer.
Risks & watch-outs
- Watch-outs: built in 1924 — expect roof / HVAC / electrical / plumbing capex.
Questions for the listing agent
- Built in 1924 — when were the roof, HVAC, electrical panel, plumbing, and water heater last replaced?
- Is there a deadline driving the sale (1031 exchange, divorce, estate, relocation)? That informs how much negotiation room exists.
- Schools are D-rated, which usually means shorter tenancies and higher turnover. Who's the typical renter profile here, and what's been the actual vacancy rate?
- Crime grade is D in this area — have there been break-ins, vandalism, or insurance claims at this property in the last 3 years? What carrier currently insures it and at what premium?
- What's the average days-on-market for RENTAL listings here right now (not sales)? A rising rental-DOM trend means longer vacancies and softer asking-rent achievability than the comps imply.
- What's the recent tenant-quality profile in this submarket — average credit score on applications, eviction rate, late-payment / NSF rate, and stable-employment percentage? A property-management company in the area should have these aggregated.
- How much new for-sale + rental construction is in the pipeline within 1–3 miles? Heavy new supply typically softens prices + rents 12–24 months out; constrained supply supports both.
Investment metrics
- 1% rule
- 0.93% ✗
- Cap rate
- 7.82%
- Cash-on-cash
- 5.44%
- DSCR
- 1.24
- GRM
- 9.0
CMA / ARV
- ARV (on-the-fly)
- $209,568
- Comps found
- 11
Show comp detail 11 sales within ~0.75 mi
| Address | Dist | Beds/Ba | Sqft | Sold | Price | $/sf | Match |
|---|---|---|---|---|---|---|---|
| 603 W King St | 0.13mi | 2/1.0 | 896 (+1%) | 13mo | $255,000 | $285 | 82 |
| 311 W Marion St | 0.14mi | 2/1.0 | 923 (+4%) | 7mo | $110,000 | $119 | 81 |
| 218 W Cushing St | 0.20mi | 2/1.0 | 875 (-2%) | 20mo | $290,000 | $331 | 72 |
| 206 E Scott St | 0.32mi | 2/1.0 | 880 (-1%) | 20mo | $215,000 | $244 | 67 |
| 312 W Lovett St | 0.63mi | 2/1.0 | 892 (+0%) | 10mo | $175,000 | $196 | 62 |
| 907 W Stockwell St | 0.54mi | 2/1.0 | 864 (-3%) | 10mo | $170,000 | $197 | 62 |
| 213 W King St | 0.12mi | 3/1.0 (+1) | 792 (-11%) | 14mo | $259,000 | $327 | 60 |
| 927 W Marion St | 0.42mi | 2/1.0 | 768 (-14%) | 13mo | $179,000 | $233 | 47 |
| 221 E Lovett St | 0.74mi | 2/1.0 | 990 (+12%) | 15mo | $167,500 | $169 | 34 |
| 1111 W Perry St | 0.58mi | 3/1.0 (+1) | 1,008 (+14%) | 14mo | $282,000 | $280 | 33 |
| 1021 W Stockwell St | 0.63mi | 2/1.0 | 1,004 (+13%) | 21mo | $237,000 | $236 | 31 |
Match score weights: distance 35% · size 25% · config 20% · recency 20%. Top-matched comps best support the ARV.
Projected returns pro-forma
-3.0% appreciation · 4.35% rent growth · sell at horizon
- IRR
- -6.5%
- Equity multiple
- 0.75×
- Total profit
- $-10,308
- Equity at exit
- $22,365
- IRR
- 4.5%
- Equity multiple
- 1.35×
- Total profit
- $14,527
- Equity at exit
- $12,969
Cash invested: $42,000 (down + closing). Projections, not guarantees.
Landlord ↔ Tenant lean methodology
- Overall (STATE)
- 28 Tenant-Leaning
- State Washington
- 28 Tenant-Leaning · D+8
- County
- — inherits STATE
- City
- — inherits STATE
ZIP-level market 98520
- Rents YoY
- 4.3%
- Active inventory
- 257
- Price-to-rent
- 9.0×
Monthly cashflow live
- Estimated rent
- $1,396 high interval (Pro) →
- Mortgage (P&I)
- −$787
- Tax from tax record
- −$63 /mo · $758/yr
- Insurance
- −$62
- HOA
- −$0
- Vacancy / Maint / Mgmt
- −$293
- Net cashflow
- $190
Break-even live
UW: 25.0% down · 7.5% · 30yr · 1.5% tax · 5.0% vac · 8.0% maint · 8.0% mgmt
Financing live
Cash to close
- Down payment
- $37,500
- Closing costs
- $4,500
- Reserves months
- —
- Total cash needed
- —
Loan-product check · same deal, 3 products live
Conventional
25% down · 7.5% · 30yr
- Down + closing
- —
- Monthly P&I
- —
- Monthly cashflow
- —
- DSCR
- —
- Eligible?
- —
Personal DTI + credit; lowest rate.
DSCR
20% down · 8.5% · 30yr
- Down + closing
- —
- Monthly P&I
- —
- Monthly cashflow
- —
- DSCR
- —
- Eligible?
- —
No personal income docs; deal must DSCR.
Hard money
10% down · 12.0% · 12mo
- Down + closing
- —
- Monthly P&I
- —
- Monthly cashflow
- —
- DSCR
- —
- Eligible?
- —
Short-term bridge; refi at stabilization.
Rent comps 5 comps
| Address | Beds | Baths | Sqft | Rent | $/sqft | DOM | Units | Dist |
|---|---|---|---|---|---|---|---|---|
| 100 W Curtis St Aberdeen, WA | 2.0 | 2.0 | 900 | $1,500 | $1.67 | 43d | 1 | 0.24mi |
| 1200 W Huntley St Unit 3 Aberdeen, WA | 2.0 | 1.0 | 850 | $1,400 | $1.65 | 43d | 1 | 0.96mi |
| 1731 S Boone St Unit 303 Aberdeen, WA | 2.0 | 1.0 | 1100 | $1,250 | $1.14 | 43d | 1 | 1.20mi |
| 109 S Park St Apt 1 Aberdeen, WA | 2.0 | 1.0 | 800 | $1,375 | $1.72 | 44d | 1 | 1.41mi |
| 109 S Park St Apt 2 Aberdeen, WA | 3.0 | 1.0 | 950 | $1,450 | $1.53 | 43d | 1 | 1.41mi |
Listing history 10 events
-
2026-06-19days on market $150,000 Active 11 DOM
-
2026-06-18days on market $150,000 Active 10 DOM
-
2026-06-17days on market $150,000 Active 9 DOM
-
2026-06-17remarks 663-char remark
-
2026-06-16days on market $150,000 Active 8 DOM
-
2026-06-15days on market $150,000 Active 7 DOM
-
2026-06-14days on market $150,000 Active 5 DOM
-
2026-06-12days on market $150,000 Active 4 DOM
-
2026-06-09remarks 647-char remark
-
2026-06-09$150,000 Active 1 DOM
ⓘ Source: listings_history table (triggers on properties + properties_extension) + one-shot
backfill from property_details.listing_events for pre-trigger history.
Tax reassessment forecast WA · Resets to sale price
- Current annual tax
- $758 · $63/mo
- Projected year-2 tax
- $1,470 · $122/mo
- Expected delta
- +$712/yr (+$59/mo · 93.9%)
ⓘ Screening estimate from a state-policy table — verify with the county assessor before closing.
Climate risk First Street
- Flood 1/10 Low FEMA zone X · 0% chance over 30 yrs
- Wildfire 1/10 Low
- Heat 1/10 Low 8 d/yr ≥78°F today · 17 d/yr by 30 yrs out
- Wind 1/10 Low
- Air quality 6/10 Major 7 unhealthy d/yr today · 7 by 30 yrs out
Nearby sold comps map
Loading sold comps map…
Walkable amenities ~0.75 mi
Loading nearby amenities…
Taxation est. · year 1
- Rental income
- $16,751
- − Mortgage interest
- −$8,402
- − Property taxes
- −$758
- − Insurance
- −$750
- − Repairs & maintenance
- −$1,340
- − Management
- −$1,340
- − Depreciation
- −$4,364
- Taxable loss
- −$203
- Est. tax savings @ 24.0%
- +$49
- After-tax cash flow
- $2,335/yr
For passive investors: Depreciation is non-cash, so a rental often shows a tax loss while cash-flowing — sheltering income. Rental losses are passive: they offset passive income freely, and up to $25,000/yr can offset ordinary (W-2) income if you actively participate and your MAGI is under $100k (phasing out to $0 by $150k); unused losses carry forward. On sale, claimed depreciation is recaptured at up to 25%, and gains may owe capital-gains tax (a 1031 exchange can defer both). Figures are a year-1 estimate at your 24.0% rate — not tax advice; consult a CPA.
Schools (NCES district)
- District
- Aberdeen School District
- NCES district ID
- 5300030
- Math proficiency
- 35% ▼ -1.00%
- Reading proficiency
- 45% ▬ 0.00%
- Median HH income
- $41,896
- Composite
- 36.13/100
- National rank
- #9477
- State rank
- #222 of 291 in WA
Livability — Aberdeen
- Score
- 81/100
- State rank
- #73
- US rank
- #1320
Category grades
Schools grade is shown separately in the Schools card above.
Census & demographics
- Census place
- Aberdeen, WA
- County
- Grays Harbor County · 44,693 people
- City population
- 24,888
- Metro
- Aberdeen, WA
- Population (ZIP)
- 24,888
- Household income
- $58,153
- Rent vs Own
- Severe rent burden
- 635.0
Population outlook (Grays Harbor County) Hauer SSP2
- Today (2025)
- 66,443 people
- By 2030
- 63,255 · -4.8%
- By 2040
- 56,466 · -15.0%
- By 2050
- 50,516 · -24.0%
- By 2075
- 39,296 · -40.9%
- By 2100
- 31,142 · -53.1%
Race, ethnicity, and origin ACS 2023
- Neighborhood character
- Predominantly White (70%)
- Race & ethnicity
- White 70% Hispanic / Latino 16% Two or more races 9% Black 4% Native American 3% Asian 1% Pacific Islander 1%
- Hispanic origin (detail)
- Mexican 11%
- Common ancestry
- Portuguese 4% Italian 3% Lithuanian 2%
- Foreign-born
- 7% · Canada
- Languages at home
- 87% English-only · Spanish 10% Other Asian/Pacific 1% German/W. Germanic 1%
Political lean MEDSL · Grays Harbor
- 2024 margin
- Lean R (+6.0) · D 45.6% · R 51.6% · Other 2.8%
- 2008→2024 swing
- -20.6pp toward R · 2008: 14.6pp · 2024: -6.0pp
- All cycles
- 2024: R+6.0 2020: R+6.6 2016: R+7.1 2012: D+14.0 2008: D+14.6
Not yet ingested
- Civics
- —
Market trends
- HPI YoY
- ▼ -138.75%
- Current HPI
- 207.7393
- Rent YoY
- ▲ 4.35%
- Metro
- Aberdeen, WA
- State GDP YoY
- ▲ 4.65%
- F500 in state
- 22
Industry mix (Fortune 500 HQ in WA)
| Industry | F500 HQs | Revenue |
|---|---|---|
| Retail | 2 | $269B |
|
||
| Technology / Retail | 1 | $638B |
|
||
| Technology | 1 | $245B |
|
||
| Telecommunications | 1 | $38B |
|
||
| Food / Beverage | 1 | $36B |
|
||
| Automotive / Trucks | 1 | $34B |
|
||
Price history
+328.6% since first listed3 events — show timeline
- 2026-06-08 Listed $150,000 NWMLS as Distributed by MLS Grid
- 2002-03-05 Sold (Public Records) $42,000 Public Records
- 1999-09-13 Sold (Public Records) $35,000 Public Records
Property tax history
+0.9%/yrLatest (2016): $758 · +7.7% YoY. Source: county tax records.
Cash-flow waterfall
monthlySold comps — $/sqft
last 12 mo · ≤1 miLoading sold comps…