 34-Plex
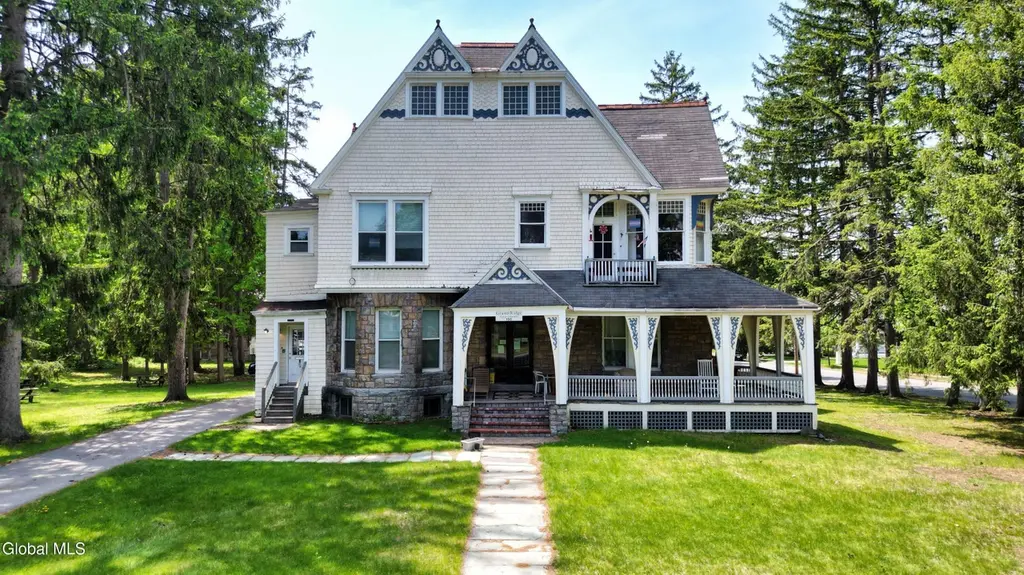
190 Ridge St · Glens Falls, NY
Flood risk 1/10 · Minimal
- FEMA flood zone
- X
- Chance of flooding over 30 yrs
- 0.0%
- Est. flood insurance / yr
- $473 – $860
Fire risk 2/10 · Minimal
- Est. fire insurance / yr
- $691 – $1,283
Heat risk 3/10 · Minor
- Hot days now (above 95°F)
- 7 days/yr
- Hot days in 30 yrs
- 16 days/yr
Wind risk 2/10 · Minimal
- Chance of severe wind over 30 yrs
- 3.0%
Air-quality risk 1/10 · Minimal
- Unhealthy air days now
- 0 days/yr
- Unhealthy air days in 30 yrs
- 0 days/yr
Risk factors via First Street. Map © Google.
Why this score? — see what drove the B grade
The composite is a weighted blend of 9 inputs, each scored 0–100. Each bar is that input's sub-score; the figure is the points it added to the 100-point composite (weight × sub-score).
- Cash flow +30.0/30.0
- 1% rule +10.0/10.0
- DSCR +10.0/10.0
- ARV discount +7.5/15.0
- Livability +4.2/5.0
- Schools +4.1/10.0
- Rent growth +2.5/5.0
- Condition / age +2.5/5.0
- Appreciation +0.0/10.0
$2,290,000
🖨 Deal sheet 📄 Offer letter ✓ Due diligence
Multi-family units
County records classify this as Multi-Family (5+ Unit). Listing-text estimate: 34 units. confirmed
5+ unit building — per-unit beds/baths from public records are typically unavailable; the breakdown below (if shown) is an estimate from the listing text.
Listing remarks
Income-producing 34-unit multifamily assemblage spanning four buildings on approximately 2.23 acres in the City of Glens Falls. Four well-located properties -- 195 Ridge St. , 190 Ridge St. , 45 William St. , and 8 Lawton Ave. -- combine for a unit mix of 5 two-bedroom, 14 one-bedroom, and 15 studio apartments. Low vacancy and a stable rent roll drive consistent monthly cash flow, with ample on-site parking across all four buildings. Concentrated ownership in a single market makes this a manageable, scalable hold, with room to grow income through rent and operational improvements. Full financials provided to qualified buyers upon request. Schedule a private tour through the listing agent.
Key facts
- Unit mix
- Four buildings
- Low vacancy
Tags
Property features AI
Finance
- Other: Living area reported as 20,866 (value provided by listing)
- Financial info: Multi-family asset with 34 total units; Tenants are responsible for hot water, cable TV and electricity
Exterior
- Parking: 28 total parking spaces; Off-street paved parking
- Security: Smoke detectors; Carbon monoxide detectors
- Utilities: Public water; Public sewer; Cable available
- Home design: Multi-family property
- Construction: Stone, cedar, plaster and wood siding construction; Slate and asphalt shingle roof; Basement with exterior entry, full unfinished space and walk-out access
- Exterior features: Front, side, rear and covered porches; Porches include a front porch and rear porch; Barn(s) on the property; Level, landscaped corner lot with road frontage; Approximately 2.23-acre lot
Interior
- Kitchen: No specific kitchen appliance details provided
- Bedrooms: Multiple unit bedroom counts: units of various sizes (examples: units with 9, 17, 4, and 8 bedrooms)
- Flooring: Carpet; Hardwood
- Bathrooms: Multiple full bathrooms across units (total 34 full baths); Full baths located on first, second, and third levels depending on unit
- Heating & cooling: Baseboard heating; Hot water heating; Zoned heating; Natural gas heating; Window air conditioning units
- Interior features: Built-in features; Fireplace
- Laundry & utility: No specific laundry appliance details provided; Tenants pay for hot water
Neighborhood map
What this means for you Summary
Snapshot
- This is a 34 × 18-bed/34.0-bath units multifamily listed at $2.29M.
Deal economics
- At list price, monthly cash flow is $36k ($433k/yr) — positive. Per door: $1k/mo.
- The deal already cash-flows at list — no discount required.
- Meets the 1% rule at list price ($64k rent vs $2.29M).
- Recommended offer: $2.26M (1.5% below list) — sets the bar for market timing.
- Cap rate 25.2% vs local median 4.8% in Glens Falls — top-decile yield for the area; either an underpriced asset or a hidden risk that comps aren't pricing in. Stress-test before assuming the spread holds.
Location & tenants
- Location reads 83/100 on livability (#60 in NY, #894 nationally) — a professional / high-income tenant draw. Strengths: crime A+, amenities A+, housing A+.
- Glens Falls City School District (urban): math 44% / reading 53% proficiency, ranked #416 of 590 in NY (top 70%) — families likely to look elsewhere, expect single-tenant / working-renter base with shorter leases.
- Zoned schools: Glens Falls Senior High School (math 98% / reading 64%, grade A, #485 of 1,100 statewide, top 45%, 601 students, 41% FRL).
- Zoned-school proficiency averages 81% at this address vs 48% district-wide (+32 pts) — the actual schools serving this property are materially stronger than the Glens Falls City School District average implies; a family-tenant draw the district grade alone would hide.
- Market conditions: 56 active listings in the ZIP; 180 units permitted in Warren County in 2024 (40 in 5+ unit buildings).
Forward outlook
- Local home prices are declining (-3.0%/yr); year-one equity from $16k of loan paydown is wiped out by about $69k of value loss. Plan a longer hold.
- Warren County population projected at -19% by 2050 — secular population decline; favor cash flow + early exit over multi-decade hold.
- At projected returns (-3.0% appreciation + 3.0% rent growth), your $641k cash investment doubles in ~2 years — after that, you're playing with house money.
Negotiation context
- It's been on market 18 days — a 2% lower offer ($2.26M) is reasonable based on typical stale-listing flexibility.
- 7 sale attempts since 9y ago with the ask held roughly flat each time — persistent listings suggest the price (not the market) is what's stuck; bring a comps-based counter.
- Current owner paid $1.69M; 36% above their basis — modest negotiation headroom, anchor on the comps not their cost.
Risks & watch-outs
- Watch-outs: built in 1897 — expect roof / HVAC / electrical / plumbing capex.
Questions for the listing agent
- Can we see the unit-by-unit rent roll, current vacancy, and any below-market leases? What's the average tenancy length?
- What capital expenditures (roof, boiler, parking lot, exteriors) have been made in the last 5 years, and what's planned in the next 2?
- Built in 1897 — when were the roof, HVAC, electrical panel, plumbing, and water heater last replaced?
- Is there a deadline driving the sale (1031 exchange, divorce, estate, relocation)? That informs how much negotiation room exists.
- What's the average days-on-market for RENTAL listings here right now (not sales)? A rising rental-DOM trend means longer vacancies and softer asking-rent achievability than the comps imply.
- What's the recent tenant-quality profile in this submarket — average credit score on applications, eviction rate, late-payment / NSF rate, and stable-employment percentage? A property-management company in the area should have these aggregated.
- How much new apartment / multifamily construction is in the pipeline within 1–3 miles? Heavy new supply (>2% of stock underway) typically softens rents 12–24 months out; light construction supports rent growth.
Investment metrics
- 1% rule
- 2.78% ✓
- Cap rate
- 25.20%
- Cash-on-cash
- 67.51%
- DSCR
- 4.00
- GRM
- 3.0
CMA / ARV
No comps found within radius.
Projected returns pro-forma
-3.0% appreciation · 3.0% rent growth · sell at horizon
- IRR
- 66.9%
- Equity multiple
- 4.00×
- Total profit
- $1,926,338
- Equity at exit
- $341,446
- IRR
- 71.1%
- Equity multiple
- 8.23×
- Total profit
- $4,635,578
- Equity at exit
- $197,997
Cash invested: $641,200 (down + closing). Projections, not guarantees.
Landlord ↔ Tenant lean methodology
- Overall (STATE)
- 15 Strongly Tenant-Friendly
- State New York
- 15 Strongly Tenant-Friendly · D+10
- County
- — inherits STATE
- City
- — inherits STATE
ZIP-level market 12801
- Home prices YoY
- -13.7%
- Active inventory
- 56
- Price-to-rent
- 102.0×
Monthly cashflow live
- Estimated rent
- $63,617 medium interval (Pro) →
- Mortgage (P&I)
- −$12,009
- Tax from tax record
- −$1,222 /mo · $14,663/yr
- Insurance
- −$954
- HOA
- −$0
- Vacancy / Maint / Mgmt
- −$13,360
- Net cashflow
- $36,072
Break-even live
34-unit breakdown (identical units grouped — click to expand)
| Units | Beds | Baths | Est. rent |
|---|---|---|---|
| 34× units | 18 | 34 | $63,614 |
| #1 | 18 | 34 | $1,871 |
| #2 | 18 | 34 | $1,871 |
| #3 | 18 | 34 | $1,871 |
| #4 | 18 | 34 | $1,871 |
| #5 | 18 | 34 | $1,871 |
| #6 | 18 | 34 | $1,871 |
| #7 | 18 | 34 | $1,871 |
| #8 | 18 | 34 | $1,871 |
| #9 | 18 | 34 | $1,871 |
| #10 | 18 | 34 | $1,871 |
| #11 | 18 | 34 | $1,871 |
| #12 | 18 | 34 | $1,871 |
| #13 | 18 | 34 | $1,871 |
| #14 | 18 | 34 | $1,871 |
| #15 | 18 | 34 | $1,871 |
| #16 | 18 | 34 | $1,871 |
| #17 | 18 | 34 | $1,871 |
| #18 | 18 | 34 | $1,871 |
| #19 | 18 | 34 | $1,871 |
| #20 | 18 | 34 | $1,871 |
| #21 | 18 | 34 | $1,871 |
| #22 | 18 | 34 | $1,871 |
| #23 | 18 | 34 | $1,871 |
| #24 | 18 | 34 | $1,871 |
| #25 | 18 | 34 | $1,871 |
| #26 | 18 | 34 | $1,871 |
| #27 | 18 | 34 | $1,871 |
| #28 | 18 | 34 | $1,871 |
| #29 | 18 | 34 | $1,871 |
| #30 | 18 | 34 | $1,871 |
| #31 | 18 | 34 | $1,871 |
| #32 | 18 | 34 | $1,871 |
| #33 | 18 | 34 | $1,871 |
| #34 | 18 | 34 | $1,871 |
| Total (34 units) | $63,617 | ||
UW: 25.0% down · 7.5% · 30yr · 1.5% tax · 5.0% vac · 8.0% maint · 8.0% mgmt
Financing live
Cash to close
- Down payment
- $572,500
- Closing costs
- $68,700
- Reserves months
- —
- Total cash needed
- —
Loan-product check · same deal, 3 products live
Conventional
25% down · 7.5% · 30yr
- Down + closing
- —
- Monthly P&I
- —
- Monthly cashflow
- —
- DSCR
- —
- Eligible?
- —
Personal DTI + credit; lowest rate.
DSCR
20% down · 8.5% · 30yr
- Down + closing
- —
- Monthly P&I
- —
- Monthly cashflow
- —
- DSCR
- —
- Eligible?
- —
No personal income docs; deal must DSCR.
Hard money
10% down · 12.0% · 12mo
- Down + closing
- —
- Monthly P&I
- —
- Monthly cashflow
- —
- DSCR
- —
- Eligible?
- —
Short-term bridge; refi at stabilization.
Listing history 13 events
-
2026-06-19days on market $2,290,000 Active 18 DOM
-
2026-06-18days on market $2,290,000 Active 17 DOM
-
2026-06-17days on market $2,290,000 Active 16 DOM
-
2026-06-16days on market $2,290,000 Active 15 DOM
-
2026-06-15days on market $2,290,000 Active 14 DOM
-
2026-06-14days on market $2,290,000 Active 12 DOM
-
2026-06-12days on market $2,290,000 Active 11 DOM
-
2026-06-09days on market $2,290,000 Active 8 DOM
-
2026-06-08days on market $2,290,000 Active 7 DOM
-
2026-06-07days on market $2,290,000 Active 6 DOM
-
2026-06-04days on market $2,290,000 Active 2 DOM
-
2026-06-02remarks 697-char remark
-
2026-06-02$2,290,000 Active 1 DOM
ⓘ Source: listings_history table (triggers on properties + properties_extension) + one-shot
backfill from property_details.listing_events for pre-trigger history.
Tax reassessment forecast NY · Partial reset (capped growth)
- Current annual tax
- $14,663 · $1,222/mo
- Projected year-2 tax
- $26,682 · $2,224/mo
- Expected delta
- +$12,019/yr (+$1,002/mo · 82.0%)
ⓘ Screening estimate from a state-policy table — verify with the county assessor before closing.
Climate risk First Street
- Flood 1/10 Low FEMA zone X · 0% chance over 30 yrs
- Wildfire 2/10 Low
- Heat 3/10 Moderate 7 d/yr ≥95°F today · 16 d/yr by 30 yrs out
- Wind 2/10 Low 3% chance of damaging wind over 30 yrs
- Air quality 1/10 Low 0 unhealthy d/yr today · 0 by 30 yrs out
Nearby sold comps map
Loading sold comps map…
Walkable amenities ~0.75 mi
Loading nearby amenities…
Taxation est. · year 1
- Rental income
- $763,404
- − Mortgage interest
- −$128,276
- − Property taxes
- −$14,663
- − Insurance
- −$11,450
- − Repairs & maintenance
- −$61,072
- − Management
- −$61,072
- − Depreciation
- −$66,618
- Taxable income
- $420,252
- Est. tax owed @ 24.0%
- −$100,861
- After-tax cash flow
- $332,007/yr
For passive investors: Depreciation is non-cash, so a rental often shows a tax loss while cash-flowing — sheltering income. Rental losses are passive: they offset passive income freely, and up to $25,000/yr can offset ordinary (W-2) income if you actively participate and your MAGI is under $100k (phasing out to $0 by $150k); unused losses carry forward. On sale, claimed depreciation is recaptured at up to 25%, and gains may owe capital-gains tax (a 1031 exchange can defer both). Figures are a year-1 estimate at your 24.0% rate — not tax advice; consult a CPA.
Schools (NCES district)
- District
- Glens Falls City School District
- NCES district ID
- 3612240
- Math proficiency
- 44% ▼ -8.00%
- Reading proficiency
- 53% ▲ 6.00%
- Median HH income
- $48,216
- Composite
- 41.34/100
- National rank
- #3499
- State rank
- #416 of 590 in NY
Livability — Glens Falls
- Score
- 83/100
- State rank
- #60
- US rank
- #894
Category grades
Schools grade is shown separately in the Schools card above.
Census & demographics
- Census place
- Glens Falls, NY
- County
- Warren County · 14,628 people
- City population
- 14,628
- Metro
- Glens Falls, NY
- Population (ZIP)
- 14,628
- Household income
- $67,577
- Rent vs Own
- Severe rent burden
- 866.0
Population outlook (Warren County) Hauer SSP2
- Today (2025)
- 62,372 people
- By 2030
- 60,491 · -3.0%
- By 2040
- 55,616 · -10.8%
- By 2050
- 50,437 · -19.1%
- By 2075
- 40,843 · -34.5%
- By 2100
- 31,159 · -50.0%
Race, ethnicity, and origin ACS 2023
- Neighborhood character
- Predominantly White (90%)
- Race & ethnicity
- White 90% Two or more races 6% Hispanic / Latino 3% Black 2%
- Common ancestry
- Lithuanian 9% Romanian 5% Slovak 5%
- Foreign-born
- 3% · Canada, Dominican Republic
- Languages at home
- 97% English-only · Spanish 1% German/W. Germanic 1%
Political lean MEDSL · Warren
- 2024 margin
- Toss-up / Even · D 47.9% · R 52.1%
- 2008→2024 swing
- -6.9pp toward R · 2008: 2.6pp · 2024: -4.2pp
- All cycles
- 2024: R+4.2 2020: R+0.2 2016: R+10.6 2012: D+2.1 2008: D+2.6
Not yet ingested
- Civics
- —
Market trends
- HPI YoY
- ▼ -52.28%
- Current HPI
- 330.581
- Rent YoY
- —
- Metro
- Glens Falls, NY
- State GDP YoY
- ▲ 2.60%
- F500 in state
- 92
Industry mix (Fortune 500 HQ in NY)
| Industry | F500 HQs | Revenue |
|---|---|---|
| Financial Services | 10 | $950B |
|
||
| Consumer Goods | 9 | $162B |
|
||
| Insurance | 4 | $225B |
|
||
| Telecommunications | 2 | $144B |
|
||
| Pharmaceuticals | 2 | $112B |
|
||
| Media / Entertainment | 2 | $69B |
|
||
Price history
+27.6% since first listed16 events — show timeline
- 2026-06-01 Price Changed $2,290,000 Global MLS
- 2026-06-01 Listed $2,229,000 Global MLS
- 2026-05-15 Listing Removed — Global MLS
- 2026-05-08 Listed $2,290,000 Global MLS
- 2023-05-18 Pending — Global MLS
- 2023-05-12 Listing Removed — Global MLS
- 2023-03-08 Listing Removed — Global MLS
- 2023-03-08 Listed $2,350,000 Global MLS
- 2023-01-10 Price Changed $1,075,000 Global MLS
- 2022-11-11 Listing Removed — Global MLS
- 2022-11-11 Listed $1,100,000 Global MLS
- 2022-05-09 Listed $2,399,000 Global MLS
- 2022-01-26 Listing Removed — Global MLS
- 2021-07-08 Listed $2,600,000 Global MLS
- 2018-01-30 Sold (MLS) $1,690,000 Global MLS
- 2017-09-04 Listed $1,795,000 Global MLS
Property tax history
+12.6%/yrLatest (2025): $14,663 · +1.0% YoY. Source: county tax records.
Cash-flow waterfall
monthlySold comps — $/sqft
last 12 mo · ≤1 miLoading sold comps…