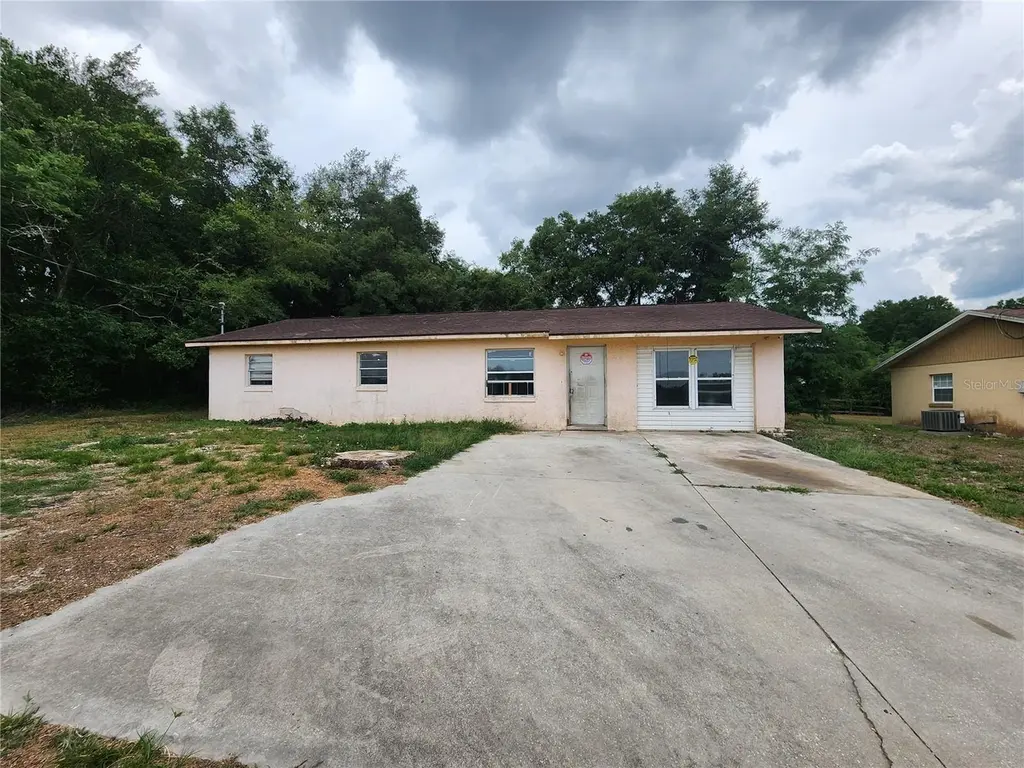
921 NW 60th Ave · Ocala, FL
Flood risk 1/10 · Minimal
- FEMA flood zone
- X (unshaded)
- Chance of flooding over 30 yrs
- 0.0%
- Est. flood insurance / yr
- $507 – $1,088
Fire risk 5/10 · Moderate
- Est. fire insurance / yr
- $947 – $1,759
Heat risk 8/10 · Major
- Hot days now (above 107°F)
- 7 days/yr
- Hot days in 30 yrs
- 21 days/yr
Wind risk 9/10 · Severe
- Chance of severe wind over 30 yrs
- 99.0%
Air-quality risk 3/10 · Minor
- Unhealthy air days now
- 3 days/yr
- Unhealthy air days in 30 yrs
- 3 days/yr
Risk factors via First Street. Map © Google.
Why this score? — see what drove the B+ grade
The composite is a weighted blend of 9 inputs, each scored 0–100. Each bar is that input's sub-score; the figure is the points it added to the 100-point composite (weight × sub-score).
- Cash flow +30.0/30.0
- ARV discount +15.0/15.0
- 1% rule +10.0/10.0
- DSCR +10.0/10.0
- Rent growth +5.0/5.0
- Schools +3.6/10.0
- Livability +3.5/5.0
- Condition / age +2.5/5.0
- Appreciation +0.0/10.0
$105,000
🖨 Deal sheet 📄 Offer letter ✓ Due diligence
Listing remarks MLS
Cash Only. Sold AS-IS, NO assignable contracts. Opportunity awaits for investors or buyers ready to take on a full renovation project. This property is in need of repairs and is being sold AS-IS. No HOA. With the right remodel, this home has the potential to become an excellent primary residence or rental property. Bring your vision, contractor, and creativity. Located just 4 miles from WEC!
Key facts
- No hoa restrictions
- 7,405 sq ft lot
- Built 1980
Tags
Property features AI
Finance
- Other: Zoning: R2; Lot about 0.17 acres (0 to less than 1/4 acre); Building area total listed (public records) and living area noted (public records)
- Financial info: Tax information not included per instructions
- HOA & community: No association
Exterior
- Parking: No parking details provided
- Security: No security features listed
- Utilities: Well water; Septic tank; Other utilities
- Home design: Single-family residence; Residential property; Faces east; One story; Entry level on one
- Construction: Block construction; Shingle roof; Slab foundation; Built as a fixer
- Exterior features: Cleared lot; Sidewalk; Paved road access
Interior
- Kitchen: No appliances listed
- Bedrooms: 4 bedrooms
- Flooring: Other flooring
- Bathrooms: 2 full baths, 1 half bath
- Heating & cooling: Other heating; No cooling
- Interior features: Other interior features
- Laundry & utility: Other laundry features
Neighborhood map
What this means for you Summary
Snapshot
- This is a 3-bed/2.0-bath single-family listed at $105k.
Deal economics
- At list price, monthly cash flow is $862 ($10k/yr) — positive.
- The deal already cash-flows at list — no discount required.
- Meets the 1% rule at list price ($2k rent vs $105k).
- Cap rate 16.1% vs local median 4.2% in Ocala — top-decile yield for the area; either an underpriced asset or a hidden risk that comps aren't pricing in. Stress-test before assuming the spread holds.
Location & tenants
- Location reads 69/100 on livability (#476 in FL) — a middle-class / working-renter tenant base. Strengths: cost of living A+, housing A+, health & safety A+; Watch: crime F, amenities F, commute F.
- Marion (rural): math 42% / reading 43% proficiency, ranked #61 of 73 in FL (top 84%) — families likely to look elsewhere, expect single-tenant / working-renter base with shorter leases; 61% free/reduced lunch — lower-income household profile, screen leases tightly.
- Market conditions: Rents rising fast (+11.1%/yr); 663 active listings in the ZIP; 13 comparable units currently listed for rent nearby; rentals at typical pace (median 21d on market — plan ~3-4 weeks tenant-placement turnaround); 7,071 units permitted in Marion County in 2024 (534 in 5+ unit buildings).
- This rent runs 35% of the median local income ($66k/yr) — at the standard rent-burdened threshold; future hikes will face affordability resistance.
Forward outlook
- Local home prices are declining (-3.0%/yr); year-one equity from $726 of loan paydown is wiped out by about $3k of value loss. Plan a longer hold.
- Marion County population projected at +13% by 2050 — modest demand growth; plan on rents tracking national, not racing it.
- At projected returns (-3.0% appreciation + 8.0% rent growth), your $29k cash investment doubles in ~4 years — after that, you're playing with house money.
Negotiation context
- Only 12 days on market — expect competitive offers; lowballing is unlikely to land.
- 6 sale attempts since 16y ago with the ask held roughly flat each time — persistent listings suggest the price (not the market) is what's stuck; bring a comps-based counter.
- Current owner paid $82k; 28% above their basis — modest negotiation headroom, anchor on the comps not their cost.
Risks & watch-outs
- Climate carrying-cost: severe wind risk, 99% chance of damaging wind over 30y; moderate wildfire risk; extreme-heat days projected 7→21/yr by 2055 (HVAC capex compounding) — expect insurance premiums to compound above CPI over the hold.
Questions for the listing agent
- Is there a deadline driving the sale (1031 exchange, divorce, estate, relocation)? That informs how much negotiation room exists.
- Crime grade is F in this area — have there been break-ins, vandalism, or insurance claims at this property in the last 3 years? What carrier currently insures it and at what premium?
- What's the average days-on-market for RENTAL listings here right now (not sales)? A rising rental-DOM trend means longer vacancies and softer asking-rent achievability than the comps imply.
- What's the recent tenant-quality profile in this submarket — average credit score on applications, eviction rate, late-payment / NSF rate, and stable-employment percentage? A property-management company in the area should have these aggregated.
- How much new for-sale + rental construction is in the pipeline within 1–3 miles? Heavy new supply typically softens prices + rents 12–24 months out; constrained supply supports both.
Investment metrics
- 1% rule
- 1.84% ✓
- Cap rate
- 16.15%
- Cash-on-cash
- 35.20%
- DSCR
- 2.57
- GRM
- 4.5
CMA / ARV
- ARV (median comp)
- $206,386
- List price
- $105,000
- Delta
- -49.12%
- Verdict
- UNDERPRICED
- Comps
- 20 within 1.0 mi
Show comp detail 7 sales within ~0.75 mi
| Address | Dist | Beds/Ba | Sqft | Sold | Price | $/sf | Match |
|---|---|---|---|---|---|---|---|
| 5711 NW 4th St | 0.47mi | 3/2.0 | 1,028 (-1%) | 3mo | $190,000 | $185 | 74 |
| 5747 NW 4th St | 0.45mi | 3/2.0 | 1,028 (-1%) | 24mo | $225,000 | $219 | 57 |
| 5935 NW 14th St | 0.27mi | 3/2.0 | 1,173 (+13%) | 14mo | $225,000 | $192 | 54 |
| 5449 NW 2nd St | 0.73mi | 3/2.0 | 936 (-10%) | 10mo | $158,000 | $169 | 41 |
| 1035 NW 52nd Ct | 0.68mi | 3/2.0 | 1,181 (+14%) | 17mo | $215,000 | $182 | 32 |
| 1089 NW 52nd Ct | 0.68mi | 3/2.0 | 1,181 (+14%) | 17mo | $220,000 | $186 | 32 |
| 5339 NW 6th Pl | 0.63mi | 3/2.0 | 1,173 (+13%) | 24mo | $230,000 | $196 | 29 |
Match score weights: distance 35% · size 25% · config 20% · recency 20%. Top-matched comps best support the ARV.
Projected returns pro-forma
-3.0% appreciation · 8.0% rent growth · sell at horizon
- IRR
- 36.1%
- Equity multiple
- 2.64×
- Total profit
- $48,124
- Equity at exit
- $15,656
- IRR
- 45.3%
- Equity multiple
- 6.41×
- Total profit
- $159,127
- Equity at exit
- $9,078
Cash invested: $29,400 (down + closing). Projections, not guarantees.
Landlord ↔ Tenant lean methodology
- Overall (STATE)
- 87 Strongly Landlord-Friendly
- State Florida
- 87 Strongly Landlord-Friendly · R+3
- County
- — inherits STATE
- City
- — inherits STATE
ZIP-level market 34482
- Rents YoY
- 11.1%
- Active inventory
- 663
- Price-to-rent
- 4.5×
Monthly cashflow live
- Estimated rent
- $1,935 high interval (Pro) →
- Mortgage (P&I)
- −$551
- Tax from tax record
- −$72 /mo · $859/yr
- Insurance
- −$44
- HOA
- −$0
- Vacancy / Maint / Mgmt
- −$406
- Net cashflow
- $862
Break-even live
UW: 25.0% down · 7.5% · 30yr · 1.5% tax · 5.0% vac · 8.0% maint · 8.0% mgmt
Financing live
Cash to close
- Down payment
- $26,250
- Closing costs
- $3,150
- Reserves months
- —
- Total cash needed
- —
Loan-product check · same deal, 3 products live
Conventional
25% down · 7.5% · 30yr
- Down + closing
- —
- Monthly P&I
- —
- Monthly cashflow
- —
- DSCR
- —
- Eligible?
- —
Personal DTI + credit; lowest rate.
DSCR
20% down · 8.5% · 30yr
- Down + closing
- —
- Monthly P&I
- —
- Monthly cashflow
- —
- DSCR
- —
- Eligible?
- —
No personal income docs; deal must DSCR.
Hard money
10% down · 12.0% · 12mo
- Down + closing
- —
- Monthly P&I
- —
- Monthly cashflow
- —
- DSCR
- —
- Eligible?
- —
Short-term bridge; refi at stabilization.
Rent comps 13 comps
| Address | Beds | Baths | Sqft | Rent | $/sqft | DOM | Units | Dist |
|---|---|---|---|---|---|---|---|---|
| 5811 NW 10th St Unit 5811 Ocala, FL | 3.0 | 2.0 | 1162 | $1,649 | $1.42 | 21d | 1 | 0.15mi |
| 985 NW 57th Ct Unit 987 Ocala, FL | 3.0 | 2.0 | 1162 | $1,697 | $1.46 | 21d | 1 | 0.21mi |
| 985 NW 57th Ct Unit 985 Ocala, FL | 3.0 | 2.0 | 1162 | $1,649 | $1.42 | 21d | 1 | 0.21mi |
| 1017 NW 57th Ct Unit 1019 Ocala, FL | 3.0 | 2.0 | 1162 | $1,649 | $1.42 | 21d | 1 | 0.21mi |
| 933 NW 57th Ct Unit 935 Ocala, FL | 3.0 | 2.0 | 1162 | $1,649 | $1.42 | 21d | 1 | 0.22mi |
| 1527 NW 57th Ct Unit 1 Ocala, FL | 3.0 | 2.0 | 1460 | $1,550 | $1.06 | 21d | 1 | 0.37mi |
| 311 NW 60th Ave Ocala, FL | 3.0 | 2.0 | 1462 | $1,900 | $1.30 | 21d | 1 | 0.51mi |
| 5399 NW 18th St Ocala, FL | 2.0 | 2.0 | 1085 | $2,100 | $1.94 | 13d | 1 | 0.76mi |
| 5399 NW 18th St Ocala, FL | 2.0 | 2.0 | 1085 | $2,100 | $1.94 | 21d | 1 | 0.76mi |
| 1918 NW 50th Cir Ocala, FL | 2.0 | 2.0 | 1061 | $2,200 | $2.07 | 21d | 1 | 1.08mi |
| 2028 NW 50th Ave Ocala, FL | 2.0 | 2.0 | 1066 | $1,595 | $1.50 | 21d | 1 | 1.13mi |
| 2038 NW 50th Ave Ocala, FL | 2.0 | 2.0 | 1062 | $2,250 | $2.12 | 21d | 1 | 1.14mi |
| 2048 NW 50th Ave Ocala, FL | 2.0 | 2.0 | 1062 | $2,250 | $2.12 | 21d | 1 | 1.15mi |
Listing history 22 events
-
2026-06-15status $105,000 Pending 12 DOM
-
2026-06-15days on market $105,000 Active 12 DOM
-
2026-06-14days on market $105,000 Active 10 DOM
-
2026-06-13statusdays on market $105,000 Active 9 DOM
-
2026-06-01statusdays on market $105,000 Pending 8 DOM
-
2026-05-31days on market $105,000 Active 7 DOM
-
2026-05-30days on market $105,000 Active 6 DOM
-
2026-05-16status Pending 1133-char remark
-
2026-05-11$105,000 Active 1133-char remark
-
2026-03-10soldstatus $82,000
-
2026-03-06soldstatus $82,000 Closed 394-char remark
Show marketing remark (394 chars)
Cash Only. Sold AS-IS, NO assignable contracts. Opportunity awaits for investors or buyers ready to take on a full renovation project. This property is in need of repairs and is being sold AS-IS. No HOA. With the right remodel, this home has the potential to become an excellent primary residence or rental property. Bring your vision, contractor, and creativity. Located just 4 miles from WEC!
-
2026-02-18status Pending 394-char remark
Show marketing remark (394 chars)
Cash Only. Sold AS-IS, NO assignable contracts. Opportunity awaits for investors or buyers ready to take on a full renovation project. This property is in need of repairs and is being sold AS-IS. No HOA. With the right remodel, this home has the potential to become an excellent primary residence or rental property. Bring your vision, contractor, and creativity. Located just 4 miles from WEC!
-
2026-02-10$90,000 Active 394-char remark
Show marketing remark (394 chars)
Cash Only. Sold AS-IS, NO assignable contracts. Opportunity awaits for investors or buyers ready to take on a full renovation project. This property is in need of repairs and is being sold AS-IS. No HOA. With the right remodel, this home has the potential to become an excellent primary residence or rental property. Bring your vision, contractor, and creativity. Located just 4 miles from WEC!
-
2026-02-02soldstatus $36,143
-
2011-11-03soldstatus $62,900
-
2011-06-02soldstatus $25,000
Show marketing remark (218 chars)
3/2/. 5 Home in Ocala Ridge Subdivision on 0.17 Acres. Ceiling fans, living room, kitchen, enclosed garage as a Bonus room. Screened Porch. Great home for the price! Appliances convey if on property at time of closing.
-
2010-12-02$26,900
Show marketing remark (218 chars)
3/2/. 5 Home in Ocala Ridge Subdivision on 0.17 Acres. Ceiling fans, living room, kitchen, enclosed garage as a Bonus room. Screened Porch. Great home for the price! Appliances convey if on property at time of closing.
-
2010-11-29historical
-
2010-08-18$36,900
-
2003-10-10soldstatus $43,500
-
1991-06-01soldstatus $37,500
-
1980-05-01soldstatus $34,500
ⓘ Source: listings_history table (triggers on properties + properties_extension) + one-shot
backfill from property_details.listing_events for pre-trigger history.
Tax reassessment forecast FL · Resets to sale price
- Current annual tax
- $859 · $72/mo
- Projected year-2 tax
- $872 · $73/mo
- Expected delta
- +$13/yr (+$1/mo · 1.5%)
ⓘ Screening estimate from a state-policy table — verify with the county assessor before closing.
Climate risk First Street
- Flood 1/10 Low FEMA zone X (unshaded) · 0% chance over 30 yrs
- Wildfire 5/10 Major
- Heat 8/10 Severe 7 d/yr ≥107°F today · 21 d/yr by 30 yrs out
- Wind 9/10 Extreme 99% chance of damaging wind over 30 yrs
- Air quality 3/10 Moderate 3 unhealthy d/yr today · 3 by 30 yrs out
Nearby sold comps map
Loading sold comps map…
Walkable amenities ~0.75 mi
Loading nearby amenities…
Taxation est. · year 1
- Rental income
- $23,214
- − Mortgage interest
- −$5,882
- − Property taxes
- −$859
- − Insurance
- −$525
- − Repairs & maintenance
- −$1,857
- − Management
- −$1,857
- − Depreciation
- −$3,055
- Taxable income
- $9,180
- Est. tax owed @ 24.0%
- −$2,203
- After-tax cash flow
- $8,145/yr
For passive investors: Depreciation is non-cash, so a rental often shows a tax loss while cash-flowing — sheltering income. Rental losses are passive: they offset passive income freely, and up to $25,000/yr can offset ordinary (W-2) income if you actively participate and your MAGI is under $100k (phasing out to $0 by $150k); unused losses carry forward. On sale, claimed depreciation is recaptured at up to 25%, and gains may owe capital-gains tax (a 1031 exchange can defer both). Figures are a year-1 estimate at your 24.0% rate — not tax advice; consult a CPA.
Schools (NCES district)
- District
- Marion
- NCES district ID
- 1201260
- Math proficiency
- 42% ▼ -7.00%
- Reading proficiency
- 43% ▼ -4.00%
- Median HH income
- $40,015
- Composite
- 35.61/100
- National rank
- #4890
- State rank
- #61 of 73 in FL
Livability — Ocala
- Score
- 69/100
- State rank
- #476
- US rank
- #8461
Category grades
Schools grade is shown separately in the Schools card above.
Census & demographics
- County
- Marion County · 315,796 people
- City population
- 263,375
- Metro
- Ocala, FL
- Population (ZIP)
- 22,807
- Household income
- $65,901
- Rent vs Own
- Severe rent burden
- 282.0
Population outlook (Marion County) Hauer SSP2
- Today (2025)
- 365,905 people
- By 2030
- 376,768 · +3.0%
- By 2040
- 396,555 · +8.4%
- By 2050
- 412,723 · +12.8%
- By 2075
- 446,090 · +21.9%
- By 2100
- 436,193 · +19.2%
Race, ethnicity, and origin ACS 2023
- Neighborhood character
- Majority White (63%)
- Race & ethnicity
- White 63% Hispanic / Latino 19% Black 14% Two or more races 12%
- Hispanic origin (detail)
- Mexican 6% Puerto Rican 9% Cuban 2%
- Common ancestry
- Lithuanian 2% Romanian 2% Slovak 2%
- Foreign-born
- 10% · Canada
- Languages at home
- 81% English-only · Spanish 16% Other Indo-European 1%
Political lean MEDSL · Marion
- 2024 margin
- Solid R (+31.6) · D 33.8% · R 65.5%
- 2008→2024 swing
- -20.0pp toward R · 2008: -11.6pp · 2024: -31.6pp
- All cycles
- 2024: R+31.6 2020: R+25.9 2016: R+26.2 2012: R+16.2 2008: R+11.6
Not yet ingested
- Civics
- —
Market trends
- HPI YoY
- ▼ -133.62%
- Current HPI
- 194.3857
- Rent YoY
- ▲ 11.12%
- Metro
- Ocala, FL
- State GDP YoY
- ▲ 3.28%
- F500 in state
- 36
Industry mix (Fortune 500 HQ in FL)
| Industry | F500 HQs | Revenue |
|---|---|---|
| Industrial Technology | 2 | $29B |
|
||
| Insurance | 2 | $17B |
|
||
| Retail | 1 | $60B |
|
||
| Technology Distribution | 1 | $58B |
|
||
| Homebuilding | 1 | $35B |
|
||
| Technology Manufacturing | 1 | $35B |
|
||
Price history
+204.3% since first listed19 events — show timeline
- 2026-06-15 Pending — Stellar MLS as Distributed by MLS Grid
- 2026-06-11 Relisted — Stellar MLS as Distributed by MLS Grid
- 2026-06-01 Pending — Stellar MLS as Distributed by MLS Grid
- 2026-05-29 Relisted — Stellar MLS as Distributed by MLS Grid
- 2026-05-16 Pending — Stellar MLS as Distributed by MLS Grid
- 2026-05-11 Listed $105,000 Stellar MLS as Distributed by MLS Grid
- 2026-03-10 Sold (Public Records) $82,000 Public Records
- 2026-03-06 Sold (MLS) $82,000 Stellar MLS as Distributed by MLS Grid
- 2026-02-18 Pending — Stellar MLS as Distributed by MLS Grid
- 2026-02-10 Listed $90,000 Stellar MLS as Distributed by MLS Grid
- 2026-02-02 Sold (Public Records) $36,143 Public Records
- 2011-11-03 Sold (Public Records) $62,900 Public Records
- 2011-06-02 Sold (MLS) $25,000 Stellar MLS as Distributed by MLS Grid
- 2010-12-02 Listed $26,900 Stellar MLS as Distributed by MLS Grid
- 2010-11-29 Listing Removed — Stellar MLS as Distributed by MLS Grid
- 2010-08-18 Listed $36,900 Stellar MLS as Distributed by MLS Grid
- 2003-10-10 Sold (Public Records) $43,500 Public Records
- 1991-06-01 Sold (Public Records) $37,500 Public Records
- 1980-05-01 Sold (Public Records) $34,500 Public Records
Property tax history
+4.4%/yrLatest (2025): $859 · +35.9% YoY. Source: county tax records.
Cash-flow waterfall
monthlySold comps — $/sqft
last 12 mo · ≤1 miLoading sold comps…