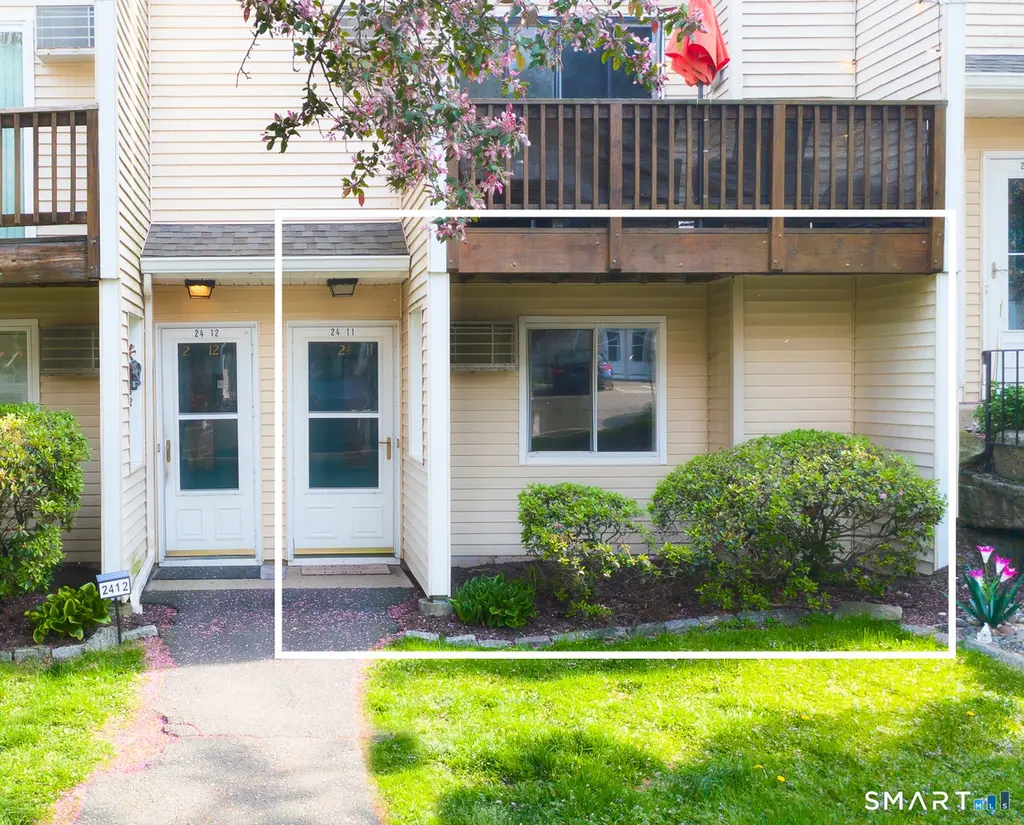
8 Rose Ln Unit 24-11 · Danbury, CT
Flood risk 1/10 · Minimal
- FEMA flood zone
- X (unshaded)
- Chance of flooding over 30 yrs
- 0.0%
- Est. flood insurance / yr
- $507 – $1,088
Fire risk 1/10 · Minimal
- Est. fire insurance / yr
- $829 – $1,539
Heat risk 4/10 · Minor
- Hot days now (above 99°F)
- 7 days/yr
- Hot days in 30 yrs
- 14 days/yr
Wind risk 5/10 · Moderate
- Chance of severe wind over 30 yrs
- 26.0%
Air-quality risk 3/10 · Minor
- Unhealthy air days now
- 3 days/yr
- Unhealthy air days in 30 yrs
- 4 days/yr
Risk factors via First Street. Map © Google.
Why this score? — see what drove the D grade
The composite is a weighted blend of 9 inputs, each scored 0–100. Each bar is that input's sub-score; the figure is the points it added to the 100-point composite (weight × sub-score).
- ARV discount +13.4/15.0
- Cash flow +9.5/30.0
- 1% rule +4.0/10.0
- Livability +3.8/5.0
- DSCR +2.7/10.0
- Rent growth +2.5/5.0
- Condition / age +2.5/5.0
- Schools +2.4/10.0
- Appreciation +0.0/10.0
$239,900
🖨 Deal sheet 📄 Offer letter ✓ Due diligence
Listing remarks MLS
Main level, shows well, storage under building. Walking Distance to the lake. Easy Access to 84 and shopping. See attachment for PAS requirements and WFHM offer submittal information in MLS document section. Common Charges are $253.60
Key facts
- In-ground pool
- Single-level living
- Wood cabinetry
Tags
Property features AI
Finance
- HOA & community: Monthly HOA fee of $305; HOA covers grounds maintenance, trash pickup, snow removal, water, sewer, property management, pest control, pool service and insurance; Professional off-site property management; Pets allowed with restrictions (ask)
Exterior
- Utilities: Public water; Public sewer
- Home design: Condominium (Park Ridge complex); Condo/Co-op; Single-story residence
- Construction: Frame construction
- Exterior features: Vinyl siding; Level lot; In-ground swimming pool; Community pool service
Interior
- Kitchen: Electric range; Microwave; Dishwasher
- Bedrooms: One bedroom
- Bathrooms: One full bathroom
- Heating & cooling: Baseboard heat (electric); Wall air-conditioning unit
- Interior features: One-level unit; One fireplace; No basement
- Laundry & utility: Washer and electric dryer; 30-gallon electric hot water tank
Neighborhood map
What this means for you Summary
Snapshot
- This is a 1-bed/1.0-bath condo listed at $240k.
Deal economics
- At list price, monthly cash flow is $-168 ($-2k/yr) — negative.
- To cash-flow at today's rent, offer at most $210k (12.4% below list).
- To meet the 1% rule (rent ≥ 1% of price), the offer needs to be $217k (9.6% below list).
- Recommended offer: $210k (12.4% below list) — sets the bar for cash-flow.
- Cap rate 5.5% vs local median 3.6% in Danbury — top-decile yield for the area; either an underpriced asset or a hidden risk that comps aren't pricing in. Stress-test before assuming the spread holds.
Location & tenants
- Location reads 76/100 on livability (#51 in CT, #3,379 nationally) — a middle-class / working-renter tenant base. Strengths: commute A+, housing A+, health & safety A+; Watch: schools D+, amenities F, cost of living F.
- Danbury School District (urban): math 19% / reading 32% proficiency, ranked #131 of 153 in CT (top 86%) — low school quality limits family demand, transient renter base, plan for 1-2y turnover.
- Market conditions: 121 active listings in the ZIP; 8 comparable units currently listed for rent nearby; rentals at typical pace (median 24d on market — plan ~3-4 weeks tenant-placement turnaround); solid renter incomes; 1,151 units permitted in Western Connecticut Planning Region in 2024 (714 in 5+ unit buildings).
Forward outlook
- Local home prices are declining (-3.0%/yr); year-one equity from $2k of loan paydown is wiped out by about $7k of value loss. Plan a longer hold.
Negotiation context
- It's been on market 43 days — a 3% lower offer ($233k) is reasonable based on typical stale-listing flexibility.
- 2 sale attempts since 12y ago with the ask held roughly flat each time — persistent listings suggest the price (not the market) is what's stuck; bring a comps-based counter.
- Current owner paid $105k; list at $240k implies a 128% gain — meaningful room to come down on a strong offer.
Risks & watch-outs
- Climate carrying-cost: moderate wind risk, 26% chance of damaging wind over 30y — expect insurance premiums to compound above CPI over the hold.
Questions for the listing agent
- What do current leases actually rent for vs. the listed asking? Can we see a recent rent roll and the last 12 months of T-12 income?
- It's been on market 43 days. Have you received any prior offers? Is the seller open to a 12% concession, seller financing, or rate buy-down credit?
- What does the HOA fee cover, when was the last increase, and are there any pending special assessments or reserve-fund shortfalls?
- Any open or pending special assessments — roof, HVAC, plumbing, elevator, façade? What's the per-unit balance and payoff schedule, and is the seller paying it off at close or rolling it to the buyer?
- Is there a deadline driving the sale (1031 exchange, divorce, estate, relocation)? That informs how much negotiation room exists.
- Schools are D-rated, which usually means shorter tenancies and higher turnover. Who's the typical renter profile here, and what's been the actual vacancy rate?
- The area grade is low — what's the realistic commute time and amenity access for the typical tenant pool here? Any planned neighborhood developments (good or bad) we should know about?
- What's the average days-on-market for RENTAL listings here right now (not sales)? A rising rental-DOM trend means longer vacancies and softer asking-rent achievability than the comps imply.
- What's the recent tenant-quality profile in this submarket — average credit score on applications, eviction rate, late-payment / NSF rate, and stable-employment percentage? A property-management company in the area should have these aggregated.
- How much new apartment / multifamily construction is in the pipeline within 1–3 miles? Heavy new supply (>2% of stock underway) typically softens rents 12–24 months out; light construction supports rent growth.
Investment metrics
- 1% rule
- 0.90% ✗
- Cap rate
- 5.45%
- Cash-on-cash
- -3.00%
- DSCR
- 0.87
- GRM
- 9.2
CMA / ARV
- ARV (median comp)
- $276,033
- List price
- $239,900
- Delta
- -13.09%
- Verdict
- UNDERPRICED
- Comps
- 20 within 1.0 mi
Projected returns pro-forma
-3.0% appreciation · 3.0% rent growth · sell at horizon
- IRR
- -21.2%
- Equity multiple
- 0.26×
- Total profit
- $-49,410
- Equity at exit
- $35,770
- IRR
- -14.5%
- Equity multiple
- 0.16×
- Total profit
- $-56,120
- Equity at exit
- $20,742
Cash invested: $67,172 (down + closing). Projections, not guarantees.
Landlord ↔ Tenant lean methodology
- Overall (STATE)
- 27 Tenant-Leaning
- State Connecticut
- 27 Tenant-Leaning · D+7
- County
- — inherits STATE
- City
- — inherits STATE
ZIP-level market 06811
- Active inventory
- 121
- Price-to-rent
- 9.2×
Monthly cashflow live
- Estimated rent
- $2,168 high interval (Pro) →
- Mortgage (P&I)
- −$1,258
- Tax from tax record
- −$218 /mo · $2,616/yr
- Insurance
- −$100
- HOA
- −$305
- Vacancy / Maint / Mgmt
- −$455
- Net cashflow
- $-168
Break-even live
UW: 25.0% down · 7.5% · 30yr · 1.5% tax · 5.0% vac · 8.0% maint · 8.0% mgmt
Financing live
Cash to close
- Down payment
- $59,975
- Closing costs
- $7,197
- Reserves months
- —
- Total cash needed
- —
Loan-product check · same deal, 3 products live
Conventional
25% down · 7.5% · 30yr
- Down + closing
- —
- Monthly P&I
- —
- Monthly cashflow
- —
- DSCR
- —
- Eligible?
- —
Personal DTI + credit; lowest rate.
DSCR
20% down · 8.5% · 30yr
- Down + closing
- —
- Monthly P&I
- —
- Monthly cashflow
- —
- DSCR
- —
- Eligible?
- —
No personal income docs; deal must DSCR.
Hard money
10% down · 12.0% · 12mo
- Down + closing
- —
- Monthly P&I
- —
- Monthly cashflow
- —
- DSCR
- —
- Eligible?
- —
Short-term bridge; refi at stabilization.
Rent comps 8 comps
| Address | Beds | Baths | Sqft | Rent | $/sqft | DOM | Units | Dist |
|---|---|---|---|---|---|---|---|---|
| 20 Cornell Rd Danbury, CT | 2.0 | 1.0 | 800 | $2,600 | $3.25 | 43d | 1 | 0.24mi |
| 7 Padanaram Rd Unit C53 Danbury, CT | 2.0 | 1.0 | 851 | $2,150 | $2.53 | 3d | 1 | 0.30mi |
| 7 Padanaram Rd Unit J243 Danbury, CT | 1.0 | 1.0 | 604 | $1,700 | $2.81 | 23d | 1 | 0.30mi |
| 2 Jeanette Rd #43 Danbury, CT | 1.0 | 1.0 | 741 | $2,300 | $3.10 | 43d | 1 | 0.36mi |
| 2 Jeanette St Unit 67 Danbury, CT | 1.0 | 1.0 | 741 | $1,850 | $2.50 | 23d | 1 | 0.59mi |
| 10 Clapboard Ridge Rd Danbury, CT | 1.0–3.0 | 1.0–2.0 | 1061 | $2,206 | $2.08 | 2d | 20 | 1.18mi |
| 53 Sand Pit Rd Danbury, CT | 1.0–3.0 | 1.0–2.0 | 1131 | $2,095 | $1.85 | 3d | 1 | 1.34mi |
| 35 9th Ave Unit 1R Danbury, CT | 2.0 | 1.0 | 650 | $2,100 | $3.23 | 14d | 1 | 1.50mi |
HOA detail condo
- Monthly dues
- $305 · $3,660/yr
- Assessments
- None detected in remarks — confirm with the listing agent.
Listing history 19 events
-
2026-06-18days on market $239,900 Active 43 DOM
-
2026-06-17days on market $239,900 Active 42 DOM
-
2026-06-16days on market $239,900 Active 41 DOM
-
2026-06-15days on market $239,900 Active 40 DOM
-
2026-06-13days on market $239,900 Active 38 DOM
-
2026-06-10days on market $239,900 Active 35 DOM
-
2026-06-09days on market $239,900 Active 34 DOM
-
2026-06-08days on market $239,900 Active 33 DOM
-
2026-06-07days on market $239,900 Active 32 DOM
-
2026-06-05days on market $239,900 Active 29 DOM
-
2026-06-03days on market $239,900 Active 28 DOM
-
2026-06-03pricedays on market $239,900 Active 27 DOM
-
2026-06-01days on market $245,000 Active 26 DOM
-
2026-05-31days on market $245,000 Active 25 DOM
-
2026-05-06$245,000 Active 1363-char remark
-
2015-04-03soldstatus $105,000 234-char remark
Show marketing remark (234 chars)
Main level, shows well, storage under building. Walking Distance to the lake. Easy Access to 84 and shopping. See attachment for PAS requirements and WFHM offer submittal information in MLS document section. Common Charges are $253.60
-
2015-02-23historical 234-char remark
Show marketing remark (234 chars)
Main level, shows well, storage under building. Walking Distance to the lake. Easy Access to 84 and shopping. See attachment for PAS requirements and WFHM offer submittal information in MLS document section. Common Charges are $253.60
-
2014-10-22$95,000 234-char remark
Show marketing remark (234 chars)
Main level, shows well, storage under building. Walking Distance to the lake. Easy Access to 84 and shopping. See attachment for PAS requirements and WFHM offer submittal information in MLS document section. Common Charges are $253.60
-
1989-04-06soldstatus $99,000
ⓘ Source: listings_history table (triggers on properties + properties_extension) + one-shot
backfill from property_details.listing_events for pre-trigger history.
Tax reassessment forecast CT · Partial reset (capped growth)
- Current annual tax
- $2,616 · $218/mo
- Projected year-2 tax
- $3,875 · $323/mo
- Expected delta
- +$1,259/yr (+$105/mo · 48.1%)
ⓘ Screening estimate from a state-policy table — verify with the county assessor before closing.
Climate risk First Street
- Flood 1/10 Low FEMA zone X (unshaded) · 0% chance over 30 yrs
- Wildfire 1/10 Low
- Heat 4/10 Moderate 7 d/yr ≥99°F today · 14 d/yr by 30 yrs out
- Wind 5/10 Major 26% chance of damaging wind over 30 yrs
- Air quality 3/10 Moderate 3 unhealthy d/yr today · 4 by 30 yrs out
Nearby sold comps map
Loading sold comps map…
Walkable amenities ~0.75 mi
Loading nearby amenities…
Taxation est. · year 1
- Rental income
- $26,019
- − Mortgage interest
- −$13,438
- − Property taxes
- −$2,616
- − Insurance
- −$1,200
- − Repairs & maintenance
- −$2,082
- − Management
- −$2,082
- − HOA
- −$3,660
- − Depreciation
- −$6,979
- Taxable loss
- −$6,036
- Est. tax savings @ 24.0%
- +$1,449
- After-tax cash flow
- $-568/yr
For passive investors: Depreciation is non-cash, so a rental often shows a tax loss while cash-flowing — sheltering income. Rental losses are passive: they offset passive income freely, and up to $25,000/yr can offset ordinary (W-2) income if you actively participate and your MAGI is under $100k (phasing out to $0 by $150k); unused losses carry forward. On sale, claimed depreciation is recaptured at up to 25%, and gains may owe capital-gains tax (a 1031 exchange can defer both). Figures are a year-1 estimate at your 24.0% rate — not tax advice; consult a CPA.
Schools (NCES district)
- District
- Danbury School District
- NCES district ID
- 0901020
- Math proficiency
- 19% ▼ -17.00%
- Reading proficiency
- 32% ▼ -16.00%
- Median HH income
- $65,793
- Composite
- 23.93/100
- National rank
- #7784
- State rank
- #131 of 153 in CT
Livability — Danbury
- Score
- 76/100
- State rank
- #51
- US rank
- #3379
Category grades
Schools grade is shown separately in the Schools card above.
Census & demographics
- Census place
- Danbury, CT
- County
- Fairfield County · 765,532 people
- City population
- 87,061
- Metro
- Bridgeport-Stamford-Norwalk, CT
- Population (ZIP)
- 31,228
- Household income
- $104,640
- Rent vs Own
- Severe rent burden
- 551.0
Population outlook (Western Connecticut County) Hauer SSP2
- By 2040
- 685,031
Race, ethnicity, and origin ACS 2023
- Neighborhood character
- Diverse neighborhood (Simpson 0.59)
- Race & ethnicity
- White 60% Hispanic / Latino 19% Two or more races 10% Black 10% Asian 5%
- Hispanic origin (detail)
- Mexican 2% Puerto Rican 3% Dominican 6%
- Common ancestry
- Russian 4% Romanian 3% Estonian 3%
- Foreign-born
- 23% · Canada, Guatemala, China
- Languages at home
- 67% English-only · Spanish 16% Other Indo-European 8% Russian/Polish/Slavic 2%
Political lean MEDSL · Western Connecticut
- 2024 margin
- D (+19.1) · D 58.8% · R 39.7% · Other 1.6%
- All cycles
- 2024: D+19.1
Not yet ingested
- Civics
- —
Market trends
- HPI YoY
- ▼ -361.68%
- Current HPI
- 258.6639
- Rent YoY
- —
- Metro
- Bridgeport-Stamford-Norwalk, CT
- State GDP YoY
- ▲ 1.06%
- F500 in state
- 38
Industry mix (Fortune 500 HQ in CT)
| Industry | F500 HQs | Revenue |
|---|---|---|
| Industrial Machinery | 4 | $38B |
|
||
| Insurance | 3 | $71B |
|
||
| Financial Services | 2 | $25B |
|
||
| Transportation / Logistics | 2 | $18B |
|
||
| Healthcare | 1 | $247B |
|
||
| Telecommunications | 1 | $55B |
|
||
Price history
+142.3% since first listed6 events — show timeline
- 2026-06-02 Price Changed $239,900 Smart MLS
- 2026-05-06 Listed $245,000 Smart MLS
- 2015-04-03 Sold (MLS) $105,000 Smart MLS
- 2015-02-23 Listing Removed — Smart MLS
- 2014-10-22 Listed $95,000 Smart MLS
- 1989-04-06 Sold (Public Records) $99,000 Public Records
Property tax history
+2.8%/yrLatest (2023): $2,616 · +25.6% YoY. Source: county tax records.
Cash-flow waterfall
monthlySold comps — $/sqft
last 12 mo · ≤1 miLoading sold comps…