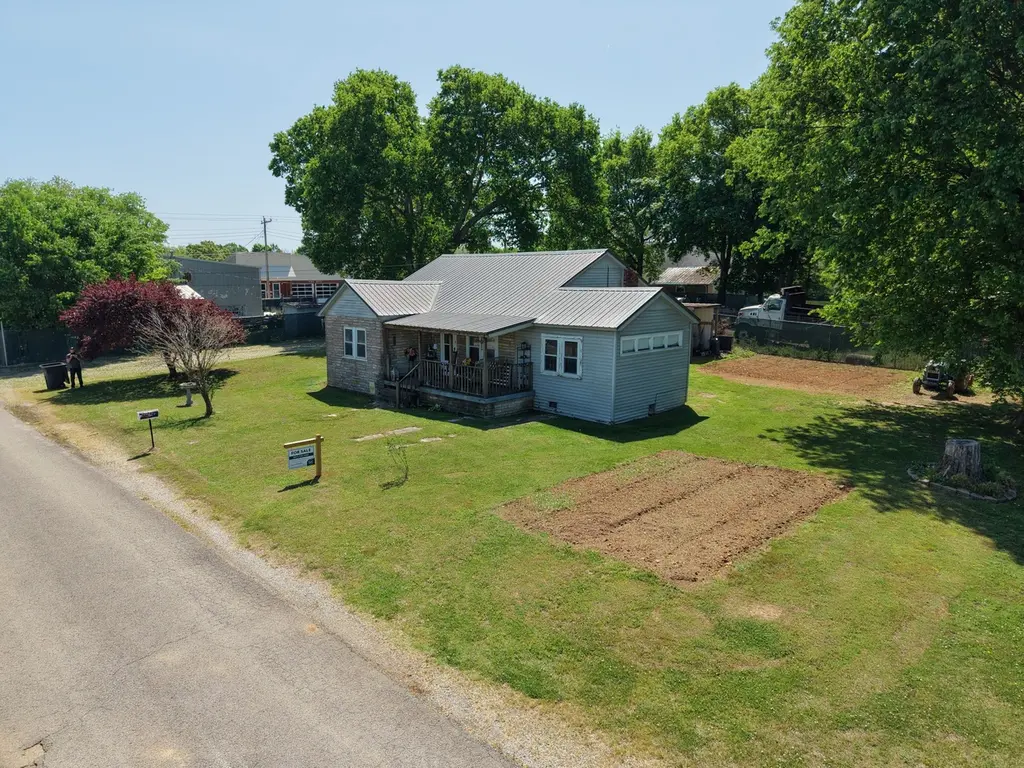
404 Mcmurtrey St · St. Joseph, TN
Flood risk 1/10 · Minimal
- FEMA flood zone
- X (unshaded)
- Chance of flooding over 30 yrs
- 0.0%
- Est. flood insurance / yr
- $507 – $1,088
Fire risk 4/10 · Minor
- Est. fire insurance / yr
- $949 – $1,763
Heat risk 5/10 · Moderate
- Hot days now (above 105°F)
- 7 days/yr
- Hot days in 30 yrs
- 19 days/yr
Wind risk 4/10 · Minor
- Chance of severe wind over 30 yrs
- 21.0%
Air-quality risk 2/10 · Minimal
- Unhealthy air days now
- 1 days/yr
- Unhealthy air days in 30 yrs
- 1 days/yr
Risk factors via First Street. Map © Google.
Why this score? — see what drove the C- grade
The composite is a weighted blend of 9 inputs, each scored 0–100. Each bar is that input's sub-score; the figure is the points it added to the 100-point composite (weight × sub-score).
- Cash flow +19.5/30.0
- ARV discount +7.5/15.0
- DSCR +6.2/10.0
- Appreciation +5.9/10.0
- 1% rule +4.2/10.0
- Rent growth +2.5/5.0
- Livability +2.5/5.0
- Condition / age +2.5/5.0
- Schools +2.4/10.0
$110,000
🖨 Deal sheet (PDF) 📄 Offer letter ✓ Due diligence
Listing remarks
This home is located in the heart of this small town in St Joseph, TN. Sold as-is but PRICED TO SELL!! It's a move in ready situation, perfect for a starter or downsize. It's comfortable, easy to maintain and on public utilities.
Key facts
- 0.3 acre lot
- Parking
- Built 1953
Tags
Property features AI
Finance
- Other: Lot approximately 0.3 acre (150 x 86); Porch is covered
Exterior
- Parking: Attached parking; One covered parking space; One-car carport
- Security: Smoke detector(s)
- Utilities: Public water; Septic tank sewer; Electricity available; Water available
- Home design: Single-family residence; One story
- Construction: Metal roof; Block foundation; Other construction materials
- Exterior features: Covered porch; Fenced backyard; Storage structure on property
Interior
- Kitchen: Electric oven and electric range; Dishwasher; Refrigerator
- Bedrooms: Three bedrooms, all on the main level
- Flooring: Concrete flooring; Laminate flooring; Tile flooring; Vinyl flooring
- Bathrooms: One full bathroom; Master bathroom with double vanity
- Heating & cooling: Electric heating; Wall/window air conditioning units
- Interior features: Electric oven and electric range; Dishwasher; Refrigerator; Concrete, laminate, tile and vinyl flooring; Double vanity in master bathroom; No basement
- Laundry & utility: Utilities: electricity and water available
Neighborhood map
What this means for you Summary
Snapshot
- This is a 3-bed/1.0-bath single-family listed at $110k.
Deal economics
- At list price, monthly cash flow is $124 ($1k/yr) — positive.
- The deal already cash-flows at list — no discount required.
- To meet the 1% rule (rent ≥ 1% of price), the offer needs to be $101k (8.2% below list).
- Recommended offer: $101k (8.2% below list) — sets the bar for 1% rule.
Location & tenants
- Location reads: area grade C — affects rentability + tenant quality, not the cash-flow math above.
- Lawrence County (rural): math 29% / reading 29% proficiency, ranked #67 of 139 in TN (top 48%) — low school quality limits family demand, transient renter base, plan for 1-2y turnover.
- Zoned schools: South Lawrence Elementary (math 34% / reading 30%, grade F, #369 of 952 statewide, top 42%, 540 students, 0% FRL); E O Coffman Middle School (math 23% / reading 26%, grade F, #154 of 333 statewide, top 48%, 582 students, 0% FRL); Loretto High School (math 8% / reading 32%, grade F, #183 of 332 statewide, top 59%, 493 students, 0% FRL) — zoned schools average 0% FRL vs 50% district-wide (50 pts lower); this property's tenant base skews higher-income than the district average.
- Market conditions: 3 active listings in the ZIP; 27 units permitted in Lawrence County in 2024 (0 in 5+ unit buildings).
Forward outlook
- In year one you build about $3k of equity ($761 loan paydown + $2k appreciation (1.9% local appreciation)).
- Lawrence County population projected to shrink 4% by 2050 — rents likely to lag national; underwrite the cash flow, not the appreciation.
- At projected returns (1.9% appreciation + 3.0% rent growth), your $31k cash investment doubles in ~6 years — after that, you're playing with house money.
Negotiation context
- It's been on market 64 days — a 6% lower offer ($103k) is reasonable based on typical stale-listing flexibility.
- 2 sale attempts; this cycle's ask has dropped $30k (21%) from the opening price — seller is motivated, your offer sets the floor, not the list.
- Current owner paid $36k; list at $110k implies a 201% gain — meaningful room to come down on a strong offer.
Risks & watch-outs
- Watch-outs: built in 1953 — expect roof / HVAC / electrical / plumbing capex.
- Climate carrying-cost: extreme-heat days projected 7→19/yr by 2055 (HVAC capex compounding) — expect insurance premiums to compound above CPI over the hold.
Questions for the listing agent
- It's been on market 64 days. Have you received any prior offers? Is the seller open to a 8% concession, seller financing, or rate buy-down credit?
- Built in 1953 — when were the roof, HVAC, electrical panel, plumbing, and water heater last replaced?
- Why hasn't it sold? Are there any deal-killer items the seller is aware of (foundation, flood, title, zoning, code violations)?
- Is there a deadline driving the sale (1031 exchange, divorce, estate, relocation)? That informs how much negotiation room exists.
- What's the average days-on-market for RENTAL listings here right now (not sales)? A rising rental-DOM trend means longer vacancies and softer asking-rent achievability than the comps imply.
- What's the recent tenant-quality profile in this submarket — average credit score on applications, eviction rate, late-payment / NSF rate, and stable-employment percentage? A property-management company in the area should have these aggregated.
- How much new for-sale + rental construction is in the pipeline within 1–3 miles? Heavy new supply typically softens prices + rents 12–24 months out; constrained supply supports both.
Investment metrics
- 1% rule
- 0.92% ✗
- Cap rate
- 7.65%
- Cash-on-cash
- 4.84%
- DSCR
- 1.22
- GRM
- 9.1
CMA / ARV
No comps found within radius.
Projected returns pro-forma
1.86% appreciation · 3.0% rent growth · sell at horizon
- IRR
- 8.9%
- Equity multiple
- 1.48×
- Total profit
- $14,645
- Equity at exit
- $42,571
- IRR
- 12.1%
- Equity multiple
- 2.61×
- Total profit
- $49,462
- Equity at exit
- $60,682
Cash invested: $30,800 (down + closing). Projections, not guarantees.
Landlord ↔ Tenant lean methodology
- Overall (STATE)
- 87 Strongly Landlord-Friendly
- State Tennessee
- 87 Strongly Landlord-Friendly · R+13
- County
- — inherits STATE
- City
- — inherits STATE
ZIP-level market 38481
- Home prices YoY
- 1.9%
- Active inventory
- 3
- Price-to-rent
- 9.1×
Monthly cashflow live
- Estimated rent
- $1,010 medium interval (Pro) →
- Mortgage (P&I)
- −$577
- Tax from tax record
- −$51 /mo · $613/yr
- Insurance
- −$46
- HOA
- −$0
- Vacancy / Maint / Mgmt
- −$212
- Net cashflow
- $124
Break-even live
Sensitivity live
| Price | -10% $186 | -5% $155 | +0% $124 | +5% $93 | +10% $62 |
|---|---|---|---|---|---|
| Rent | -10% $44 | -5% $84 | +0% $124 | +5% $164 | +10% $204 |
| Rate | -1.0pp $180 | -0.5pp $152 | base $124 | +0.5pp $96 | +1.0pp $67 |
UW: 25.0% down · 7.5% · 30yr · 1.5% tax · 5.0% vac · 8.0% maint · 8.0% mgmt
Financing live
Cash to close
- Down payment
- $27,500
- Closing costs
- $3,300
- Reserves months
- —
- Total cash needed
- —
Loan-product check · same deal, 3 products live
Conventional
25% down · 7.5% · 30yr
- Down + closing
- —
- Monthly P&I
- —
- Monthly cashflow
- —
- DSCR
- —
- Eligible?
- —
Personal DTI + credit; lowest rate.
DSCR
20% down · 8.5% · 30yr
- Down + closing
- —
- Monthly P&I
- —
- Monthly cashflow
- —
- DSCR
- —
- Eligible?
- —
No personal income docs; deal must DSCR.
Hard money
10% down · 12.0% · 12mo
- Down + closing
- —
- Monthly P&I
- —
- Monthly cashflow
- —
- DSCR
- —
- Eligible?
- —
Short-term bridge; refi at stabilization.
Listing history 12 events
-
2026-06-04status $110,000 Pending 64 DOM
-
2026-06-03days on market $110,000 Active 64 DOM
-
2026-06-02days on market $110,000 Active 63 DOM
-
2026-06-01days on market $110,000 Active 62 DOM
-
2026-05-31days on market $110,000 Active 61 DOM
-
2026-04-30price $110,000
-
2026-04-10status Active
-
2026-04-03historical Active Under Contract
-
2026-03-31$139,900 Active
-
2004-08-25soldstatus $36,500
-
1999-08-25soldstatus $27,500
-
1998-08-06soldstatus $22,000
ⓘ Source: listings_history table (triggers on properties + properties_extension) + one-shot
backfill from property_details.listing_events for pre-trigger history.
Tax reassessment forecast TN · Resets to sale price
- Current annual tax
- $613 · $51/mo
- Projected year-2 tax
- $781 · $65/mo
- Expected delta
- +$168/yr (+$14/mo · 27.4%)
ⓘ Screening estimate from a state-policy table — verify with the county assessor before closing.
Climate risk First Street
- Flood 1/10 Low FEMA zone X (unshaded) · 0% chance over 30 yrs
- Wildfire 4/10 Moderate
- Heat 5/10 Major 7 d/yr ≥105°F today · 19 d/yr by 30 yrs out
- Wind 4/10 Moderate 21% chance of damaging wind over 30 yrs
- Air quality 2/10 Low 1 unhealthy d/yr today · 1 by 30 yrs out
Nearby sold comps map
Loading sold comps map…
Walkable amenities ~0.75 mi
Loading nearby amenities…
Taxation est. · year 1
- Rental income
- $12,121
- − Mortgage interest
- −$6,162
- − Property taxes
- −$613
- − Insurance
- −$550
- − Repairs & maintenance
- −$970
- − Management
- −$970
- − Depreciation
- −$3,200
- Taxable loss
- −$343
- Est. tax savings @ 24.0%
- +$82
- After-tax cash flow
- $1,572/yr
For passive investors: Depreciation is non-cash, so a rental often shows a tax loss while cash-flowing — sheltering income. Rental losses are passive: they offset passive income freely, and up to $25,000/yr can offset ordinary (W-2) income if you actively participate and your MAGI is under $100k (phasing out to $0 by $150k); unused losses carry forward. On sale, claimed depreciation is recaptured at up to 25%, and gains may owe capital-gains tax (a 1031 exchange can defer both). Figures are a year-1 estimate at your 24.0% rate — not tax advice; consult a CPA.
Schools (NCES district)
- District
- Lawrence County
- NCES district ID
- 4702340
- Math proficiency
- 29% ▼ -11.00%
- Reading proficiency
- 29% ▼ -8.00%
- Median HH income
- $37,613
- Composite
- 24.2/100
- National rank
- #7729
- State rank
- #67 of 139 in TN
Livability — St. Joseph
No livability data for this city. (Only ~50 U.S. cities are tracked.)
Census & demographics
- Census place
- St. Joseph, TN
- Population (ZIP)
- 876
Population outlook (Lawrence County) Hauer SSP2
- Today (2025)
- 42,724 people
- By 2030
- 42,627 · -0.2%
- By 2040
- 42,144 · -1.4%
- By 2050
- 40,800 · -4.5%
- By 2075
- 36,643 · -14.2%
- By 2100
- 29,193 · -31.7%
Race, ethnicity, and origin ACS 2023
- Neighborhood character
- Predominantly White (94%)
- Race & ethnicity
- White 94% Black 3% Two or more races 2%
- Common ancestry
- Lithuanian 2% Iranian 1% Italian 1%
- Foreign-born
- 1% · Canada
- Languages at home
- 98% English-only · Spanish 2%
Political lean MEDSL · Lawrence
- 2024 margin
- Solid R (+69.1) · D 15.1% · R 84.1%
- 2008→2024 swing
- -35.3pp toward R · 2008: -33.7pp · 2024: -69.1pp
- All cycles
- 2024: R+69.1 2020: R+64.8 2016: R+61.3 2012: R+42.9 2008: R+33.7
Not yet ingested
- Civics
- —
Market trends
- HPI YoY
- ▲ 1.86%
- Current HPI
- 100.4527
- Rent YoY
- —
- Metro
- —
- State GDP YoY
- ▲ 2.78%
- F500 in state
- 22
Industry mix (Fortune 500 HQ in TN)
| Industry | F500 HQs | Revenue |
|---|---|---|
| Healthcare | 3 | $91B |
|
||
| Retail | 3 | $72B |
|
||
| Transportation / Logistics | 1 | $88B |
|
||
| Paper / Packaging | 1 | $19B |
|
||
| Insurance | 1 | $13B |
|
||
| Energy | 1 | $12B |
|
||
Price history
+400.0% since first listed7 events — show timeline
- 2026-04-30 Price Changed $110,000 REALTRACS as Distributed by MLS Grid
- 2026-04-10 Relisted — REALTRACS as Distributed by MLS Grid
- 2026-04-03 Contingent — REALTRACS as Distributed by MLS Grid
- 2026-03-31 Listed $139,900 REALTRACS as Distributed by MLS Grid
- 2004-08-25 Sold (Public Records) $36,500 Public Records
- 1999-08-25 Sold (Public Records) $27,500 Public Records
- 1998-08-06 Sold (Public Records) $22,000 Public Records
Property tax history
+5.6%/yrLatest (2025): $613 · +3.9% YoY. Source: county tax records.
Cash-flow waterfall
monthlySold comps — $/sqft
last 12 mo · ≤1 miLoading sold comps…