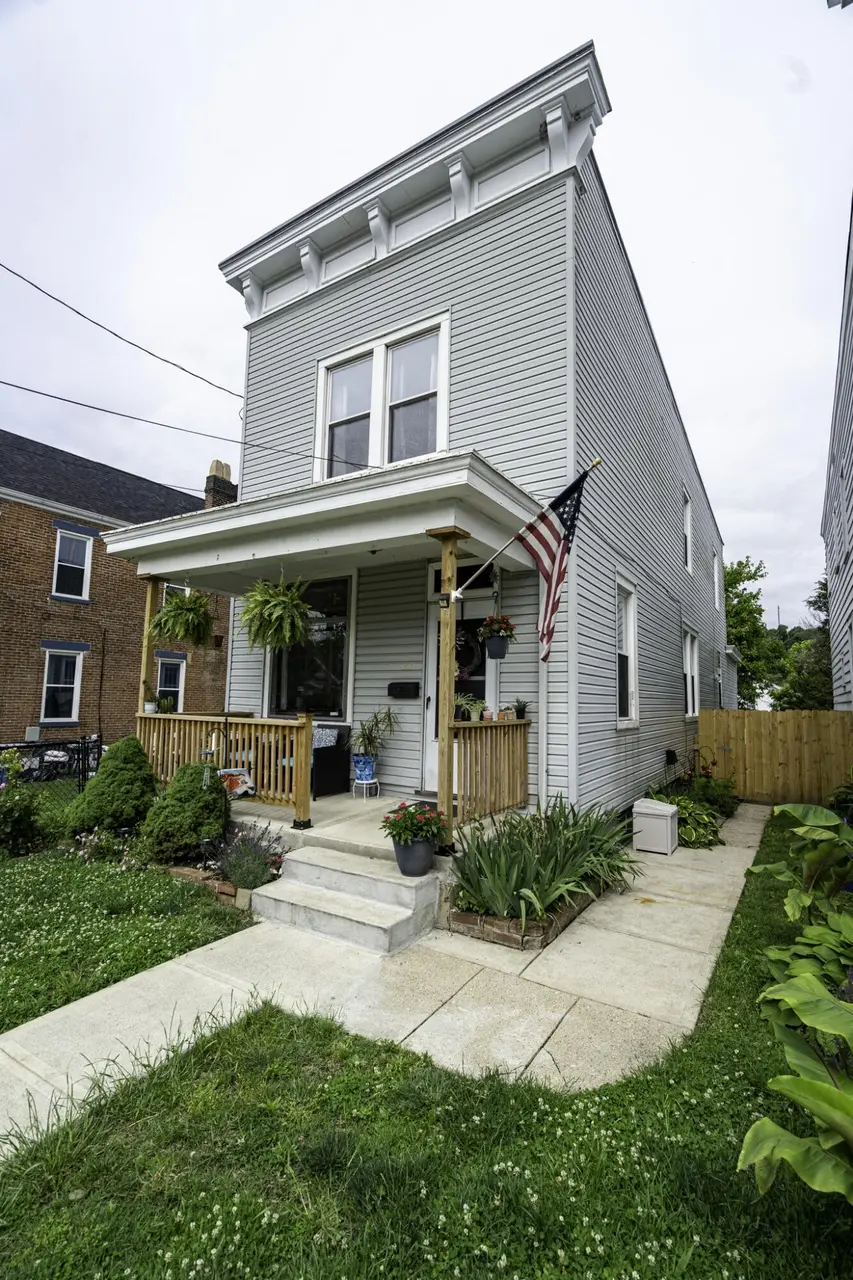
836 Oak St · Ludlow, KY
Flood risk 8/10 · Major
- FEMA flood zone
- X (shaded)
- Chance of flooding over 30 yrs
- 0.91%
- Est. flood insurance / yr
- $507 – $1,088
Fire risk 1/10 · Minimal
- Est. fire insurance / yr
- $839 – $1,559
Heat risk 5/10 · Moderate
- Hot days now (above 103°F)
- 7 days/yr
- Hot days in 30 yrs
- 20 days/yr
Wind risk 2/10 · Minimal
- Chance of severe wind over 30 yrs
- 1.0%
Air-quality risk 3/10 · Minor
- Unhealthy air days now
- 3 days/yr
- Unhealthy air days in 30 yrs
- 5 days/yr
Risk factors via First Street. Map © Google.
Why this score? — see what drove the B- grade
The composite is a weighted blend of 9 inputs, each scored 0–100. Each bar is that input's sub-score; the figure is the points it added to the 100-point composite (weight × sub-score).
- Cash flow +25.5/30.0
- ARV discount +15.0/15.0
- DSCR +8.4/10.0
- 1% rule +6.2/10.0
- Livability +4.4/5.0
- Rent growth +2.5/5.0
- Schools +2.5/10.0
- Condition / age +2.5/5.0
- Appreciation +0.0/10.0
$189,900
🖨 Deal sheet 📄 Offer letter ✓ Due diligence
Listing remarks MLS
Beautifully finished home with 3 bedrooms, large kitchen, dining room, 2 full baths and a room on the 2nd floor that could be a family room or used as a 4th bedroom.
Key facts
- Large kitchen
- Italianate style
- Solid wood doors
Tags
Property features AI
Exterior
- Parking: On-street parking
- Utilities: Public water; Public sewer
- Home design: Single family house; Two levels; Built in 1912; Metal roof; Stone foundation
- Construction: Vinyl siding
- Exterior features: Covered patio; Privacy fencing; Vinyl window frames; City street frontage
Interior
- Kitchen: Electric oven; Electric range; Dishwasher; Microwave; Refrigerator
- Bedrooms: Primary bedroom (15 x 15); Bedroom 2 (15 x 15); Bedroom 3 (14 x 10); Bedroom 4 (12 x 9)
- Bathrooms: 2 full bathrooms
- Heating & cooling: Central air conditioning; Forced air heating
- Interior features: Pocket doors; Eat-in kitchen; Chandelier; Natural woodwork; Inoperable fireplace
- Laundry & utility: Laundry in basement
Neighborhood map
What this means for you Summary
Snapshot
- This is a 4-bed/2.0-bath single-family listed at $190k.
Deal economics
- At list price, monthly cash flow is $376 ($5k/yr) — positive.
- The deal already cash-flows at list — no discount required.
- Meets the 1% rule at list price ($2k rent vs $190k).
- Cap rate 9.1% vs local median 2.8% in Ludlow — top-decile yield for the area; either an underpriced asset or a hidden risk that comps aren't pricing in. Stress-test before assuming the spread holds.
Location & tenants
- Location reads 87/100 on livability (#36 in KY, #326 nationally) — a professional / high-income tenant draw. Strengths: crime A+, commute A+, cost of living A+.
- Ludlow Independent (suburban): math 26% / reading 33% proficiency, ranked #105 of 165 in KY (top 64%) — low school quality limits family demand, transient renter base, plan for 1-2y turnover.
- Zoned schools: Mary A. Goetz Elementary School (math 26% / reading 32%, grade F, #424 of 676 statewide, top 63%, 464 students, 65% FRL); Ludlow High School (math 27% / reading 37%, grade F, #97 of 254 statewide, top 46%, 364 students, 64% FRL).
- Market conditions: 92 active listings in the ZIP; 3 comparable units currently listed for rent nearby; rentals at typical pace (median 21d on market — plan ~3-4 weeks tenant-placement turnaround); 699 units permitted in Kenton County in 2024 (287 in 5+ unit buildings).
- This rent runs 36% of the median local income ($71k/yr) — at the standard rent-burdened threshold; future hikes will face affordability resistance.
Forward outlook
- Local home prices are declining (-3.0%/yr); year-one equity from $1k of loan paydown is wiped out by about $6k of value loss. Plan a longer hold.
- Kenton County population projected at +5% by 2050 — modest demand growth; plan on rents tracking national, not racing it.
Negotiation context
- Only 4 days on market — expect competitive offers; lowballing is unlikely to land.
- 4 sale attempts since 19y ago with the ask held roughly flat each time — persistent listings suggest the price (not the market) is what's stuck; bring a comps-based counter.
- Current owner paid $100k; list at $190k implies a 90% gain — meaningful room to come down on a strong offer.
Risks & watch-outs
- Watch-outs: flood insurance adds $66/mo; built in 1912 — expect roof / HVAC / electrical / plumbing capex.
- Climate carrying-cost: severe flood risk; extreme-heat days projected 7→20/yr by 2055 (HVAC capex compounding) — expect insurance premiums to compound above CPI over the hold.
Questions for the listing agent
- Built in 1912 — when were the roof, HVAC, electrical panel, plumbing, and water heater last replaced?
- What's the actual annual flood-insurance premium (NFIP or private), and is the property in a SFHA with mandatory coverage?
- Is there a deadline driving the sale (1031 exchange, divorce, estate, relocation)? That informs how much negotiation room exists.
- What's the average days-on-market for RENTAL listings here right now (not sales)? A rising rental-DOM trend means longer vacancies and softer asking-rent achievability than the comps imply.
- What's the recent tenant-quality profile in this submarket — average credit score on applications, eviction rate, late-payment / NSF rate, and stable-employment percentage? A property-management company in the area should have these aggregated.
- How much new for-sale + rental construction is in the pipeline within 1–3 miles? Heavy new supply typically softens prices + rents 12–24 months out; constrained supply supports both.
Investment metrics
- 1% rule
- 1.12% ✓
- Cap rate
- 9.09%
- Cash-on-cash
- 9.99%
- DSCR
- 1.44
- GRM
- 7.5
CMA / ARV
- ARV (on-the-fly)
- $321,824
- Comps found
- 12
Show comp detail 12 sales within ~0.75 mi
| Address | Dist | Beds/Ba | Sqft | Sold | Price | $/sf | Match |
|---|---|---|---|---|---|---|---|
| 607 Elm St | 0.29mi | 3/2.0 (-1) | 1,808 (0%) | 3mo | $331,000 | $183 | 79 |
| 442 Oak St | 0.49mi | 4/2.0 | 1,836 (+2%) | 3mo | $305,100 | $166 | 72 |
| 210 Pleasant St | 0.22mi | 4/1.5 | 1,696 (-6%) | 9mo | $210,000 | $124 | 70 |
| 231 Shelby St | 0.42mi | 3/1.5 (-1) | 1,864 (+3%) | 1mo | $170,000 | $91 | 67 |
| 476 Elm St | 0.46mi | 3/2.5 (-1) | 1,764 (-2%) | 1mo | $336,000 | $190 | 67 |
| 438 Linden St | 0.47mi | 3/2.5 (-1) | 1,824 (+1%) | 5mo | $325,000 | $178 | 65 |
| 638 Delhi Ave | 0.66mi | 4/2.5 | 1,862 (+3%) | 1mo | $41,500 | $22 | 61 |
| 306 Stokesay St | 0.25mi | 3/2.0 (-1) | 1,638 (-9%) | 8mo | $313,500 | $191 | 61 |
| 415 Oak St | 0.53mi | 4/2.0 | 1,728 (-4%) | 10mo | $280,000 | $162 | 60 |
| 545 Elm St | 0.32mi | 3/1.5 (-1) | 1,596 (-12%) | 2mo | $332,000 | $208 | 57 |
| 26 Butler St | 0.70mi | 3/2.5 (-1) | 1,858 (+3%) | 6mo | $338,000 | $182 | 50 |
| 657 Sedam St | 0.75mi | 3/2.0 (-1) | 1,624 (-10%) | 11mo | $37,500 | $23 | 34 |
Match score weights: distance 35% · size 25% · config 20% · recency 20%. Top-matched comps best support the ARV.
Projected returns pro-forma
-3.0% appreciation · 3.0% rent growth · sell at horizon
- IRR
- -3.4%
- Equity multiple
- 0.87×
- Total profit
- $-6,777
- Equity at exit
- $28,315
- IRR
- 6.3%
- Equity multiple
- 1.47×
- Total profit
- $25,058
- Equity at exit
- $16,419
Cash invested: $53,172 (down + closing). Projections, not guarantees.
Landlord ↔ Tenant lean methodology
- Overall (STATE)
- 83 Strongly Landlord-Friendly
- State Kentucky
- 83 Strongly Landlord-Friendly · R+16
- County
- — inherits STATE
- City
- — inherits STATE
ZIP-level market 41016
- Active inventory
- 92
- Price-to-rent
- 7.5×
Monthly cashflow live
- Estimated rent
- $2,118 medium interval (Pro) →
- Mortgage (P&I)
- −$996
- Tax from tax record
- −$155 /mo · $1,862/yr
- Insurance
- −$79
- Flood insurance flood zone
- −$66 /mo · $798/yr
- HOA
- −$0
- Vacancy / Maint / Mgmt
- −$445
- Net cashflow
- $376
Break-even live
UW: 25.0% down · 7.5% · 30yr · 1.5% tax · 5.0% vac · 8.0% maint · 8.0% mgmt
Financing live
Cash to close
- Down payment
- $47,475
- Closing costs
- $5,697
- Reserves months
- —
- Total cash needed
- —
Loan-product check · same deal, 3 products live
Conventional
25% down · 7.5% · 30yr
- Down + closing
- —
- Monthly P&I
- —
- Monthly cashflow
- —
- DSCR
- —
- Eligible?
- —
Personal DTI + credit; lowest rate.
DSCR
20% down · 8.5% · 30yr
- Down + closing
- —
- Monthly P&I
- —
- Monthly cashflow
- —
- DSCR
- —
- Eligible?
- —
No personal income docs; deal must DSCR.
Hard money
10% down · 12.0% · 12mo
- Down + closing
- —
- Monthly P&I
- —
- Monthly cashflow
- —
- DSCR
- —
- Eligible?
- —
Short-term bridge; refi at stabilization.
Rent comps 3 comps
| Address | Beds | Baths | Sqft | Rent | $/sqft | DOM | Units | Dist |
|---|---|---|---|---|---|---|---|---|
| 2454 River Rd Unit 2 Cincinnati, OH | 4.0 | 1.0 | 1400 | $1,595 | $1.14 | 23d | 1 | 0.77mi |
| 22 Swain Ct Covington, KY | 1.0–3.0 | 1.0–2.0 | 951 | $2,295 | $2.41 | 1d | 3 | 1.38mi |
| 927 Chateau Ave Cincinnati, OH | 3.0 | 1.0 | 1354 | $1,550 | $1.14 | 21d | 1 | 1.45mi |
Listing history 9 events
-
2026-05-22$189,900 Active
-
2016-05-03soldstatus $100,000
-
2016-04-29soldstatus $100,000 165-char remark
Show marketing remark (165 chars)
Beautifully finished home with 3 bedrooms, large kitchen, dining room, 2 full baths and a room on the 2nd floor that could be a family room or used as a 4th bedroom.
-
2015-07-09$106,900 165-char remark
Show marketing remark (165 chars)
Beautifully finished home with 3 bedrooms, large kitchen, dining room, 2 full baths and a room on the 2nd floor that could be a family room or used as a 4th bedroom.
-
2012-04-30soldstatus $29,000 96-char remark
Show marketing remark (96 chars)
This is a Fannie Mae Homepath Property. Two story, 3 Bedroom, front porch, needs TLC. Sold AS-IS
-
2012-03-09$40,000 96-char remark
Show marketing remark (96 chars)
This is a Fannie Mae Homepath Property. Two story, 3 Bedroom, front porch, needs TLC. Sold AS-IS
-
2007-06-01soldstatus $113,500
-
2007-05-31soldstatus $113,500
-
2007-03-12$114,900
ⓘ Source: listings_history table (triggers on properties + properties_extension) + one-shot
backfill from property_details.listing_events for pre-trigger history.
Tax reassessment forecast KY · Resets to sale price
- Current annual tax
- $1,862 · $155/mo
- Projected year-2 tax
- $1,862 · $155/mo
- Expected delta
- $0/yr ($0/mo · 0.0%)
ⓘ Screening estimate from a state-policy table — verify with the county assessor before closing.
Climate risk First Street
- Flood 8/10 Severe FEMA zone X (shaded) · 91% chance over 30 yrs
- Wildfire 1/10 Low
- Heat 5/10 Major 7 d/yr ≥103°F today · 20 d/yr by 30 yrs out
- Wind 2/10 Low 100% chance of damaging wind over 30 yrs
- Air quality 3/10 Moderate 3 unhealthy d/yr today · 5 by 30 yrs out
Nearby sold comps map
Loading sold comps map…
Walkable amenities ~0.75 mi
Loading nearby amenities…
Taxation est. · year 1
- Rental income
- $25,412
- − Mortgage interest
- −$10,637
- − Property taxes
- −$1,862
- − Insurance
- −$1,747
- − Repairs & maintenance
- −$2,033
- − Management
- −$2,033
- − Depreciation
- −$5,524
- Taxable income
- $1,576
- Est. tax owed @ 24.0%
- −$378
- After-tax cash flow
- $4,138/yr
For passive investors: Depreciation is non-cash, so a rental often shows a tax loss while cash-flowing — sheltering income. Rental losses are passive: they offset passive income freely, and up to $25,000/yr can offset ordinary (W-2) income if you actively participate and your MAGI is under $100k (phasing out to $0 by $150k); unused losses carry forward. On sale, claimed depreciation is recaptured at up to 25%, and gains may owe capital-gains tax (a 1031 exchange can defer both). Figures are a year-1 estimate at your 24.0% rate — not tax advice; consult a CPA.
Schools (NCES district)
- District
- Ludlow Independent
- NCES district ID
- 2103630
- Math proficiency
- 26% ▼ -17.00%
- Reading proficiency
- 33% ▼ -26.00%
- Median HH income
- $44,821
- Composite
- 25.27/100
- National rank
- #7492
- State rank
- #105 of 165 in KY
Livability — Ludlow
- Score
- 87/100
- State rank
- #36
- US rank
- #326
Category grades
Schools grade is shown separately in the Schools card above.
Census & demographics
- Census place
- Ludlow, KY
- County
- Kenton County · 142,881 people
- City population
- 5,795
- Metro
- Cincinnati, OH-KY-IN
- Population (ZIP)
- 5,795
- Household income
- $71,172
- Rent vs Own
- Severe rent burden
- 95.0
Population outlook (Kenton County) Hauer SSP2
- Today (2025)
- 174,205 people
- By 2030
- 177,897 · +2.1%
- By 2040
- 182,671 · +4.9%
- By 2050
- 183,543 · +5.4%
- By 2075
- 178,977 · +2.7%
- By 2100
- 159,920 · -8.2%
Race, ethnicity, and origin ACS 2023
- Neighborhood character
- Predominantly White (79%)
- Race & ethnicity
- White 79% Two or more races 10% Hispanic / Latino 8% Black 2%
- Hispanic origin (detail)
- Mexican 5%
- Common ancestry
- Slovak 2% Romanian 1% Serbian 1%
- Foreign-born
- 1% · Canada
- Languages at home
- 95% English-only · Spanish 3% German/W. Germanic 1%
Political lean MEDSL · Kenton
- 2024 margin
- Strong R (+21.7) · D 38.2% · R 59.9% · Other 1.9%
- 2008→2024 swing
- -0.9pp no change · 2008: -20.9pp · 2024: -21.7pp
- All cycles
- 2024: R+21.7 2020: R+19.3 2016: R+26.1 2012: R+24.3 2008: R+20.9
Not yet ingested
- Civics
- —
Market trends
- HPI YoY
- ▼ -141.84%
- Current HPI
- 215.1436
- Rent YoY
- —
- Metro
- Cincinnati, OH-KY-IN
- State GDP YoY
- ▲ 1.81%
- F500 in state
- 4
Industry mix (Fortune 500 HQ in KY)
| Industry | F500 HQs | Revenue |
|---|---|---|
| Healthcare | 1 | $118B |
|
||
| Food / Beverage | 1 | $7B |
|
||
Price history
+65.3% since first listed9 events — show timeline
- 2026-05-22 Listed $189,900 NKMLS
- 2016-05-03 Sold (Public Records) $100,000 Public Records
- 2016-04-29 Sold (MLS) $100,000 NKMLS
- 2015-07-09 Listed $106,900 NKMLS
- 2012-04-30 Sold (MLS) $29,000 NKMLS
- 2012-03-09 Listed $40,000 NKMLS
- 2007-06-01 Sold (Public Records) $113,500 Public Records
- 2007-05-31 Sold (MLS) $113,500 NKMLS
- 2007-03-12 Listed $114,900 NKMLS
Property tax history
+14.5%/yrLatest (2025): $1,862 · +0.4% YoY. Source: county tax records.
Cash-flow waterfall
monthlySold comps — $/sqft
last 12 mo · ≤1 miLoading sold comps…