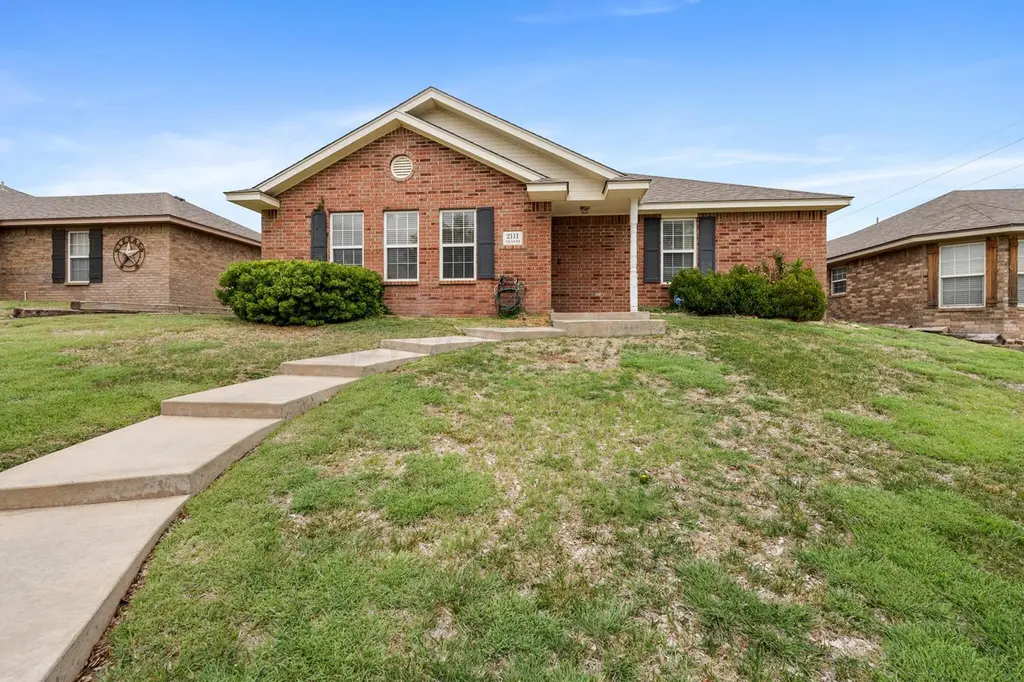
2111 Noah St · Amarillo, TX
Flood risk 1/10 · Minimal
- FEMA flood zone
- X (unshaded)
- Chance of flooding over 30 yrs
- 0.0%
- Est. flood insurance / yr
- $507 – $1,088
Fire risk 9/10 · Severe
- Est. fire insurance / yr
- $1,222 – $2,270
Heat risk 5/10 · Moderate
- Hot days now (above 97°F)
- 7 days/yr
- Hot days in 30 yrs
- 20 days/yr
Wind risk 2/10 · Minimal
- Chance of severe wind over 30 yrs
- —
Air-quality risk 2/10 · Minimal
- Unhealthy air days now
- 1 days/yr
- Unhealthy air days in 30 yrs
- 1 days/yr
Risk factors via First Street. Map © Google.
Why this score? — see what drove the D grade
The composite is a weighted blend of 9 inputs, each scored 0–100. Each bar is that input's sub-score; the figure is the points it added to the 100-point composite (weight × sub-score).
- Cash flow +13.3/30.0
- ARV discount +7.5/15.0
- 1% rule +4.1/10.0
- DSCR +4.0/10.0
- Rent growth +3.9/5.0
- Schools +3.6/10.0
- Livability +3.3/5.0
- Condition / age +2.5/5.0
- Appreciation +0.0/10.0
$189,400
🖨 Deal sheet (PDF) 📄 Offer letter ✓ Due diligence
Listing remarks
2 Bed | 2 Bath + 3rd Bedroom OR Office Space Some homes you tour. This one you * feel. * ! From the moment you walk through the door, this cute, cozy, cottage-style home wraps around you. Vaulted ceilings open the space up beautifully, the wood-burning fireplace draws you right in, and the open floor plan just makes sense. It's warm, it's bright, and it's the kind of space you'll want to come home to every single day. The isolated master bedroom gives you your own private escape, and both bedrooms come with their own bathroom. The third room is the perfect flex space. .. 3rd bedroom, home office, creative studio, guest room, gym. .. whatever chapter of life you're walking into, this
Key facts
- Open floor plan
- Flex space
- Covered patio
Tags
Property features AI
Finance
- Other: Zoning: SE Amarillo in city limits; Directions: South on Ross-Osage to 42nd, turn west to Willow, south to Noah, east to 2111
- HOA & community: No community features listed
Exterior
- Parking: Attached rear-facing garage; 2-car garage with garage door opener
- Utilities: Public water; Public sewer
- Home design: Single-family residence; One story; Residential property
- Construction: Slab foundation
- Exterior features: Wood fencing; No pool
Interior
- Kitchen: Disposal; Range; Dishwasher; Microwave
- Bathrooms: 2 full bathrooms
- Heating & cooling: Central heating; Central air; Ceiling fan(s)
- Interior features: Disposal; Range; Dishwasher; Microwave; Wood-burning fireplace in the living room
Neighborhood map
What this means for you Summary
Snapshot
- This is a 2-bed/2.0-bath single-family listed at $189k.
Deal economics
- At list price, monthly cash flow is $1 ($6/yr) — positive.
- The deal already cash-flows at list — no discount required.
- To meet the 1% rule (rent ≥ 1% of price), the offer needs to be $173k (8.6% below list).
- Recommended offer: $173k (8.6% below list) — sets the bar for 1% rule.
Location & tenants
- Location reads 66/100 on livability (#624 in TX) — a middle-class / working-renter tenant base. Strengths: cost of living A+, housing A+; Watch: amenities C-, crime F, commute F.
- Amarillo ISD (urban): math 44% / reading 41% proficiency, ranked #336 of 826 in TX (top 41%) — families likely to look elsewhere, expect single-tenant / working-renter base with shorter leases.
- Zoned schools: Tradewind El (math 47% / reading 44%, grade D-, #1,112 of 4,322 statewide, top 26%, 699 students, 80% FRL); Fannin Middle (math 36% / reading 30%, grade F, #930 of 1,662 statewide, top 57%, 657 students, 79% FRL); Amtech Career Academy (3 students, 0% FRL).
- Market conditions: Rents rising fast (+5.5%/yr); 278 active listings in the ZIP; 3 comparable units currently listed for rent nearby; rentals lingering (median 46d on market — plan ~5-8 weeks vacancy on turnover, expect pricing pressure); 67% of comp listings sitting > 30 days — soft ceiling on asking rent; solid renter incomes; 45 units permitted in Randall County in 2024 (0 in 5+ unit buildings).
Forward outlook
- Local home prices are declining (-3.0%/yr); year-one equity from $1k of loan paydown is wiped out by about $6k of value loss. Plan a longer hold.
- Randall County population projected at +36% by 2050 — long-run rental-demand tailwind backs the buy-and-hold thesis.
Negotiation context
- Only 13 days on market — expect competitive offers; lowballing is unlikely to land.
Risks & watch-outs
- Climate carrying-cost: severe wildfire risk; extreme-heat days projected 7→20/yr by 2055 (HVAC capex compounding) — expect insurance premiums to compound above CPI over the hold.
Questions for the listing agent
- Is there a deadline driving the sale (1031 exchange, divorce, estate, relocation)? That informs how much negotiation room exists.
- Schools are D-rated, which usually means shorter tenancies and higher turnover. Who's the typical renter profile here, and what's been the actual vacancy rate?
- Crime grade is F in this area — have there been break-ins, vandalism, or insurance claims at this property in the last 3 years? What carrier currently insures it and at what premium?
- The area grade is low — what's the realistic commute time and amenity access for the typical tenant pool here? Any planned neighborhood developments (good or bad) we should know about?
- What's the average days-on-market for RENTAL listings here right now (not sales)? A rising rental-DOM trend means longer vacancies and softer asking-rent achievability than the comps imply.
- What's the recent tenant-quality profile in this submarket — average credit score on applications, eviction rate, late-payment / NSF rate, and stable-employment percentage? A property-management company in the area should have these aggregated.
- How much new for-sale + rental construction is in the pipeline within 1–3 miles? Heavy new supply typically softens prices + rents 12–24 months out; constrained supply supports both.
Investment metrics
- 1% rule
- 0.91% ✗
- Cap rate
- 6.30%
- Cash-on-cash
- 0.01%
- DSCR
- 1.00
- GRM
- 9.1
CMA / ARV
No comps found within radius.
Projected returns pro-forma
-3.0% appreciation · 5.52% rent growth · sell at horizon
- IRR
- -13.3%
- Equity multiple
- 0.51×
- Total profit
- $-26,094
- Equity at exit
- $28,240
- IRR
- -0.7%
- Equity multiple
- 0.94×
- Total profit
- $-2,976
- Equity at exit
- $16,376
Cash invested: $53,032 (down + closing). Projections, not guarantees.
Landlord ↔ Tenant lean methodology
- Overall (STATE)
- 87 Strongly Landlord-Friendly
- State Texas
- 87 Strongly Landlord-Friendly · R+5
- County
- — inherits STATE
- City
- — inherits STATE
ZIP-level market 79118
- Rents YoY
- 5.5%
- Active inventory
- 278
- Price-to-rent
- 9.1×
Monthly cashflow live
- Estimated rent
- $1,732 medium interval (Pro) →
- Mortgage (P&I)
- −$993
- Tax from tax record
- −$295 /mo · $3,546/yr
- Insurance
- −$79
- HOA
- −$0
- Vacancy / Maint / Mgmt
- −$364
- Net cashflow
- $1
Break-even live
Sensitivity live
| Price | -10% $108 | -5% $54 | +0% $1 | +5% $-53 | +10% $-107 |
|---|---|---|---|---|---|
| Rent | -10% $-136 | -5% $-68 | +0% $1 | +5% $69 | +10% $137 |
| Rate | -1.0pp $96 | -0.5pp $49 | base $1 | +0.5pp $-49 | +1.0pp $-98 |
UW: 25.0% down · 7.5% · 30yr · 1.5% tax · 5.0% vac · 8.0% maint · 8.0% mgmt
Financing live
Cash to close
- Down payment
- $47,350
- Closing costs
- $5,682
- Reserves months
- —
- Total cash needed
- —
Loan-product check · same deal, 3 products live
Conventional
25% down · 7.5% · 30yr
- Down + closing
- —
- Monthly P&I
- —
- Monthly cashflow
- —
- DSCR
- —
- Eligible?
- —
Personal DTI + credit; lowest rate.
DSCR
20% down · 8.5% · 30yr
- Down + closing
- —
- Monthly P&I
- —
- Monthly cashflow
- —
- DSCR
- —
- Eligible?
- —
No personal income docs; deal must DSCR.
Hard money
10% down · 12.0% · 12mo
- Down + closing
- —
- Monthly P&I
- —
- Monthly cashflow
- —
- DSCR
- —
- Eligible?
- —
Short-term bridge; refi at stabilization.
Rent comps 3 comps
| Address | Beds | Baths | Sqft | Rent | $/sqft | DOM | Units | Dist |
|---|---|---|---|---|---|---|---|---|
| 4418 Ross St Amarillo, TX | 3.0 | 2.0 | 1388 | $1,750 | $1.26 | 23d | 1 | 0.36mi |
| 2715 S Marrs St Amarillo, TX | 3.0 | 1.5 | 1274 | $1,295 | $1.02 | 45d | 1 | 1.15mi |
| 608 Lochridge Amarillo, TX | 3.0 | 2.0 | 1455 | $1,900 | $1.31 | 45d | 1 | 1.27mi |
Listing history 13 events
-
2026-06-18status $189,400 Pending 13 DOM
-
2026-06-18days on market $189,400 Active Under Contract 13 DOM
-
2026-06-17days on market $189,400 Active Under Contract 12 DOM
-
2026-06-16days on market $189,400 Active Under Contract 11 DOM
-
2026-06-15days on market $189,400 Active Under Contract 10 DOM
-
2026-06-14days on market $189,400 Active Under Contract 8 DOM
-
2026-06-13days on market $189,400 Active Under Contract 7 DOM
-
2026-06-10days on market $189,400 Active Under Contract 5 DOM
-
2026-06-09days on market $189,400 Active Under Contract 4 DOM
-
2026-06-09status $189,400 Active Under Contract 3 DOM
-
2026-06-08days on market $189,400 Active 3 DOM
-
2026-06-07remarks 699-char remark
-
2026-06-07$189,400 Active 2 DOM
ⓘ Source: listings_history table (triggers on properties + properties_extension) + one-shot
backfill from property_details.listing_events for pre-trigger history.
Tax reassessment forecast TX · Resets to sale price
- Current annual tax
- $3,546 · $295/mo
- Projected year-2 tax
- $3,546 · $295/mo
- Expected delta
- $0/yr ($0/mo · 0.0%)
ⓘ Screening estimate from a state-policy table — verify with the county assessor before closing.
Climate risk First Street
- Flood 1/10 Low FEMA zone X (unshaded) · 0% chance over 30 yrs
- Wildfire 9/10 Extreme
- Heat 5/10 Major 7 d/yr ≥97°F today · 20 d/yr by 30 yrs out
- Wind 2/10 Low
- Air quality 2/10 Low 1 unhealthy d/yr today · 1 by 30 yrs out
Nearby sold comps map
Loading sold comps map…
Walkable amenities ~0.75 mi
Loading nearby amenities…
Taxation est. · year 1
- Rental income
- $20,782
- − Mortgage interest
- −$10,609
- − Property taxes
- −$3,546
- − Insurance
- −$947
- − Repairs & maintenance
- −$1,663
- − Management
- −$1,663
- − Depreciation
- −$5,510
- Taxable loss
- −$3,155
- Est. tax savings @ 24.0%
- +$757
- After-tax cash flow
- $763/yr
For passive investors: Depreciation is non-cash, so a rental often shows a tax loss while cash-flowing — sheltering income. Rental losses are passive: they offset passive income freely, and up to $25,000/yr can offset ordinary (W-2) income if you actively participate and your MAGI is under $100k (phasing out to $0 by $150k); unused losses carry forward. On sale, claimed depreciation is recaptured at up to 25%, and gains may owe capital-gains tax (a 1031 exchange can defer both). Figures are a year-1 estimate at your 24.0% rate — not tax advice; consult a CPA.
Schools (NCES district)
- District
- Amarillo ISD
- NCES district ID
- 4808130
- Math proficiency
- 44% ▼ -9.00%
- Reading proficiency
- 41% ▼ -3.00%
- Median HH income
- $43,478
- Composite
- 35.96/100
- National rank
- #4798
- State rank
- #336 of 826 in TX
Livability — Amarillo
- Score
- 66/100
- State rank
- #624
- US rank
- #11876
Category grades
Schools grade is shown separately in the Schools card above.
Census & demographics
- Census place
- Amarillo, TX
- County
- Randall County · 137,351 people
- City population
- 185,802
- Metro
- Amarillo, TX
- Population (ZIP)
- 28,107
- Household income
- $87,810
- Rent vs Own
- Severe rent burden
- 367.0
Population outlook (Randall County) Hauer SSP2
- Today (2025)
- 152,140 people
- By 2030
- 163,107 · +7.2%
- By 2040
- 184,999 · +21.6%
- By 2050
- 206,948 · +36.0%
- By 2075
- 260,204 · +71.0%
- By 2100
- 294,980 · +93.9%
Race, ethnicity, and origin ACS 2023
- Neighborhood character
- Majority White (57%)
- Race & ethnicity
- White 57% Hispanic / Latino 35% Two or more races 18% Black 2% Asian 2% Native American 1%
- Hispanic origin (detail)
- Mexican 31%
- Common ancestry
- Lithuanian 2% Italian 2% Slovak 2%
- Foreign-born
- 6% · Canada, Vietnam
- Languages at home
- 84% English-only · Spanish 14% Vietnamese 1% French/Haitian/Cajun 1%
Political lean MEDSL · Randall
- 2024 margin
- Solid R (+60.4) · D 19.4% · R 79.8%
- 2008→2024 swing
- +2.3pp toward D · 2008: -62.7pp · 2024: -60.4pp
- All cycles
- 2024: R+60.4 2020: R+58.8 2016: R+65.1 2012: R+68.2 2008: R+62.7
Not yet ingested
- Civics
- —
Market trends
- HPI YoY
- ▼ -111.59%
- Current HPI
- 162.5206
- Rent YoY
- ▲ 5.52%
- Metro
- Amarillo, TX
- State GDP YoY
- ▲ 3.95%
- F500 in state
- 110
Industry mix (Fortune 500 HQ in TX)
| Industry | F500 HQs | Revenue |
|---|---|---|
| Energy | 16 | $1,198B |
|
||
| Technology | 5 | $198B |
|
||
| Engineering / Construction | 4 | $72B |
|
||
| Energy Services | 3 | $60B |
|
||
| Utilities | 3 | $41B |
|
||
| Healthcare | 2 | $330B |
|
||
Price history
2 events — show timeline
- 2026-06-05 Listed $189,400 AARMLS
- 2013-04-02 Sold (Public Records) — Public Records
Property tax history
+4.4%/yrLatest (2025): $3,546 · +8.7% YoY. Source: county tax records.
Cash-flow waterfall
monthlySold comps — $/sqft
last 12 mo · ≤1 miLoading sold comps…