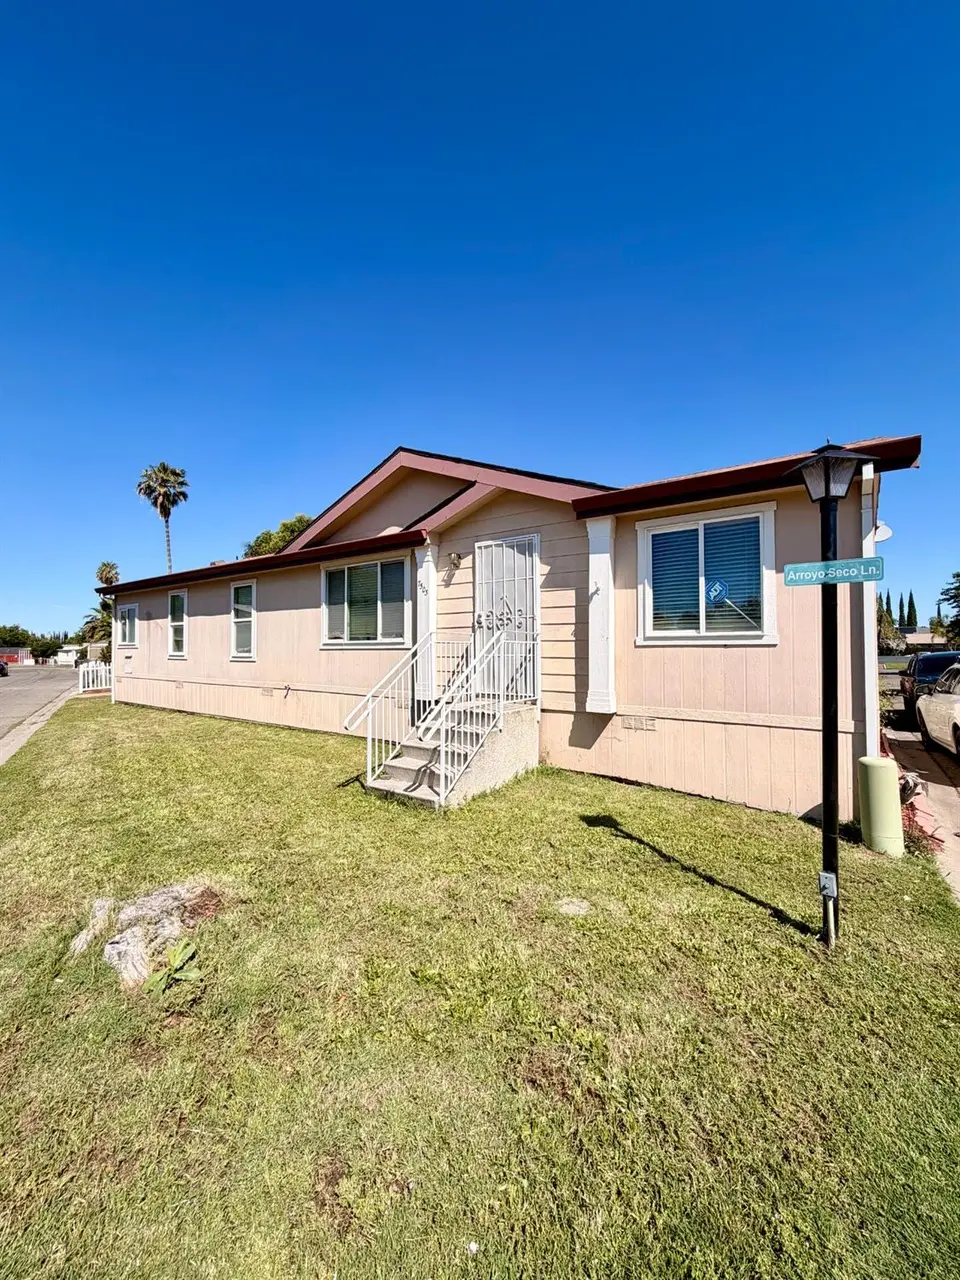
7503 Costa Mesa Cir #134 · North Highlands, CA
Flood risk 1/10 · Minimal
- FEMA flood zone
- X (unshaded)
- Chance of flooding over 30 yrs
- 0.0%
- Est. flood insurance / yr
- $507 – $1,088
Fire risk 2/10 · Minimal
- Est. fire insurance / yr
- $659 – $1,223
Heat risk 7/10 · Major
- Hot days now (above 102°F)
- 7 days/yr
- Hot days in 30 yrs
- 15 days/yr
Wind risk 1/10 · Minimal
- Chance of severe wind over 30 yrs
- —
Air-quality risk 10/10 · Severe
- Unhealthy air days now
- 34 days/yr
- Unhealthy air days in 30 yrs
- 38 days/yr
Risk factors via First Street. Map © Google.
Why this score? — see what drove the B+ grade
The composite is a weighted blend of 9 inputs, each scored 0–100. Each bar is that input's sub-score; the figure is the points it added to the 100-point composite (weight × sub-score).
- Cash flow +30.0/30.0
- ARV discount +15.0/15.0
- 1% rule +10.0/10.0
- DSCR +10.0/10.0
- Rent growth +3.9/5.0
- Schools +3.1/10.0
- Livability +3.1/5.0
- Condition / age +2.5/5.0
- Appreciation +0.0/10.0
$85,000
🖨 Deal sheet (PDF) 📄 Offer letter ✓ Due diligence
Listing remarks
Great opportunity to bring your vision to life! This spacious 3 bedrooms, 2 bathrooms, double-wide mobile home offers approximately 1,568 sq ft of living space, featuring high ceilings, a spacious kitchen and a flexible floor plan. The primary suite includes an attached room- ideal for a home office, nursery, or additional sitting area. Built in 2006, the home includes an existing HVAC system and provides a strong foundation for updates and customization. Located in Antelope Manufactured Home Community, this property is ideal for buyers looking to add value and create their own space. Priced at $85,000.
Key facts
- Existing hvac system
- Strong foundation
- Flexible floor plan
Tags
Property features AI
Finance
- Other: Located in North Highlands, CA 95660 (7503 Costa Mesa Cir #134)
- Financial info: Land lease: No (listed land lease amount present but property indicated as not land lease)
- HOA & community: No homeowners association; Not a senior community
Exterior
- Parking: Covered parking (no garage)
- Utilities: Public water; Public sewer; 220 volts in laundry
- Home design: Manufactured double-wide located in a park; Built in 2006
- Construction: Manufactured home by Skyline Homes Inc
- Exterior features: Corner lot; Composition roof
Interior
- Kitchen: Kitchen island
- Bedrooms: 3 bedrooms (4 possible)
- Flooring: Carpet; Vinyl
- Bathrooms: 2 full bathrooms with tub and shower stall
- Heating & cooling: Central heating; Central cooling
- Interior features: Cathedral/vaulted living room; Island in kitchen; Dining and family room combo; Pets allowed
- Laundry & utility: Laundry inside with 220V outlet
Neighborhood map
What this means for you Summary
Snapshot
- This is a 3-bed/2.0-bath manufactured listed at $85k.
Deal economics
- At list price, monthly cash flow is $1k ($18k/yr) — positive.
- The deal already cash-flows at list — no discount required.
- Meets the 1% rule at list price ($3k rent vs $85k).
- Recommended offer: $82k (3.0% below list) — sets the bar for market timing.
- Cap rate 27.2% vs local median 4.1% in North Highlands — top-decile yield for the area; either an underpriced asset or a hidden risk that comps aren't pricing in. Stress-test before assuming the spread holds.
Location & tenants
- Location reads 61/100 on livability (#523 in CA) — a middle-class / working-renter tenant base. Strengths: housing A+; Watch: employment C-, crime F, amenities F.
- Twin Rivers Unified (suburban): math 29% / reading 37% proficiency, ranked #970 of 1,400 in CA (top 69%) — families likely to look elsewhere, expect single-tenant / working-renter base with shorter leases; 76% free/reduced lunch — lower-income household profile, screen leases tightly.
- Zoned schools: Village Elementary (407 students, 91% FRL); Highlands High (744 students, 90% FRL).
- Market conditions: Rents rising fast (+5.7%/yr); 110 active listings in the ZIP; 35 comparable units currently listed for rent nearby; rentals leasing fast (median 13d on market — plan ~1-2 weeks tenant-placement turnaround); 6,825 units permitted in Sacramento County in 2024 (1,752 in 5+ unit buildings).
- At $2,605/mo this rent would consume 46% of the median local household income ($68k/yr) (locally 1300% of renters already pay >50% of income on rent) — very limited rent-growth headroom before tenants either downsize or default.
Forward outlook
- Local home prices are declining (-3.0%/yr); year-one equity from $588 of loan paydown is wiped out by about $3k of value loss. Plan a longer hold.
- Sacramento County population projected at +17% by 2050 — long-run rental-demand tailwind backs the buy-and-hold thesis.
- At projected returns (-3.0% appreciation + 5.7% rent growth), your $24k cash investment doubles in ~2 years — after that, you're playing with house money.
Negotiation context
- It's been on market 51 days — a 3% lower offer ($82k) is reasonable based on typical stale-listing flexibility.
Risks & watch-outs
- Climate carrying-cost: extreme-heat days projected 7→15/yr by 2055 (HVAC capex compounding) — expect insurance premiums to compound above CPI over the hold.
Questions for the listing agent
- It's been on market 51 days. Have you received any prior offers? Is the seller open to a 3% concession, seller financing, or rate buy-down credit?
- Is there a deadline driving the sale (1031 exchange, divorce, estate, relocation)? That informs how much negotiation room exists.
- Schools are D-rated, which usually means shorter tenancies and higher turnover. Who's the typical renter profile here, and what's been the actual vacancy rate?
- Crime grade is F in this area — have there been break-ins, vandalism, or insurance claims at this property in the last 3 years? What carrier currently insures it and at what premium?
- What's the average days-on-market for RENTAL listings here right now (not sales)? A rising rental-DOM trend means longer vacancies and softer asking-rent achievability than the comps imply.
- What's the recent tenant-quality profile in this submarket — average credit score on applications, eviction rate, late-payment / NSF rate, and stable-employment percentage? A property-management company in the area should have these aggregated.
- How much new for-sale + rental construction is in the pipeline within 1–3 miles? Heavy new supply typically softens prices + rents 12–24 months out; constrained supply supports both.
Investment metrics
- 1% rule
- 3.06% ✓
- Cap rate
- 27.20%
- Cash-on-cash
- 74.67%
- DSCR
- 4.32
- GRM
- 2.7
CMA / ARV
- ARV (on-the-fly)
- $114,464
- Comps found
- 2
Show comp detail 2 sales within ~0.75 mi
| Address | Dist | Beds/Ba | Sqft | Sold | Price | $/sf | Match |
|---|---|---|---|---|---|---|---|
| 3708 Arroyo Seco Ln #86 | 0.07mi | 3/2.0 | 1,440 (-8%) | 17mo | $105,000 | $73 | 69 |
| 3736 Arroyo Seco Ln #79 | 0.12mi | 3/2.0 | 1,368 (-13%) | 23mo | $83,640 | $61 | 54 |
Match score weights: distance 35% · size 25% · config 20% · recency 20%. Top-matched comps best support the ARV.
Projected returns pro-forma
-3.0% appreciation · 5.69% rent growth · sell at horizon
- IRR
- 77.5%
- Equity multiple
- 4.69×
- Total profit
- $87,826
- Equity at exit
- $12,674
- IRR
- 81.8%
- Equity multiple
- 10.64×
- Total profit
- $229,469
- Equity at exit
- $7,349
Cash invested: $23,800 (down + closing). Projections, not guarantees.
Landlord ↔ Tenant lean methodology
- Overall (STATE)
- 18 Strongly Tenant-Friendly
- State California
- 18 Strongly Tenant-Friendly · D+13
- County
- — inherits STATE
- City
- — inherits STATE
ZIP-level market 95660
- Rents YoY
- 5.7%
- Active inventory
- 110
- Price-to-rent
- 2.7×
Monthly cashflow live
- Estimated rent
- $2,605 high interval (Pro) →
- Mortgage (P&I)
- −$446
- Tax from tax record
- −$96 /mo · $1,150/yr
- Insurance
- −$35
- HOA
- −$0
- Vacancy / Maint / Mgmt
- −$547
- Net cashflow
- $1,481
Break-even live
Sensitivity live
| Price | -10% $1,529 | -5% $1,505 | +0% $1,481 | +5% $1,457 | +10% $1,433 |
|---|---|---|---|---|---|
| Rent | -10% $1,275 | -5% $1,378 | +0% $1,481 | +5% $1,584 | +10% $1,687 |
| Rate | -1.0pp $1,524 | -0.5pp $1,503 | base $1,481 | +0.5pp $1,459 | +1.0pp $1,437 |
UW: 25.0% down · 7.5% · 30yr · 1.5% tax · 5.0% vac · 8.0% maint · 8.0% mgmt
Financing live
Cash to close
- Down payment
- $21,250
- Closing costs
- $2,550
- Reserves months
- —
- Total cash needed
- —
Loan-product check · same deal, 3 products live
Conventional
25% down · 7.5% · 30yr
- Down + closing
- —
- Monthly P&I
- —
- Monthly cashflow
- —
- DSCR
- —
- Eligible?
- —
Personal DTI + credit; lowest rate.
DSCR
20% down · 8.5% · 30yr
- Down + closing
- —
- Monthly P&I
- —
- Monthly cashflow
- —
- DSCR
- —
- Eligible?
- —
No personal income docs; deal must DSCR.
Hard money
10% down · 12.0% · 12mo
- Down + closing
- —
- Monthly P&I
- —
- Monthly cashflow
- —
- DSCR
- —
- Eligible?
- —
Short-term bridge; refi at stabilization.
Rent comps 35 comps
| Address | Beds | Baths | Sqft | Rent | $/sqft | DOM | Units | Dist |
|---|---|---|---|---|---|---|---|---|
| 3825 Little Rock Dr Antelope, CA | 1.0–3.0 | 1.0–2.0 | 848 | $2,500 | $2.95 | 0d | 5 | 0.27mi |
| 3700 Navaho Dr Antelope, CA | 2.0–4.0 | 1.0–2.5 | 1308 | $2,574 | $1.97 | 0d | 9 | 0.65mi |
| 4196 Worthington Dr North Highlands, CA | 3.0 | 2.0 | 1200 | $2,350 | $1.96 | 9d | 1 | 0.70mi |
| 6909 Stoneman Dr North Highlands, CA | 3.0 | 1.0 | 1113 | $1,995 | $1.79 | 14d | 1 | 0.72mi |
| 4249 Worthington Dr North Highlands, CA | 4.0 | 2.0 | 1364 | $2,500 | $1.83 | 45d | 1 | 0.78mi |
| 3131 Scotland Dr Unit A Antelope, CA | 3.0 | 2.0 | 1200 | $2,500 | $2.08 | 6d | 1 | 0.81mi |
| 3320 Saxonville Way Antelope, CA | 3.0 | 2.0 | 1235 | $2,500 | $2.02 | 9d | 1 | 0.88mi |
| 8117 Prior Way Unit 1666 Antelope, CA | 3.0 | 2.5 | 1666 | $3,200 | $1.92 | 4d | 1 | 1.01mi |
| 3237 Lowther Way Antelope, CA | 3.0 | 2.5 | 1392 | $2,595 | $1.86 | 6d | 1 | 1.01mi |
| 8124 Pinefield Dr Antelope, CA | 3.0 | 3.0 | 1672 | $2,500 | $1.50 | 4d | 1 | 1.02mi |
| 8080 Quiet Knolls Dr Antelope, CA | 3.0 | 3.5 | 1956 | $2,645 | $1.35 | 0d | 1 | 1.06mi |
| 8082 Quiet Knolls Dr Antelope, CA | 3.0 | 2.5 | 1411 | $2,475 | $1.75 | 0d | 1 | 1.06mi |
| 8086 Quiet Knolls Dr Antelope, CA | 3.0 | 2.5 | 1436 | $2,475 | $1.72 | 0d | 1 | 1.06mi |
| 3228 Boulder Creek Way Antelope, CA | 4.0 | 2.0 | 1652 | $2,695 | $1.63 | 45d | 1 | 1.07mi |
| 6629 Medora Dr North Highlands, CA | 3.0 | 2.0 | 1090 | $1,995 | $1.83 | 45d | 1 | 1.11mi |
| 3704 Pinehill Way Antelope, CA | 3.0 | 2.0 | 1445 | $2,725 | $1.89 | 14d | 1 | 1.15mi |
| 3624 Van Owen St North Highlands, CA | 4.0 | 2.0 | 1232 | $2,200 | $1.79 | 23d | 1 | 1.16mi |
| 8020 Walerga Rd Antelope, CA | 2.0–3.0 | 2.0 | 1014 | $2,800 | $2.76 | 9d | 2 | 1.19mi |
| 8449 Bramble Bush Cir Antelope, CA | 3.0 | 2.0 | 1381 | $2,695 | $1.95 | 45d | 1 | 1.22mi |
| 6436 Thomas Dr North Highlands, CA | 4.0 | 2.0 | 1272 | $2,395 | $1.88 | 13d | 1 | 1.22mi |
| 6436 Thomas Dr North Highlands, CA | 4.0 | 2.0 | 1272 | $2,395 | $1.88 | 3d | 1 | 1.22mi |
| 2797 Rainier Way Antelope, CA | 3.0 | 2.5 | 1641 | $2,795 | $1.70 | 0d | 1 | 1.24mi |
| 8242 Scrub Oak Way Antelope, CA | 3.0 | 2.5 | 1669 | $2,595 | $1.55 | 25d | 1 | 1.25mi |
| 4400 Shandwick Dr Antelope, CA | 1.0–3.0 | 1.0–2.0 | 876 | $2,514 | $2.87 | 0d | 13 | 1.29mi |
| 8337 Scrub Oak Way Antelope, CA | 3.0 | 2.0 | 1381 | $2,450 | $1.77 | 25d | 1 | 1.33mi |
| 8020 Walerga Rd #1276 Antelope, CA | 3.0 | 2.0 | 1193 | $2,800 | $2.35 | 16d | 1 | 1.35mi |
| 8336 Lonely Hill Way Antelope, CA | 3.0 | 2.5 | 2060 | $2,795 | $1.36 | 13d | 1 | 1.36mi |
| 8303 Walerga Rd Antelope, CA | 1.0–3.0 | 1.0–2.0 | 894 | $3,351 | $3.75 | 0d | 10 | 1.38mi |
| 8516 Brisenbourg Way Antelope, CA | 3.0 | 2.5 | 1970 | $3,300 | $1.68 | 16d | 1 | 1.43mi |
| 4150 Munich Ct Antelope, CA | 3.0 | 2.0 | 1229 | $2,595 | $2.11 | 45d | 1 | 1.45mi |
| 8633 Northam Dr Antelope, CA | 4.0 | 2.5 | 1920 | $2,778 | $1.45 | 14d | 1 | 1.46mi |
| 8633 Northam Dr Antelope, CA | 4.0 | 2.5 | 1920 | $2,778 | $1.45 | 12d | 1 | 1.46mi |
| 3140 Glentana Way Antelope, CA | 3.0 | 2.0 | 1600 | $2,295 | $1.43 | 25d | 1 | 1.46mi |
| 7330 Stratford Pl #706 Sacramento, CA | 3.0 | 2.0 | 1322 | $2,600 | $1.97 | 3d | 1 | 1.48mi |
| 8525 Crystal Ridge Way Antelope, CA | 4.0 | 2.5 | 2189 | $2,820 | $1.29 | 45d | 1 | 1.49mi |
Listing history 14 events
-
2026-06-21days on market $85,000 Active 51 DOM
-
2026-06-18days on market $85,000 Active 48 DOM
-
2026-06-17days on market $85,000 Active 47 DOM
-
2026-06-16days on market $85,000 Active 46 DOM
-
2026-06-15days on market $85,000 Active 45 DOM
-
2026-06-13days on market $85,000 Active 43 DOM
-
2026-06-13days on market $85,000 Active 42 DOM
-
2026-06-09days on market $85,000 Active 39 DOM
-
2026-06-08days on market $85,000 Active 38 DOM
-
2026-06-07days on market $85,000 Active 37 DOM
-
2026-06-03days on market $85,000 Active 33 DOM
-
2026-06-02days on market $85,000 Active 32 DOM
-
2026-06-01days on market $85,000 Active 31 DOM
-
2026-05-31days on market $85,000 Active 30 DOM
ⓘ Source: listings_history table (triggers on properties + properties_extension) + one-shot
backfill from property_details.listing_events for pre-trigger history.
Tax reassessment forecast CA · Resets to sale price
- Current annual tax
- $1,150 · $96/mo
- Projected year-2 tax
- $1,150 · $96/mo
- Expected delta
- $0/yr ($0/mo · 0.0%)
ⓘ Screening estimate from a state-policy table — verify with the county assessor before closing.
Climate risk First Street
- Flood 1/10 Low FEMA zone X (unshaded) · 0% chance over 30 yrs
- Wildfire 2/10 Low
- Heat 7/10 Severe 7 d/yr ≥102°F today · 15 d/yr by 30 yrs out
- Wind 1/10 Low
- Air quality 10/10 Extreme 34 unhealthy d/yr today · 38 by 30 yrs out
Nearby sold comps map
Loading sold comps map…
Walkable amenities ~0.75 mi
Loading nearby amenities…
Taxation est. · year 1
- Rental income
- $31,261
- − Mortgage interest
- −$4,761
- − Property taxes
- −$1,150
- − Insurance
- −$425
- − Repairs & maintenance
- −$2,501
- − Management
- −$2,501
- − Depreciation
- −$2,473
- Taxable income
- $17,450
- Est. tax owed @ 24.0%
- −$4,188
- After-tax cash flow
- $13,584/yr
For passive investors: Depreciation is non-cash, so a rental often shows a tax loss while cash-flowing — sheltering income. Rental losses are passive: they offset passive income freely, and up to $25,000/yr can offset ordinary (W-2) income if you actively participate and your MAGI is under $100k (phasing out to $0 by $150k); unused losses carry forward. On sale, claimed depreciation is recaptured at up to 25%, and gains may owe capital-gains tax (a 1031 exchange can defer both). Figures are a year-1 estimate at your 24.0% rate — not tax advice; consult a CPA.
Schools (NCES district)
- District
- Twin Rivers Unified
- NCES district ID
- 0601332
- Math proficiency
- 29% ▲ 2.00%
- Reading proficiency
- 37% ▲ 2.00%
- Median HH income
- $42,481
- Composite
- 30.67/100
- National rank
- #11437
- State rank
- #970 of 1400 in CA
Livability — North Highlands
- Score
- 61/100
- State rank
- #523
- US rank
- #17613
Category grades
Schools grade is shown separately in the Schools card above.
Census & demographics
- Census place
- North Highlands, CA
- County
- Sacramento County · 1,539,646 people
- City population
- 56,900
- Metro
- Sacramento-Roseville-Folsom, CA
- Population (ZIP)
- 35,451
- Household income
- $68,235
- Rent vs Own
- Severe rent burden
- 1300.0
Population outlook (Sacramento County) Hauer SSP2
- Today (2025)
- 1,660,763 people
- By 2030
- 1,732,990 · +4.3%
- By 2040
- 1,855,755 · +11.7%
- By 2050
- 1,941,335 · +16.9%
- By 2075
- 2,046,162 · +23.2%
- By 2100
- 1,961,444 · +18.1%
Race, ethnicity, and origin ACS 2023
- Neighborhood character
- Diverse neighborhood (Simpson 0.69)
- Race & ethnicity
- White 41% Hispanic / Latino 37% Two or more races 16% Black 9% Asian 7%
- Hispanic origin (detail)
- Mexican 29%
- Common ancestry
- Subsaharan African 5% Scotch-Irish 2% Scandinavian 2%
- Foreign-born
- 28% · Canada, Vietnam
- Languages at home
- 56% English-only · Spanish 25% Russian/Polish/Slavic 9% Other Indo-European 5%
Political lean MEDSL · Sacramento
- 2024 margin
- D (+19.7) · D 58.1% · R 38.4% · Other 3.5%
- 2008→2024 swing
- +0.7pp no change · 2008: 19.0pp · 2024: 19.7pp
- All cycles
- 2024: D+19.7 2020: D+25.3 2016: D+23.7 2012: D+16.3 2008: D+19.0
Not yet ingested
- Civics
- —
Market trends
- HPI YoY
- ▼ -273.83%
- Current HPI
- 438.1022
- Rent YoY
- ▲ 5.69%
- Metro
- Sacramento-Roseville-Folsom, CA
- State GDP YoY
- ▲ 3.21%
- F500 in state
- 116
Industry mix (Fortune 500 HQ in CA)
| Industry | F500 HQs | Revenue |
|---|---|---|
| Technology | 27 | $1,492B |
|
||
| Financial Services | 3 | $174B |
|
||
| Retail | 3 | $44B |
|
||
| Insurance | 3 | $26B |
|
||
| Media / Entertainment | 2 | $115B |
|
||
| Pharmaceuticals / Biotech | 2 | $62B |
|
||
Property tax history
+0.1%/yrLatest (2025): $1,150 · -1.2% YoY. Source: county tax records.
Cash-flow waterfall
monthlySold comps — $/sqft
last 12 mo · ≤1 miLoading sold comps…