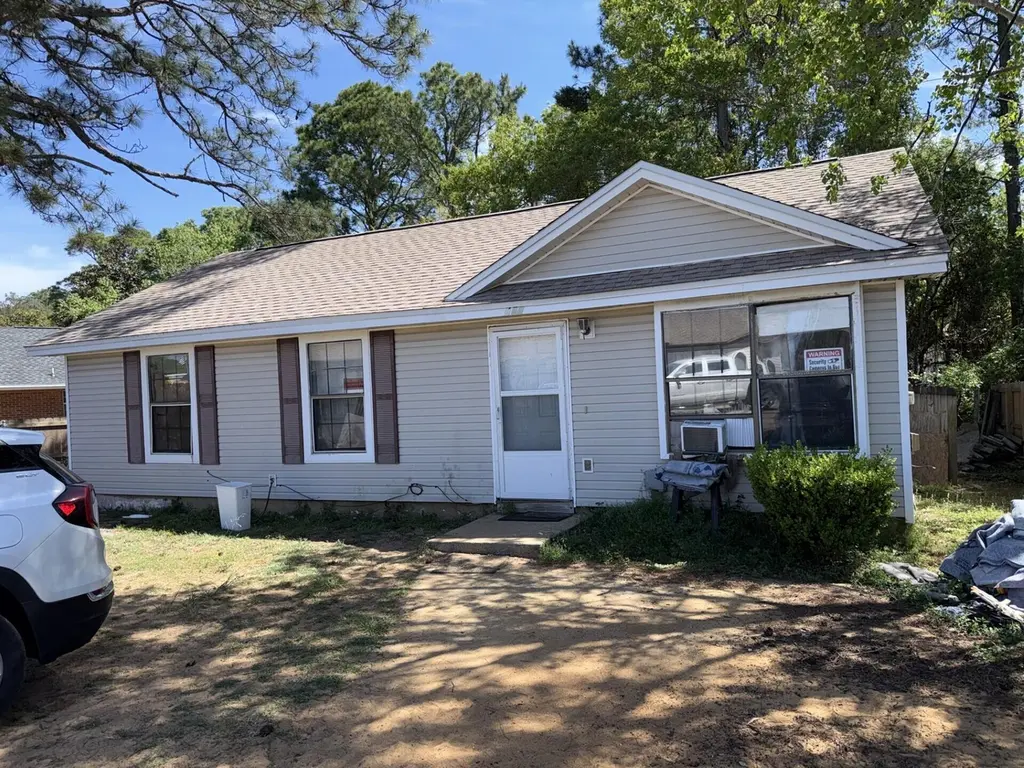
459 Winlake Ct · Hurlburt Field, FL
Flood risk 7/10 · Major
- FEMA flood zone
- X (unshaded)
- Chance of flooding over 30 yrs
- 0.99%
- Est. flood insurance / yr
- $507 – $1,088
Fire risk 6/10 · Moderate
- Est. fire insurance / yr
- $947 – $1,759
Heat risk 10/10 · Severe
- Hot days now (above 104°F)
- 7 days/yr
- Hot days in 30 yrs
- 24 days/yr
Wind risk 9/10 · Severe
- Chance of severe wind over 30 yrs
- 99.0%
Air-quality risk 2/10 · Minimal
- Unhealthy air days now
- 1 days/yr
- Unhealthy air days in 30 yrs
- 2 days/yr
Risk factors via First Street. Map © Google.
Why this score? — see what drove the D grade
The composite is a weighted blend of 9 inputs, each scored 0–100. Each bar is that input's sub-score; the figure is the points it added to the 100-point composite (weight × sub-score).
- Cash flow +14.2/30.0
- ARV discount +6.6/15.0
- Schools +5.2/10.0
- DSCR +4.3/10.0
- 1% rule +3.1/10.0
- Livability +2.5/5.0
- Condition / age +2.5/5.0
- Rent growth +2.4/5.0
- Appreciation +0.0/10.0
$260,000
🖨 Deal sheet 📄 Offer letter ✓ Due diligence
Listing remarks
3 bedrooms 2 bath home in Mary Esther within 5 miles from Hurlburt Field. Buyer to verify all pertinent information. Property is being sold AS IS.
Key facts
- 4,356 sq ft lot
- Built 1990
- Listed 15 days
Tags
Property features AI
Finance
- HOA & community: Subdivision: CASA LOMA S/D
Exterior
- Utilities: Electric service; Central electric HVAC
- Home design: Ranch-style home; Single-story
- Construction: Built in 1990; Frame construction with vinyl siding; Shingle roof; Slab foundation
- Exterior features: Located on a county road; Residential single-family zoning; Lot dimensions approximately 50 feet
Interior
- Bedrooms: 3 bedrooms; Master bedroom on the first floor; All bedrooms on the first floor
- Flooring: Vinyl flooring; Carpeted areas
- Bathrooms: 2 full bathrooms
- Heating & cooling: Central air conditioning
- Interior features: Open dining area; Family room
Neighborhood map
What this means for you Summary
Snapshot
- This is a 3-bed/2.0-bath single-family listed at $260k.
Deal economics
- At list price, monthly cash flow is $-23 ($-280/yr) — negative.
- To cash-flow at today's rent, offer at most $256k (1.6% below list).
- To meet the 1% rule (rent ≥ 1% of price), the offer needs to be $212k (18.6% below list).
- Recommended offer: $212k (18.6% below list) — sets the bar for 1% rule.
- Cap rate 6.5% vs local median 4.6% in Hurlburt Field — top-decile yield for the area; either an underpriced asset or a hidden risk that comps aren't pricing in. Stress-test before assuming the spread holds.
Location & tenants
- Location reads: area grade D — affects rentability + tenant quality, not the cash-flow math above.
- Okaloosa (other): math 60% / reading 60% proficiency, ranked #12 of 73 in FL (top 16%) — acceptable for families but not a draw, mixed tenant base, ~2y average lease.
- Zoned schools: Florosa Elementary School (math 65% / reading 61%, grade B, #582 of 2,144 statewide, top 28%, 536 students, 52% FRL); Fort Walton Beach High School (math 54% / reading 58%, grade C, #131 of 667 statewide, top 20%, 1,620 students, 42% FRL).
- Market conditions: Rents soft (-0.5%/yr); 175 active listings in the ZIP; 9 comparable units currently listed for rent nearby; rentals lingering (median 44d on market — plan ~5-8 weeks vacancy on turnover, expect pricing pressure); 56% of comp listings sitting > 30 days — soft ceiling on asking rent; solid renter incomes; 1,268 units permitted in Okaloosa County in 2024 (175 in 5+ unit buildings).
- This rent runs 33% of the median local income ($78k/yr) — at the standard rent-burdened threshold; future hikes will face affordability resistance.
Forward outlook
- Local home prices are declining (-3.0%/yr); year-one equity from $2k of loan paydown is wiped out by about $8k of value loss. Plan a longer hold.
- Okaloosa County population projected at +37% by 2050 — long-run rental-demand tailwind backs the buy-and-hold thesis.
Negotiation context
- It's been on market 15 days — a 2% lower offer ($256k) is reasonable based on typical stale-listing flexibility.
- 8 sale attempts since 27y ago with the ask held roughly flat each time — persistent listings suggest the price (not the market) is what's stuck; bring a comps-based counter.
- Current owner paid $55k; list at $260k implies a 373% gain — meaningful room to come down on a strong offer.
Risks & watch-outs
- Watch-outs: flood insurance adds $66/mo.
- Climate carrying-cost: major flood risk; severe wind risk, 99% chance of damaging wind over 30y; major wildfire risk; extreme-heat days projected 7→24/yr by 2055 (HVAC capex compounding) — expect insurance premiums to compound above CPI over the hold.
Questions for the listing agent
- What do current leases actually rent for vs. the listed asking? Can we see a recent rent roll and the last 12 months of T-12 income?
- What's the actual annual flood-insurance premium (NFIP or private), and is the property in a SFHA with mandatory coverage?
- Is there a deadline driving the sale (1031 exchange, divorce, estate, relocation)? That informs how much negotiation room exists.
- The area grade is low — what's the realistic commute time and amenity access for the typical tenant pool here? Any planned neighborhood developments (good or bad) we should know about?
- What's the average days-on-market for RENTAL listings here right now (not sales)? A rising rental-DOM trend means longer vacancies and softer asking-rent achievability than the comps imply.
- What's the recent tenant-quality profile in this submarket — average credit score on applications, eviction rate, late-payment / NSF rate, and stable-employment percentage? A property-management company in the area should have these aggregated.
- How much new for-sale + rental construction is in the pipeline within 1–3 miles? Heavy new supply typically softens prices + rents 12–24 months out; constrained supply supports both.
Investment metrics
- 1% rule
- 0.81% ✗
- Cap rate
- 6.49%
- Cash-on-cash
- 0.71%
- DSCR
- 1.03
- GRM
- 10.2
CMA / ARV
- ARV (on-the-fly)
- $255,024
- Comps found
- 2
Show comp detail 2 sales within ~0.75 mi
| Address | Dist | Beds/Ba | Sqft | Sold | Price | $/sf | Match |
|---|---|---|---|---|---|---|---|
| 2 S Lake Ave | 0.10mi | 3/1.5 | 1,040 (+3%) | 5mo | $240,000 | $231 | 85 |
| 478 Asa Marie Ct | 0.06mi | 3/2.0 | 1,110 (+10%) | 8mo | $280,000 | $252 | 74 |
Match score weights: distance 35% · size 25% · config 20% · recency 20%. Top-matched comps best support the ARV.
Projected returns pro-forma
-3.0% appreciation · 0.0% rent growth · sell at horizon
- IRR
- -20.2%
- Equity multiple
- 0.32×
- Total profit
- $-49,846
- Equity at exit
- $38,767
- IRR
- -21.0%
- Equity multiple
- 0.05×
- Total profit
- $-69,401
- Equity at exit
- $22,480
Cash invested: $72,800 (down + closing). Projections, not guarantees.
Landlord ↔ Tenant lean methodology
- Overall (STATE)
- 87 Strongly Landlord-Friendly
- State Florida
- 87 Strongly Landlord-Friendly · R+3
- County
- — inherits STATE
- City
- — inherits STATE
ZIP-level market 32569
- Home prices YoY
- -26.5%
- Rents YoY
- -0.5%
- Active inventory
- 175
- Price-to-rent
- 10.2×
Monthly cashflow live
- Estimated rent
- $2,116 high interval (Pro) →
- Mortgage (P&I)
- −$1,363
- Tax from tax record
- −$156 /mo · $1,876/yr
- Insurance
- −$108
- Flood insurance flood zone
- −$66 /mo · $798/yr
- HOA
- −$0
- Vacancy / Maint / Mgmt
- −$444
- Net cashflow
- $-23
Break-even live
UW: 25.0% down · 7.5% · 30yr · 1.5% tax · 5.0% vac · 8.0% maint · 8.0% mgmt
Financing live
Cash to close
- Down payment
- $65,000
- Closing costs
- $7,800
- Reserves months
- —
- Total cash needed
- —
Loan-product check · same deal, 3 products live
Conventional
25% down · 7.5% · 30yr
- Down + closing
- —
- Monthly P&I
- —
- Monthly cashflow
- —
- DSCR
- —
- Eligible?
- —
Personal DTI + credit; lowest rate.
DSCR
20% down · 8.5% · 30yr
- Down + closing
- —
- Monthly P&I
- —
- Monthly cashflow
- —
- DSCR
- —
- Eligible?
- —
No personal income docs; deal must DSCR.
Hard money
10% down · 12.0% · 12mo
- Down + closing
- —
- Monthly P&I
- —
- Monthly cashflow
- —
- DSCR
- —
- Eligible?
- —
Short-term bridge; refi at stabilization.
Rent comps 9 comps
| Address | Beds | Baths | Sqft | Rent | $/sqft | DOM | Units | Dist |
|---|---|---|---|---|---|---|---|---|
| 427 Bristol Cove Rd Mary Esther, FL | 3.0 | 2.0 | 1382 | $2,000 | $1.45 | 43d | 1 | 0.24mi |
| 427 Bristol Cove Rd Mary Esther, FL | 3.0 | 2.0 | 1382 | $1,850 | $1.34 | 13d | 1 | 0.24mi |
| 46 Kathleen Dr Mary Esther, FL | 3.0 | 2.0 | 1448 | $2,200 | $1.52 | 20d | 1 | 0.53mi |
| 20 Stowe Rd Mary Esther, FL | 3.0 | 2.0 | 1316 | $2,000 | $1.52 | 20d | 1 | 0.67mi |
| 806 Boulevard de Lorleans Mary Esther, FL | 3.0 | 2.0 | 1125 | $1,700 | $1.51 | 43d | 1 | 1.20mi |
| 806 Boulevard de Lorleans Mary Esther, FL | 3.0 | 2.0 | 1125 | $1,700 | $1.51 | 20d | 1 | 1.20mi |
| 116 Dolphin Rd Mary Esther, FL | 3.0 | 2.0 | 1434 | $1,775 | $1.24 | 43d | 1 | 1.30mi |
| 208 Squirrel Haven Rd Unit A Mary Esther, FL | 2.0 | 1.0 | 1100 | $1,200 | $1.09 | 43d | 1 | 1.31mi |
| 324 Michael Cir Mary Esther, FL | 2.0 | 1.0 | 1000 | $1,350 | $1.35 | 43d | 1 | 1.44mi |
Listing history 15 events
-
2026-05-01status Pending
-
2026-04-15$260,000 Active
-
2010-07-12historical
-
2010-04-16$50,000
-
2009-07-12$60,000
-
2009-06-08historical
-
2009-04-06$79,900
-
2009-04-06$79,900
-
2003-05-09historical
-
2002-12-12$72,000
-
2002-12-12$72,000
-
1999-12-07soldstatus $55,000
-
1999-12-03soldstatus $55,000
-
1999-10-12$59,900
-
1990-02-01soldstatus $47,500
ⓘ Source: listings_history table (triggers on properties + properties_extension) + one-shot
backfill from property_details.listing_events for pre-trigger history.
Tax reassessment forecast FL · Resets to sale price
- Current annual tax
- $1,876 · $156/mo
- Projected year-2 tax
- $2,158 · $180/mo
- Expected delta
- +$282/yr (+$23/mo · 15.0%)
ⓘ Screening estimate from a state-policy table — verify with the county assessor before closing.
Climate risk First Street
- Flood 7/10 Severe FEMA zone X (unshaded) · 99% chance over 30 yrs
- Wildfire 6/10 Major
- Heat 10/10 Extreme 7 d/yr ≥104°F today · 24 d/yr by 30 yrs out
- Wind 9/10 Extreme 99% chance of damaging wind over 30 yrs
- Air quality 2/10 Low 1 unhealthy d/yr today · 2 by 30 yrs out
Nearby sold comps map
Loading sold comps map…
Walkable amenities ~0.75 mi
Loading nearby amenities…
Taxation est. · year 1
- Rental income
- $25,387
- − Mortgage interest
- −$14,564
- − Property taxes
- −$1,876
- − Insurance
- −$2,098
- − Repairs & maintenance
- −$2,031
- − Management
- −$2,031
- − Depreciation
- −$7,564
- Taxable loss
- −$4,776
- Est. tax savings @ 24.0%
- +$1,146
- After-tax cash flow
- $867/yr
For passive investors: Depreciation is non-cash, so a rental often shows a tax loss while cash-flowing — sheltering income. Rental losses are passive: they offset passive income freely, and up to $25,000/yr can offset ordinary (W-2) income if you actively participate and your MAGI is under $100k (phasing out to $0 by $150k); unused losses carry forward. On sale, claimed depreciation is recaptured at up to 25%, and gains may owe capital-gains tax (a 1031 exchange can defer both). Figures are a year-1 estimate at your 24.0% rate — not tax advice; consult a CPA.
Schools (NCES district)
- District
- Okaloosa
- NCES district ID
- 1201380
- Math proficiency
- 60% ▼ -12.00%
- Reading proficiency
- 60% ▼ -4.00%
- Median HH income
- $55,601
- Composite
- 51.62/100
- National rank
- #1705
- State rank
- #12 of 73 in FL
Livability — Hurlburt Field
No livability data for this city. (Only ~50 U.S. cities are tracked.)
Census & demographics
- County
- Okaloosa County · 194,352 people
- City population
- 2,344
- Metro
- Crestview-Fort Walton Beach-Destin, FL
- Population (ZIP)
- 12,063
- Household income
- $77,718
- Rent vs Own
- Severe rent burden
- 416.0
Population outlook (Okaloosa County) Hauer SSP2
- Today (2025)
- 235,133 people
- By 2030
- 253,483 · +7.8%
- By 2040
- 289,537 · +23.1%
- By 2050
- 322,954 · +37.3%
- By 2075
- 399,624 · +70.0%
- By 2100
- 425,311 · +80.9%
Race, ethnicity, and origin ACS 2023
- Neighborhood character
- Diverse neighborhood (Simpson 0.58)
- Race & ethnicity
- White 63% Two or more races 12% Black 12% Hispanic / Latino 9% Asian 8%
- Hispanic origin (detail)
- Mexican 3% Puerto Rican 2%
- Common ancestry
- Slovak 5% Romanian 2% Lithuanian 2%
- Foreign-born
- 5% · Canada, South Korea, China
- Languages at home
- 89% English-only · Other Indo-European 4% Spanish 3% Tagalog/Filipino 1%
Political lean MEDSL · Okaloosa
- 2024 margin
- Solid R (+42.4) · D 28.2% · R 70.7% · Other 1.1%
- 2008→2024 swing
- +2.5pp toward D · 2008: -44.9pp · 2024: -42.4pp
- All cycles
- 2024: R+42.4 2020: R+39.1 2016: R+47.8 2012: R+49.4 2008: R+44.9
Not yet ingested
- Civics
- —
Market trends
- HPI YoY
- ▼ -97.13%
- Current HPI
- 269.266
- Rent YoY
- ▼ -0.45%
- Metro
- Crestview-Fort Walton Beach-Destin, FL
- State GDP YoY
- ▲ 3.28%
- F500 in state
- 36
Industry mix (Fortune 500 HQ in FL)
| Industry | F500 HQs | Revenue |
|---|---|---|
| Industrial Technology | 2 | $29B |
|
||
| Insurance | 2 | $17B |
|
||
| Retail | 1 | $60B |
|
||
| Technology Distribution | 1 | $58B |
|
||
| Homebuilding | 1 | $35B |
|
||
| Technology Manufacturing | 1 | $35B |
|
||
Price history
+447.4% since first listed15 events — show timeline
- 2026-05-01 Pending — ECAR
- 2026-04-15 Listed $260,000 ECAR
- 2010-07-12 Listing Removed — NAMLS
- 2010-04-16 Listed $50,000 ECAR
- 2009-07-12 Listed $60,000 NAMLS
- 2009-06-08 Listing Removed — NAMLS
- 2009-04-06 Listed $79,900 NAMLS
- 2009-04-06 Listed $79,900 ECAR
- 2003-05-09 Listing Removed — NAMLS
- 2002-12-12 Listed $72,000 NAMLS
- 2002-12-12 Listed $72,000 ECAR
- 1999-12-07 Sold (Public Records) $55,000 Public Records
- 1999-12-03 Sold (MLS) $55,000 ECAR
- 1999-10-12 Listed $59,900 ECAR
- 1990-02-01 Sold (Public Records) $47,500 Public Records
Property tax history
+13.6%/yrLatest (2025): $1,876 · +225.4% YoY. Source: county tax records.
Cash-flow waterfall
monthlySold comps — $/sqft
last 12 mo · ≤1 miLoading sold comps…