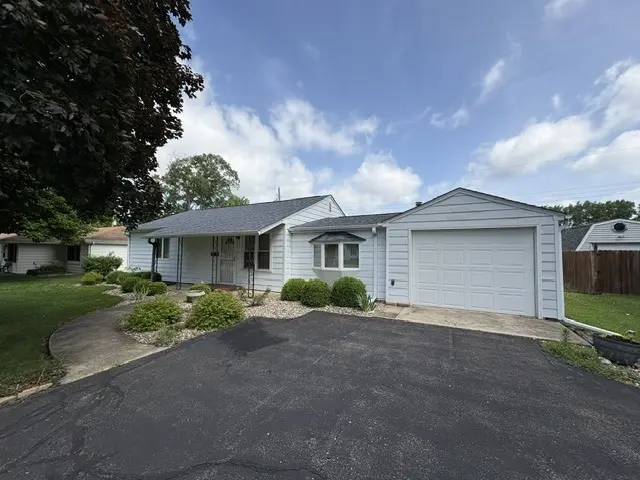
836 E Locust St · Watseka, IL
Flood risk 1/10 · Minimal
- FEMA flood zone
- X (shaded)
- Chance of flooding over 30 yrs
- 0.0%
- Est. flood insurance / yr
- $473 – $860
Fire risk 2/10 · Minimal
- Est. fire insurance / yr
- $804 – $1,492
Heat risk 3/10 · Minor
- Hot days now (above 104°F)
- 7 days/yr
- Hot days in 30 yrs
- 17 days/yr
Wind risk 2/10 · Minimal
- Chance of severe wind over 30 yrs
- 1.0%
Air-quality risk 2/10 · Minimal
- Unhealthy air days now
- 1 days/yr
- Unhealthy air days in 30 yrs
- 1 days/yr
Risk factors via First Street. Map © Google.
Why this score? — see what drove the B- grade
The composite is a weighted blend of 9 inputs, each scored 0–100. Each bar is that input's sub-score; the figure is the points it added to the 100-point composite (weight × sub-score).
- Cash flow +27.0/30.0
- DSCR +9.4/10.0
- ARV discount +8.4/15.0
- 1% rule +6.4/10.0
- Appreciation +5.7/10.0
- Livability +3.2/5.0
- Rent growth +2.5/5.0
- Condition / age +2.5/5.0
- Schools +2.2/10.0
$85,000
🖨 Deal sheet 📄 Offer letter ✓ Due diligence
Listing remarks
Cozy 3BR, 1 Bath home located outside the flood plain. Updated laminate flooring in LR, DR, and Master BR. Furnace, C/A, and Roof approx. 10 years old. Appliances are staying. Fenced backyard w/ 10x12 storage shed. 12x12 Deck w/ retractable sunshade. 1 Car att Garage.
Key facts
- Retractable sunshade
- Storage shed
- Deck
Tags
Property features AI
Finance
- Other: School bus service available; Zoning: Single-family; Lot dimensions approximately 80 x 119 (less than 0.25 acre); Directions: Rt to 8th St, South on 8th to Locust, Left on Locust to property
- HOA & community: No master association fee required
Exterior
- Parking: Attached garage with garage door opener (1 garage space, 1 total parking space)
- Utilities: Public water; Public sewer; 150 amp electric service with circuit breakers
- Home design: Detached single-family home; One story; Fee simple ownership; Built approximately 71–80 years ago; Built before 1978
- Construction: Aluminum siding; Asphalt roof
- Exterior features: Deck; Fenced yard
Interior
- Kitchen: Galley-style kitchen on the main level, vinyl flooring, approximately 8 x 18; Range; Microwave; Dishwasher; Refrigerator; Freezer
- Bedrooms: Three bedrooms (all on the main level); Master bedroom with laminate flooring, approximately 10 x 11; Bedroom 2 carpeted, approximately 8 x 11; Bedroom 3 approximately 8 x 10
- Flooring: Laminate flooring in living room, dining room, and master bedroom; Laminate in dining room (approximately 12 x 15); Carpet in one bedroom; Vinyl in kitchen
- Bathrooms: One full bathroom
- Heating & cooling: Natural gas forced air heating; Central air conditioning
- Interior features: Six total rooms; Ceiling fan(s); CO detectors
- Laundry & utility: Laundry room; Washer; Dryer
Neighborhood map
What this means for you Summary
Snapshot
- This is a 3-bed/1.0-bath single-family listed at $85k.
Deal economics
- At list price, monthly cash flow is $239 ($3k/yr) — positive.
- The deal already cash-flows at list — no discount required.
- Meets the 1% rule at list price ($968 rent vs $85k).
- Cap rate 9.7% vs local median 3.5% in Watseka — top-decile yield for the area; either an underpriced asset or a hidden risk that comps aren't pricing in. Stress-test before assuming the spread holds.
Location & tenants
- Location reads 63/100 on livability (#811 in IL) — a middle-class / working-renter tenant base. Strengths: cost of living A+, housing A+, crime B+; Watch: schools D, amenities F, commute F.
- Iroquois County CUSD 9 (rural): math 18% / reading 35% proficiency, ranked #316 of 620 in IL (top 51%) — low school quality limits family demand, transient renter base, plan for 1-2y turnover.
- Market conditions: 39 active listings in the ZIP; 14 units permitted in Iroquois County in 2024 (0 in 5+ unit buildings).
Forward outlook
- In year one you build about $2k of equity ($588 loan paydown + $1k appreciation (1.3% local appreciation)).
- Iroquois County population projected at -20% by 2050 — secular population decline; favor cash flow + early exit over multi-decade hold.
- At projected returns (1.3% appreciation + 3.0% rent growth), your $24k cash investment doubles in ~5 years — after that, you're playing with house money.
Negotiation context
- Only 7 days on market — expect competitive offers; lowballing is unlikely to land.
Risks & watch-outs
- Watch-outs: built in 1950 — expect roof / HVAC / electrical / plumbing capex.
Questions for the listing agent
- Built in 1950 — when were the roof, HVAC, electrical panel, plumbing, and water heater last replaced?
- Is there a deadline driving the sale (1031 exchange, divorce, estate, relocation)? That informs how much negotiation room exists.
- Schools are D-rated, which usually means shorter tenancies and higher turnover. Who's the typical renter profile here, and what's been the actual vacancy rate?
- What's the average days-on-market for RENTAL listings here right now (not sales)? A rising rental-DOM trend means longer vacancies and softer asking-rent achievability than the comps imply.
- What's the recent tenant-quality profile in this submarket — average credit score on applications, eviction rate, late-payment / NSF rate, and stable-employment percentage? A property-management company in the area should have these aggregated.
- How much new for-sale + rental construction is in the pipeline within 1–3 miles? Heavy new supply typically softens prices + rents 12–24 months out; constrained supply supports both.
Investment metrics
- 1% rule
- 1.14% ✓
- Cap rate
- 9.66%
- Cash-on-cash
- 12.03%
- DSCR
- 1.54
- GRM
- 7.3
CMA / ARV
- ARV (on-the-fly)
- $86,688
- Comps found
- 12
Show comp detail 12 sales within ~0.75 mi
| Address | Dist | Beds/Ba | Sqft | Sold | Price | $/sf | Match |
|---|---|---|---|---|---|---|---|
| 708 E Sycamore St | 0.42mi | 3/1.5 | 1,032 (0%) | 2mo | $139,900 | $136 | 77 |
| 538 E Mulberry St | 0.25mi | 2/1.0 (-1) | 1,064 (+3%) | 2mo | $85,000 | $80 | 76 |
| 317 S 9th St | 0.12mi | 2/1.0 (-1) | 980 (-5%) | 19mo | $40,000 | $41 | 65 |
| 428 E Cherry St | 0.35mi | 2/1.0 (-1) | 940 (-9%) | 3mo | $28,000 | $30 | 62 |
| 317 S 4th St | 0.62mi | 2/1.0 (-1) | 1,040 (+1%) | 7mo | $119,900 | $115 | 59 |
| 225 S Short St | 0.24mi | 2/1.0 (-1) | 932 (-10%) | 15mo | $94,900 | $102 | 55 |
| 530 E Ash St | 0.36mi | 3/1.0 | 1,170 (+13%) | 9mo | $85,900 | $73 | 54 |
| 323 S 9th St | 0.13mi | 2/1.0 (-1) | 910 (-12%) | 21mo | $49,000 | $54 | 52 |
| 530 E Locust St | 0.26mi | 3/1.5 | 1,152 (+12%) | 20mo | $163,300 | $142 | 50 |
| 714 E Sycamore St | 0.42mi | 2/1.5 (-1) | 1,176 (+14%) | 6mo | $99,000 | $84 | 45 |
| 430 E Elm St | 0.56mi | 3/1.0 | 1,176 (+14%) | 7mo | $85,500 | $73 | 44 |
| 223 N 4th St | 0.66mi | 2/1.0 (-1) | 1,065 (+3%) | 23mo | $100,000 | $94 | 40 |
Match score weights: distance 35% · size 25% · config 20% · recency 20%. Top-matched comps best support the ARV.
Projected returns pro-forma
1.33% appreciation · 3.0% rent growth · sell at horizon
- IRR
- 14.7%
- Equity multiple
- 1.76×
- Total profit
- $18,141
- Equity at exit
- $30,486
- IRR
- 17.8%
- Equity multiple
- 3.22×
- Total profit
- $52,953
- Equity at exit
- $41,674
Cash invested: $23,800 (down + closing). Projections, not guarantees.
Landlord ↔ Tenant lean methodology
- Overall (STATE)
- 43 Moderately Tenant-Leaning
- State Illinois
- 43 Moderately Tenant-Leaning · D+7
- County
- — inherits STATE
- City
- — inherits STATE
ZIP-level market 60970
- Home prices YoY
- 0.9%
- Active inventory
- 39
- Price-to-rent
- 7.3×
Monthly cashflow live
- Estimated rent
- $968 medium interval (Pro) →
- Mortgage (P&I)
- −$446
- Tax from tax record
- −$45 /mo · $539/yr
- Insurance
- −$35
- HOA
- −$0
- Vacancy / Maint / Mgmt
- −$203
- Net cashflow
- $239
Break-even live
UW: 25.0% down · 7.5% · 30yr · 1.5% tax · 5.0% vac · 8.0% maint · 8.0% mgmt
Financing live
Cash to close
- Down payment
- $21,250
- Closing costs
- $2,550
- Reserves months
- —
- Total cash needed
- —
Loan-product check · same deal, 3 products live
Conventional
25% down · 7.5% · 30yr
- Down + closing
- —
- Monthly P&I
- —
- Monthly cashflow
- —
- DSCR
- —
- Eligible?
- —
Personal DTI + credit; lowest rate.
DSCR
20% down · 8.5% · 30yr
- Down + closing
- —
- Monthly P&I
- —
- Monthly cashflow
- —
- DSCR
- —
- Eligible?
- —
No personal income docs; deal must DSCR.
Hard money
10% down · 12.0% · 12mo
- Down + closing
- —
- Monthly P&I
- —
- Monthly cashflow
- —
- DSCR
- —
- Eligible?
- —
Short-term bridge; refi at stabilization.
Listing history 4 events
-
2026-06-18days on market $85,000 Active 7 DOM
-
2026-06-17days on market $85,000 Active 6 DOM
-
2026-06-16remarks 268-char remark
-
2026-06-16$85,000 Active 5 DOM
ⓘ Source: listings_history table (triggers on properties + properties_extension) + one-shot
backfill from property_details.listing_events for pre-trigger history.
Tax reassessment forecast IL · Partial reset (capped growth)
- Current annual tax
- $539 · $45/mo
- Projected year-2 tax
- $1,234 · $103/mo
- Expected delta
- +$695/yr (+$58/mo · 128.9%)
ⓘ Screening estimate from a state-policy table — verify with the county assessor before closing.
Climate risk First Street
- Flood 1/10 Low FEMA zone X (shaded) · 0% chance over 30 yrs
- Wildfire 2/10 Low
- Heat 3/10 Moderate 7 d/yr ≥104°F today · 17 d/yr by 30 yrs out
- Wind 2/10 Low 100% chance of damaging wind over 30 yrs
- Air quality 2/10 Low 1 unhealthy d/yr today · 1 by 30 yrs out
Nearby sold comps map
Loading sold comps map…
Walkable amenities ~0.75 mi
Loading nearby amenities…
Taxation est. · year 1
- Rental income
- $11,615
- − Mortgage interest
- −$4,761
- − Property taxes
- −$539
- − Insurance
- −$425
- − Repairs & maintenance
- −$929
- − Management
- −$929
- − Depreciation
- −$2,473
- Taxable income
- $1,558
- Est. tax owed @ 24.0%
- −$374
- After-tax cash flow
- $2,489/yr
For passive investors: Depreciation is non-cash, so a rental often shows a tax loss while cash-flowing — sheltering income. Rental losses are passive: they offset passive income freely, and up to $25,000/yr can offset ordinary (W-2) income if you actively participate and your MAGI is under $100k (phasing out to $0 by $150k); unused losses carry forward. On sale, claimed depreciation is recaptured at up to 25%, and gains may owe capital-gains tax (a 1031 exchange can defer both). Figures are a year-1 estimate at your 24.0% rate — not tax advice; consult a CPA.
Schools (NCES district)
- District
- Iroquois County CUSD 9
- NCES district ID
- 1720170
- Math proficiency
- 18% ▼ -12.00%
- Reading proficiency
- 35% ▼ -8.00%
- Median HH income
- $38,590
- Composite
- 22.14/100
- National rank
- #8171
- State rank
- #316 of 620 in IL
Livability — Watseka
- Score
- 63/100
- State rank
- #811
- US rank
- #15998
Category grades
Schools grade is shown separately in the Schools card above.
Census & demographics
- Census place
- Watseka, IL
- Population (ZIP)
- 5,965
Population outlook (Iroquois County) Hauer SSP2
- Today (2025)
- 26,826 people
- By 2030
- 25,771 · -3.9%
- By 2040
- 23,589 · -12.1%
- By 2050
- 21,523 · -19.8%
- By 2075
- 17,998 · -32.9%
- By 2100
- 14,979 · -44.2%
Race, ethnicity, and origin ACS 2023
- Neighborhood character
- Predominantly White (88%)
- Race & ethnicity
- White 88% Two or more races 5% Hispanic / Latino 5% Asian 1%
- Common ancestry
- Lithuanian 6% Iranian 3% Romanian 3%
- Foreign-born
- 3% · Canada
- Languages at home
- 96% English-only · Spanish 2% Tagalog/Filipino 1%
Political lean MEDSL · Iroquois
- 2024 margin
- Solid R (+57.3) · D 20.6% · R 78.0% · Other 1.4%
- 2008→2024 swing
- -27.5pp toward R · 2008: -29.8pp · 2024: -57.3pp
- All cycles
- 2024: R+57.3 2020: R+56.7 2016: R+56.0 2012: R+44.7 2008: R+29.8
Not yet ingested
- Civics
- —
Market trends
- HPI YoY
- ▲ 1.33%
- Current HPI
- 156.8
- Rent YoY
- —
- Metro
- —
- State GDP YoY
- ▲ 1.59%
- F500 in state
- 60
Industry mix (Fortune 500 HQ in IL)
| Industry | F500 HQs | Revenue |
|---|---|---|
| Insurance | 4 | $201B |
|
||
| Consumer Goods | 4 | $87B |
|
||
| Industrial Machinery | 3 | $64B |
|
||
| Healthcare | 2 | $55B |
|
||
| Retail / Pharmacy | 1 | $148B |
|
||
| Agriculture / Food | 1 | $86B |
|
||
Property tax history
-0.6%/yrLatest (2024): $539 · -57.4% YoY. Source: county tax records.
Cash-flow waterfall
monthlySold comps — $/sqft
last 12 mo · ≤1 miLoading sold comps…