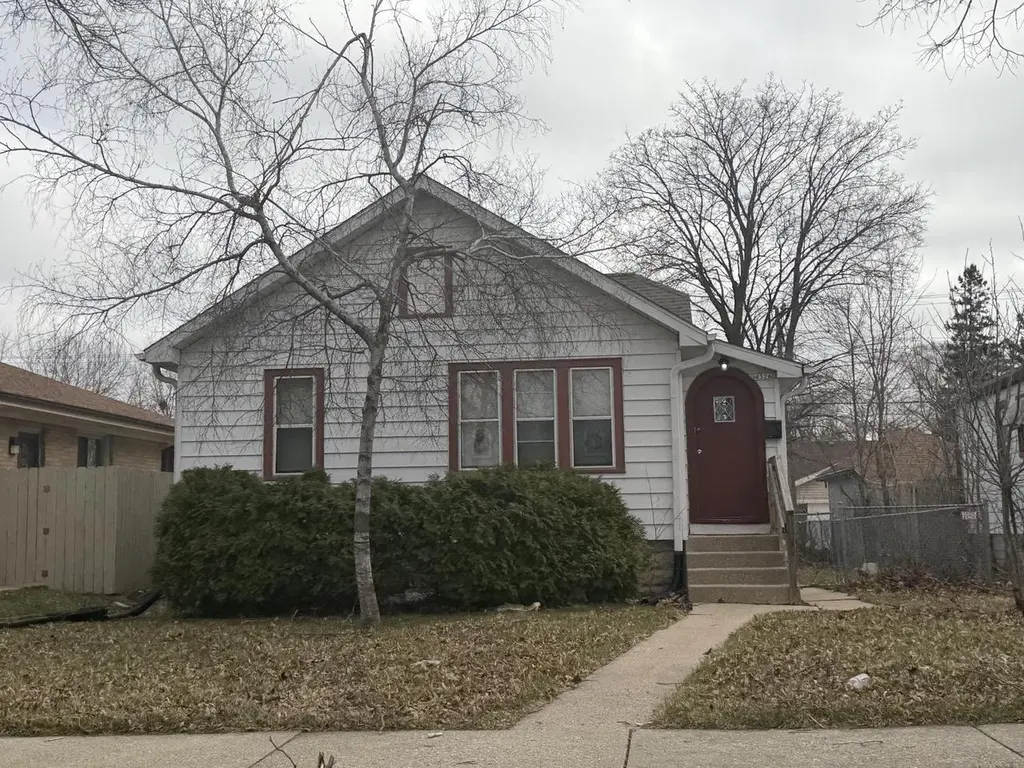
4326 N 65th St · Milwaukee, WI
Flood risk 6/10 · Moderate
- FEMA flood zone
- X (unshaded)
- Chance of flooding over 30 yrs
- 0.7%
- Est. flood insurance / yr
- $473 – $860
Fire risk 1/10 · Minimal
- Est. fire insurance / yr
- $636 – $1,182
Heat risk 2/10 · Minimal
- Hot days now (above 100°F)
- 7 days/yr
- Hot days in 30 yrs
- 13 days/yr
Wind risk 2/10 · Minimal
- Chance of severe wind over 30 yrs
- —
Air-quality risk 2/10 · Minimal
- Unhealthy air days now
- 2 days/yr
- Unhealthy air days in 30 yrs
- 2 days/yr
Risk factors via First Street. Map © Google.
Why this score? — see what drove the C+ grade
The composite is a weighted blend of 9 inputs, each scored 0–100. Each bar is that input's sub-score; the figure is the points it added to the 100-point composite (weight × sub-score).
- Cash flow +19.9/30.0
- ARV discount +13.4/15.0
- DSCR +6.3/10.0
- 1% rule +5.7/10.0
- Appreciation +5.7/10.0
- Rent growth +4.3/5.0
- Livability +4.0/5.0
- Condition / age +2.5/5.0
- Schools +1.2/10.0
$119,900
🖨 Deal sheet 📄 Offer letter ✓ Due diligence
Listing remarks MLS
Cute and cozy 2BR in popular area, has been a long time rental home. It has a newer roof and garage. One of the originals in the area. This home is occupied by a tenant and is affordable.
Key facts
- 5,227 sq ft lot
- Garage
- Built 1930
Neighborhood map
What this means for you Summary
Snapshot
- This is a 2-bed/1.0-bath single-family listed at $120k.
Deal economics
- At list price, monthly cash flow is $145 ($2k/yr) — positive.
- The deal already cash-flows at list — no discount required.
- Meets the 1% rule at list price ($1k rent vs $120k).
- Recommended offer: $113k (6.0% below list) — sets the bar for market timing.
- Cap rate 7.7% vs local median 5.1% in Milwaukee — top-decile yield for the area; either an underpriced asset or a hidden risk that comps aren't pricing in. Stress-test before assuming the spread holds.
Location & tenants
- Location reads 81/100 on livability (#55 in WI, #1,534 nationally) — a professional / high-income tenant draw. Strengths: amenities A+, commute A+, cost of living A+; Watch: employment D+, schools F, crime F.
- Milwaukee School District (urban): math 10% / reading 18% proficiency, ranked #337 of 342 in WI (top 98%) — low school quality limits family demand, transient renter base, plan for 1-2y turnover; 77% free/reduced lunch — lower-income household profile, screen leases tightly.
- Market conditions: Rents rising fast (+7.0%/yr); 126 active listings in the ZIP; 21 comparable units currently listed for rent nearby; rentals lingering (median 44d on market — plan ~5-8 weeks vacancy on turnover, expect pricing pressure); 52% of comp listings sitting > 30 days — soft ceiling on asking rent; 1,017 units permitted in Milwaukee County in 2024 (803 in 5+ unit buildings).
- This rent runs 33% of the median local income ($47k/yr) — at the standard rent-burdened threshold; future hikes will face affordability resistance.
Forward outlook
- In year one you build about $2k of equity ($829 loan paydown + $2k appreciation (1.3% local appreciation)).
- Milwaukee County population projected at +4% by 2050 — modest demand growth; plan on rents tracking national, not racing it.
- At projected returns (1.3% appreciation + 7.0% rent growth), your $34k cash investment doubles in ~6 years — after that, you're playing with house money.
Negotiation context
- It's been on market 77 days — a 6% lower offer ($113k) is reasonable based on typical stale-listing flexibility.
- 2 sale attempts since 13y ago with the ask held roughly flat each time — persistent listings suggest the price (not the market) is what's stuck; bring a comps-based counter.
- Current owner paid $18k; list at $120k implies a 566% gain — meaningful room to come down on a strong offer.
Risks & watch-outs
- Watch-outs: built in 1930 — expect roof / HVAC / electrical / plumbing capex.
- Climate carrying-cost: major flood risk — expect insurance premiums to compound above CPI over the hold.
Questions for the listing agent
- It's been on market 77 days. Have you received any prior offers? Is the seller open to a 6% concession, seller financing, or rate buy-down credit?
- Built in 1930 — when were the roof, HVAC, electrical panel, plumbing, and water heater last replaced?
- Why hasn't it sold? Are there any deal-killer items the seller is aware of (foundation, flood, title, zoning, code violations)?
- Is there a deadline driving the sale (1031 exchange, divorce, estate, relocation)? That informs how much negotiation room exists.
- Schools are F-rated, which usually means shorter tenancies and higher turnover. Who's the typical renter profile here, and what's been the actual vacancy rate?
- Crime grade is F in this area — have there been break-ins, vandalism, or insurance claims at this property in the last 3 years? What carrier currently insures it and at what premium?
- What's the average days-on-market for RENTAL listings here right now (not sales)? A rising rental-DOM trend means longer vacancies and softer asking-rent achievability than the comps imply.
- What's the recent tenant-quality profile in this submarket — average credit score on applications, eviction rate, late-payment / NSF rate, and stable-employment percentage? A property-management company in the area should have these aggregated.
- How much new for-sale + rental construction is in the pipeline within 1–3 miles? Heavy new supply typically softens prices + rents 12–24 months out; constrained supply supports both.
Investment metrics
- 1% rule
- 1.07% ✓
- Cap rate
- 7.74%
- Cash-on-cash
- 5.18%
- DSCR
- 1.23
- GRM
- 7.8
CMA / ARV
- ARV (median comp)
- $137,890
- List price
- $119,900
- Delta
- -13.05%
- Verdict
- UNDERPRICED
- Comps
- 20 within 1.0 mi
Show comp detail 12 sales within ~0.75 mi
| Address | Dist | Beds/Ba | Sqft | Sold | Price | $/sf | Match |
|---|---|---|---|---|---|---|---|
| 4437 N 65th St | 0.14mi | 2/2.0 | 828 (+4%) | 4mo | $64,900 | $78 | 78 |
| 4418 N 67th St | 0.17mi | 2/1.0 | 728 (-8%) | 2mo | $116,500 | $160 | 77 |
| 4407 N 62nd St | 0.18mi | 2/1.0 | 842 (+6%) | 6mo | $67,500 | $80 | 76 |
| 5601 W Congress St | 0.49mi | 2/1.0 | 800 (+1%) | 8mo | $172,000 | $215 | 69 |
| 4353 N 63rd St | 0.11mi | 2/1.0 | 846 (+7%) | 23mo | $155,000 | $183 | 65 |
| 4485 N 56th St | 0.53mi | 2/1.0 | 767 (-3%) | 7mo | $105,000 | $137 | 64 |
| 3931 N 70th St | 0.63mi | 2/1.0 | 768 (-3%) | 2mo | $178,000 | $232 | 64 |
| 5359 W Leon Ter | 0.63mi | 3/1.0 (+1) | 800 (+1%) | 1mo | $120,000 | $150 | 64 |
| 3740 N 63rd St | 0.75mi | 2/1.0 | 792 (0%) | 7mo | $115,000 | $145 | 59 |
| 6447 W Leon Ter | 0.55mi | 3/1.0 (+1) | 776 (-2%) | 17mo | $150,000 | $193 | 51 |
| 4525 N 64th St | 0.26mi | 2/1.0 | 903 (+14%) | 23mo | $200,000 | $221 | 46 |
| 4624 N 67th St | 0.39mi | 2/2.0 | 888 (+12%) | 21mo | $134,900 | $152 | 40 |
Match score weights: distance 35% · size 25% · config 20% · recency 20%. Top-matched comps best support the ARV.
Projected returns pro-forma
1.33% appreciation · 7.01% rent growth · sell at horizon
- IRR
- 10.5%
- Equity multiple
- 1.56×
- Total profit
- $18,827
- Equity at exit
- $42,993
- IRR
- 16.5%
- Equity multiple
- 3.30×
- Total profit
- $77,329
- Equity at exit
- $58,764
Cash invested: $33,572 (down + closing). Projections, not guarantees.
Landlord ↔ Tenant lean methodology
- Overall (STATE)
- 73 Landlord-Friendly
- State Wisconsin
- 73 Landlord-Friendly · R+2
- County
- — inherits STATE
- City
- — inherits STATE
ZIP-level market 53216
- Home prices YoY
- 0.3%
- Rents YoY
- 7.0%
- Active inventory
- 126
- Price-to-rent
- 7.8×
Monthly cashflow live
- Estimated rent
- $1,279 high interval (Pro) →
- Mortgage (P&I)
- −$629
- Tax from tax record
- −$187 /mo · $2,244/yr
- Insurance
- −$50
- HOA
- −$0
- Vacancy / Maint / Mgmt
- −$269
- Net cashflow
- $145
Break-even live
UW: 25.0% down · 7.5% · 30yr · 1.5% tax · 5.0% vac · 8.0% maint · 8.0% mgmt
Financing live
Cash to close
- Down payment
- $29,975
- Closing costs
- $3,597
- Reserves months
- —
- Total cash needed
- —
Loan-product check · same deal, 3 products live
Conventional
25% down · 7.5% · 30yr
- Down + closing
- —
- Monthly P&I
- —
- Monthly cashflow
- —
- DSCR
- —
- Eligible?
- —
Personal DTI + credit; lowest rate.
DSCR
20% down · 8.5% · 30yr
- Down + closing
- —
- Monthly P&I
- —
- Monthly cashflow
- —
- DSCR
- —
- Eligible?
- —
No personal income docs; deal must DSCR.
Hard money
10% down · 12.0% · 12mo
- Down + closing
- —
- Monthly P&I
- —
- Monthly cashflow
- —
- DSCR
- —
- Eligible?
- —
Short-term bridge; refi at stabilization.
Rent comps 21 comps
| Address | Beds | Baths | Sqft | Rent | $/sqft | DOM | Units | Dist |
|---|---|---|---|---|---|---|---|---|
| 4153 N 68th St Milwaukee, WI | 3.0 | 1.0 | 1025 | $1,700 | $1.66 | 43d | 1 | 0.30mi |
| 4060 N 73rd St Apt 2 Milwaukee, WI | 1.0 | 1.0 | 650 | $850 | $1.31 | 17d | 1 | 0.59mi |
| 6518 W Hampton Ave Unit 2 Milwaukee, WI | 2.0 | 1.0 | 1100 | $1,200 | $1.09 | 43d | 1 | 0.63mi |
| 4843 N 72nd St Milwaukee, WI | 3.0 | 1.0 | 1014 | $1,485 | $1.46 | 43d | 1 | 0.83mi |
| 6960 W Appleton Ave Apt 4 Milwaukee, WI | 2.0 | 1.0 | 750 | $1,100 | $1.47 | 43d | 1 | 0.87mi |
| 4640 N 51st Blvd Milwaukee, WI | 2.0 | 1.0 | 1075 | $1,275 | $1.19 | 43d | 1 | 0.92mi |
| 7701 W Hampton Ave Unit 6 Milwaukee, WI | 2.0 | 1.0 | 816 | $1,250 | $1.53 | 43d | 1 | 0.98mi |
| 8043 W Appleton Ave Milwaukee, WI | 2.0 | 1.0 | 900 | $1,200 | $1.33 | 14d | 1 | 1.09mi |
| 7348 W Medford Ave Unit 7348A Milwaukee, WI | 2.0 | 1.0 | 1095 | $950 | $0.87 | 23d | 1 | 1.15mi |
| 5137 W Keefe Ave Unit 5137 Milwaukee, WI | 2.0 | 1.0 | 1000 | $1,550 | $1.55 | 3d | 1 | 1.19mi |
| 4278 N 84th St Unit 1 Milwaukee, WI | 2.0 | 1.0 | 750 | $995 | $1.33 | 23d | 1 | 1.21mi |
| 4727 N 46th St Milwaukee, WI | 3.0 | 1.0 | 936 | $1,700 | $1.82 | 43d | 1 | 1.23mi |
| 4852 N 48th St Unit 4852 Milwaukee, WI | 2.0 | 1.0 | 830 | $995 | $1.20 | 2d | 1 | 1.25mi |
| 4479A N 44th St Milwaukee, WI | 2.0 | 1.0 | 1000 | $895 | $0.90 | 43d | 1 | 1.25mi |
| 4703 N 45th St Milwaukee, WI | 3.0 | 1.0 | 1031 | $1,695 | $1.64 | 23d | 1 | 1.27mi |
| 4141 N 84th St Unit 4141 Milwaukee, WI | 2.0 | 1.0 | 950 | $1,300 | $1.37 | 43d | 1 | 1.28mi |
| 4052 N 85th St Milwaukee, WI | 3.0 | 1.0 | 1113 | $1,500 | $1.35 | 4d | 1 | 1.34mi |
| 4702 N 44th St Milwaukee, WI | 3.0 | 2.0 | 1050 | $1,850 | $1.76 | 43d | 1 | 1.36mi |
| 3890 N Sherman Blvd Milwaukee, WI | 2.0 | 1.0 | 950 | $1,100 | $1.16 | 12d | 1 | 1.44mi |
| 5050 N 47th St Milwaukee, WI | 2.0 | 1.0 | 1092 | $1,700 | $1.56 | 43d | 1 | 1.45mi |
| 3925 N 42nd St Milwaukee, WI | 2.0 | 1.0 | 985 | $1,400 | $1.42 | 23d | 1 | 1.48mi |
Listing history 21 events
-
2026-06-18days on market $119,900 Active 77 DOM
-
2026-06-17days on market $119,900 Active 76 DOM
-
2026-06-16days on market $119,900 Active 75 DOM
-
2026-06-15days on market $119,900 Active 74 DOM
-
2026-06-13days on market $119,900 Active 72 DOM
-
2026-06-13days on market $119,900 Active 71 DOM
-
2026-06-09days on market $119,900 Active 68 DOM
-
2026-06-08days on market $119,900 Active 67 DOM
-
2026-06-07days on market $119,900 Active 66 DOM
-
2026-06-05days on market $119,900 Active 63 DOM
-
2026-06-03days on market $119,900 Active 62 DOM
-
2026-06-02days on market $119,900 Active 61 DOM
-
2026-06-01days on market $119,900 Active 60 DOM
-
2026-05-31days on market $119,900 Active 59 DOM
-
2026-04-02$119,900 Active 187-char remark
Show marketing remark (187 chars)
Cute and cozy 2BR in popular area, has been a long time rental home. It has a newer roof and garage. One of the originals in the area. This home is occupied by a tenant and is affordable.
-
2013-01-12$25,000 215-char remark
Show marketing remark (215 chars)
Livingroom is very long and spacious. Seller has a small kitchen table in LR and computer table in opposite corner. New kitchen cabinets and counter tops. There are 2 rooms in the basement. Nice fenced in back yard.
-
2013-01-12historical 215-char remark
Show marketing remark (215 chars)
Livingroom is very long and spacious. Seller has a small kitchen table in LR and computer table in opposite corner. New kitchen cabinets and counter tops. There are 2 rooms in the basement. Nice fenced in back yard.
-
2011-05-13soldstatus $18,000 215-char remark
Show marketing remark (215 chars)
Livingroom is very long and spacious. Seller has a small kitchen table in LR and computer table in opposite corner. New kitchen cabinets and counter tops. There are 2 rooms in the basement. Nice fenced in back yard.
-
2001-08-16soldstatus $40,000
-
1994-09-01soldstatus $27,500
-
1988-11-01soldstatus $27,500
ⓘ Source: listings_history table (triggers on properties + properties_extension) + one-shot
backfill from property_details.listing_events for pre-trigger history.
Tax reassessment forecast WI · Partial reset (capped growth)
- Current annual tax
- $2,244 · $187/mo
- Projected year-2 tax
- $2,244 · $187/mo
- Expected delta
- $0/yr ($0/mo · 0.0%)
ⓘ Screening estimate from a state-policy table — verify with the county assessor before closing.
Climate risk First Street
- Flood 6/10 Major FEMA zone X (unshaded) · 70% chance over 30 yrs
- Wildfire 1/10 Low
- Heat 2/10 Low 7 d/yr ≥100°F today · 13 d/yr by 30 yrs out
- Wind 2/10 Low
- Air quality 2/10 Low 2 unhealthy d/yr today · 2 by 30 yrs out
Nearby sold comps map
Loading sold comps map…
Walkable amenities ~0.75 mi
Loading nearby amenities…
Taxation est. · year 1
- Rental income
- $15,353
- − Mortgage interest
- −$6,716
- − Property taxes
- −$2,244
- − Insurance
- −$600
- − Repairs & maintenance
- −$1,228
- − Management
- −$1,228
- − Depreciation
- −$3,488
- Taxable loss
- −$151
- Est. tax savings @ 24.0%
- +$36
- After-tax cash flow
- $1,776/yr
For passive investors: Depreciation is non-cash, so a rental often shows a tax loss while cash-flowing — sheltering income. Rental losses are passive: they offset passive income freely, and up to $25,000/yr can offset ordinary (W-2) income if you actively participate and your MAGI is under $100k (phasing out to $0 by $150k); unused losses carry forward. On sale, claimed depreciation is recaptured at up to 25%, and gains may owe capital-gains tax (a 1031 exchange can defer both). Figures are a year-1 estimate at your 24.0% rate — not tax advice; consult a CPA.
Schools (NCES district)
- District
- Milwaukee School District
- NCES district ID
- 5509600
- Math proficiency
- 10% ▼ -5.00%
- Reading proficiency
- 18% ▬ 0.00%
- Median HH income
- $36,339
- Composite
- 11.61/100
- National rank
- #9696
- State rank
- #337 of 342 in WI
Livability — Milwaukee
- Score
- 81/100
- State rank
- #55
- US rank
- #1534
Category grades
Schools grade is shown separately in the Schools card above.
Census & demographics
- Census place
- Milwaukee, WI
- County
- Milwaukee County · 926,379 people
- City population
- 573,768
- Metro
- Milwaukee-Waukesha, WI
- Population (ZIP)
- 30,345
- Household income
- $46,752
- Rent vs Own
- Severe rent burden
- 2202.0
Population outlook (Milwaukee County) Hauer SSP2
- Today (2025)
- 995,758 people
- By 2030
- 1,009,124 · +1.3%
- By 2040
- 1,028,128 · +3.3%
- By 2050
- 1,040,066 · +4.4%
- By 2075
- 1,057,849 · +6.2%
- By 2100
- 1,039,774 · +4.4%
Race, ethnicity, and origin ACS 2023
- Neighborhood character
- Predominantly Black (81%)
- Race & ethnicity
- Black 81% White 9% Hispanic / Latino 5% Two or more races 5% Asian 3%
- Hispanic origin (detail)
- Mexican 2% Puerto Rican 3%
- Common ancestry
- Romanian 1%
- Foreign-born
- 3% · Canada, Philippines, China
- Languages at home
- 93% English-only · Spanish 4% Other Asian/Pacific 2%
Political lean MEDSL · Milwaukee
- 2024 margin
- Solid D (+38.5) · D 68.3% · R 29.8% · Other 1.8%
- 2008→2024 swing
- +2.7pp toward D · 2008: 35.9pp · 2024: 38.5pp
- All cycles
- 2024: D+38.5 2020: D+39.9 2016: D+37.5 2012: D+34.6 2008: D+35.9
Not yet ingested
- Civics
- —
Market trends
- HPI YoY
- ▲ 1.33%
- Current HPI
- 381.0954
- Rent YoY
- ▲ 7.01%
- Metro
- Milwaukee-Waukesha, WI
- State GDP YoY
- ▲ 2.10%
- F500 in state
- 20
Industry mix (Fortune 500 HQ in WI)
| Industry | F500 HQs | Revenue |
|---|---|---|
| Industrial Machinery | 4 | $23B |
|
||
| Industrial Technology | 2 | $36B |
|
||
| Insurance | 1 | $36B |
|
||
| Professional Services | 1 | $19B |
|
||
| Utilities | 1 | $9B |
|
||
| Consumer Goods | 1 | $3B |
|
||
Price history
+336.0% since first listed7 events — show timeline
- 2026-04-02 Listed $119,900 METROMLS
- 2013-01-12 Listing Removed — METROMLS
- 2013-01-12 Listed $25,000 METROMLS
- 2011-05-13 Sold (MLS) $18,000 METROMLS
- 2001-08-16 Sold (Public Records) $40,000 Public Records
- 1994-09-01 Sold (Public Records) $27,500 Public Records
- 1988-11-01 Sold (Public Records) $27,500 Public Records
Property tax history
+1.8%/yrLatest (2024): $2,244 · +10.9% YoY. Source: county tax records.
Cash-flow waterfall
monthlySold comps — $/sqft
last 12 mo · ≤1 miLoading sold comps…