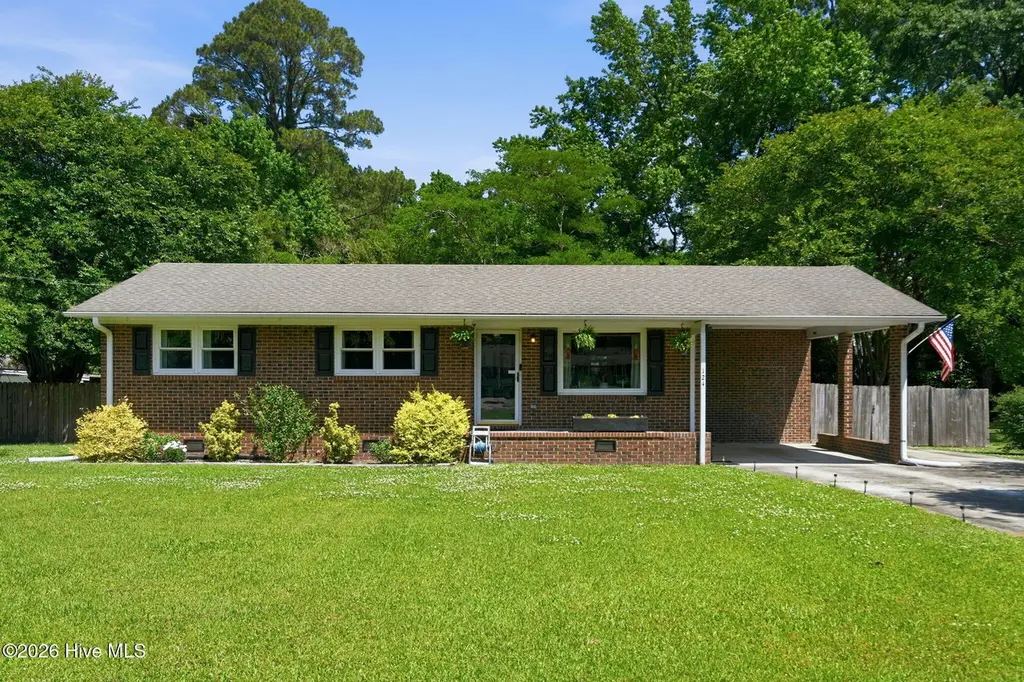
124 Humphrey Blvd · Richlands, NC
Flood risk 1/10 · Minimal
- FEMA flood zone
- X (unshaded)
- Chance of flooding over 30 yrs
- 0.0%
- Est. flood insurance / yr
- $507 – $1,088
Fire risk 5/10 · Moderate
- Est. fire insurance / yr
- $906 – $1,684
Heat risk 8/10 · Major
- Hot days now (above 106°F)
- 7 days/yr
- Hot days in 30 yrs
- 18 days/yr
Wind risk 8/10 · Major
- Chance of severe wind over 30 yrs
- 80.0%
Air-quality risk 2/10 · Minimal
- Unhealthy air days now
- 1 days/yr
- Unhealthy air days in 30 yrs
- 2 days/yr
Risk factors via First Street. Map © Google.
Why this score? — see what drove the D grade
The composite is a weighted blend of 9 inputs, each scored 0–100. Each bar is that input's sub-score; the figure is the points it added to the 100-point composite (weight × sub-score).
- Cash flow +13.9/30.0
- ARV discount +8.5/15.0
- DSCR +4.2/10.0
- Schools +3.9/10.0
- Livability +3.5/5.0
- 1% rule +2.5/10.0
- Rent growth +2.5/5.0
- Condition / age +2.5/5.0
- Appreciation +0.0/10.0
$225,000
🖨 Deal sheet 📄 Offer letter ✓ Due diligence
Listing remarks
Property is easy to show-multiple times a day-two hour notice. Charming Brick Home with Spacious Outdoor Oasis Welcome to your dream home! This beautifully maintained brick residence offers a perfect blend of comfort and style, situated on a generous lot with a privacy fence that ensures tranquility. 3 Spacious Bedrooms: Ideal for families or guests, each bedroom offers ample space and natural light. Enjoy the convenience of nicely updated interiors that blend contemporary aesthetics with cozy charm. Enjoy your wooden deck; Perfect for outdoor entertaining or relaxing, the large deck overlooks a serene backyard. Enjoy your storage shed: Ample storage for your gardening tools or recreational
Key facts
- Covered carport
- Privacy fence
- Storage shed
Tags
Property features AI
Finance
- Other: Zoning: R-8M; Lot approximately 0.45 acres (100 x 200 x 100 x 200); Road frontage on city street and state road; Directions: From Jacksonville take Hwy 24 towards Richlands. After you pass the 258 turn take a right onto Humphrey Blvd. House is on your left
- HOA & community: No association amenities
Exterior
- Parking: Has carport (1 space); Concrete parking surface
- Utilities: Public water; Water connected; Septic tank sewer
- Home design: Single-family residence; One story; Entry level: 1
- Construction: Brick and frame construction; Built on crawl space
- Exterior features: Covered patio/porch; Deck; Front porch; Privacy wood fencing in back yard; Shingle roof; Has view
Interior
- Kitchen: Electric water heater
- Bedrooms: Total rooms: 6
- Bathrooms: 1 full bathroom; 1 half bathroom
- Heating & cooling: Heat pump heating; Electric heating; Heat pump cooling
- Interior features: Kitchen island; Ceiling fan(s); Eat-in kitchen; Crawl space basement
- Laundry & utility: Dedicated laundry room
Neighborhood map
What this means for you Summary
Snapshot
- This is a 3-bed/1.5-bath single-family listed at $225k.
Deal economics
- At list price, monthly cash flow is $25 ($301/yr) — positive.
- The deal already cash-flows at list — no discount required.
- To meet the 1% rule (rent ≥ 1% of price), the offer needs to be $170k (24.6% below list).
- Recommended offer: $170k (24.6% below list) — sets the bar for 1% rule.
- Cap rate 6.4% vs local median 4.0% in Richlands — top-decile yield for the area; either an underpriced asset or a hidden risk that comps aren't pricing in. Stress-test before assuming the spread holds.
Location & tenants
- Location reads 69/100 on livability (#151 in NC) — a middle-class / working-renter tenant base. Strengths: crime A+, cost of living A+, housing A+; Watch: employment D, amenities F, commute F.
- Onslow County Schools (other): math 42% / reading 49% proficiency, ranked #84 of 178 in NC (top 47%) — families likely to look elsewhere, expect single-tenant / working-renter base with shorter leases.
- Zoned schools: Richlands Elementary (math 44% / reading 40%, grade F, #633 of 1,410 statewide, top 48%, 642 students, 52% FRL); Trexler Middle (math 37% / reading 46%, grade F, #206 of 475 statewide, top 44%, 825 students, 45% FRL); Richlands High (math 52% / reading 67%, grade C+, #216 of 535 statewide, top 43%, 960 students, 40% FRL).
- Market conditions: 200 active listings in the ZIP; 1,246 units permitted in Onslow County in 2024 (0 in 5+ unit buildings).
- This rent runs 30% of the median local income ($67k/yr) — at the standard rent-burdened threshold; future hikes will face affordability resistance.
Forward outlook
- Local home prices are declining (-3.0%/yr); year-one equity from $2k of loan paydown is wiped out by about $7k of value loss. Plan a longer hold.
Negotiation context
- It's been on market 16 days — a 2% lower offer ($222k) is reasonable based on typical stale-listing flexibility.
- Current owner paid $120k; list at $225k implies a 88% gain — meaningful room to come down on a strong offer.
Risks & watch-outs
- Climate carrying-cost: severe wind risk, 80% chance of damaging wind over 30y; moderate wildfire risk; extreme-heat days projected 7→18/yr by 2055 (HVAC capex compounding) — expect insurance premiums to compound above CPI over the hold.
Questions for the listing agent
- Built in 1978 — when were the roof, HVAC, electrical panel, plumbing, and water heater last replaced?
- Is there a deadline driving the sale (1031 exchange, divorce, estate, relocation)? That informs how much negotiation room exists.
- The area grade is low — what's the realistic commute time and amenity access for the typical tenant pool here? Any planned neighborhood developments (good or bad) we should know about?
- What's the average days-on-market for RENTAL listings here right now (not sales)? A rising rental-DOM trend means longer vacancies and softer asking-rent achievability than the comps imply.
- What's the recent tenant-quality profile in this submarket — average credit score on applications, eviction rate, late-payment / NSF rate, and stable-employment percentage? A property-management company in the area should have these aggregated.
- How much new for-sale + rental construction is in the pipeline within 1–3 miles? Heavy new supply typically softens prices + rents 12–24 months out; constrained supply supports both.
Investment metrics
- 1% rule
- 0.75% ✗
- Cap rate
- 6.43%
- Cash-on-cash
- 0.48%
- DSCR
- 1.02
- GRM
- 11.1
CMA / ARV
- ARV (on-the-fly)
- $230,243
- Comps found
- 6
Show comp detail 6 sales within ~0.75 mi
| Address | Dist | Beds/Ba | Sqft | Sold | Price | $/sf | Match |
|---|---|---|---|---|---|---|---|
| 309 Shadyrock Path | 0.16mi | 3/2.0 | 1,162 (+0%) | 19mo | $222,000 | $191 | 74 |
| 211 Quarry Trl | 0.41mi | 3/2.0 | 1,158 (+0%) | 17mo | $231,000 | $199 | 64 |
| 202 Quarry Trl | 0.30mi | 3/2.0 | 1,300 (+12%) | 4mo | $245,500 | $189 | 60 |
| 212 Quarry Trl | 0.40mi | 3/2.0 | 1,309 (+13%) | 3mo | $264,000 | $202 | 55 |
| 871 Kinston Hwy | 0.45mi | 3/2.0 | 1,306 (+13%) | 18mo | $191,000 | $146 | 40 |
| 206 Trophy Ridge Dr | 0.64mi | 3/2.0 | 1,280 (+11%) | 23mo | $257,000 | $201 | 32 |
Match score weights: distance 35% · size 25% · config 20% · recency 20%. Top-matched comps best support the ARV.
Projected returns pro-forma
-3.0% appreciation · 3.0% rent growth · sell at horizon
- IRR
- -15.6%
- Equity multiple
- 0.44×
- Total profit
- $-34,984
- Equity at exit
- $33,548
- IRR
- -7.2%
- Equity multiple
- 0.54×
- Total profit
- $-28,901
- Equity at exit
- $19,454
Cash invested: $63,000 (down + closing). Projections, not guarantees.
Landlord ↔ Tenant lean methodology
- Overall (STATE)
- 85 Strongly Landlord-Friendly
- State North Carolina
- 85 Strongly Landlord-Friendly · R+3
- County
- — inherits STATE
- City
- — inherits STATE
ZIP-level market 28574
- Home prices YoY
- -8.9%
- Active inventory
- 200
- Price-to-rent
- 11.1×
Monthly cashflow live
- Estimated rent
- $1,697 medium interval (Pro) →
- Mortgage (P&I)
- −$1,180
- Tax from tax record
- −$42 /mo · $499/yr
- Insurance
- −$94
- HOA
- −$0
- Vacancy / Maint / Mgmt
- −$356
- Net cashflow
- $25
Break-even live
UW: 25.0% down · 7.5% · 30yr · 1.5% tax · 5.0% vac · 8.0% maint · 8.0% mgmt
Financing live
Cash to close
- Down payment
- $56,250
- Closing costs
- $6,750
- Reserves months
- —
- Total cash needed
- —
Loan-product check · same deal, 3 products live
Conventional
25% down · 7.5% · 30yr
- Down + closing
- —
- Monthly P&I
- —
- Monthly cashflow
- —
- DSCR
- —
- Eligible?
- —
Personal DTI + credit; lowest rate.
DSCR
20% down · 8.5% · 30yr
- Down + closing
- —
- Monthly P&I
- —
- Monthly cashflow
- —
- DSCR
- —
- Eligible?
- —
No personal income docs; deal must DSCR.
Hard money
10% down · 12.0% · 12mo
- Down + closing
- —
- Monthly P&I
- —
- Monthly cashflow
- —
- DSCR
- —
- Eligible?
- —
Short-term bridge; refi at stabilization.
Listing history 4 events
-
2026-05-11$225,000 Active
-
2021-05-11soldstatus $120,000
-
2009-10-19soldstatus $107,500
-
2006-10-31soldstatus $102,000
ⓘ Source: listings_history table (triggers on properties + properties_extension) + one-shot
backfill from property_details.listing_events for pre-trigger history.
Tax reassessment forecast NC · Resets to sale price
- Current annual tax
- $499 · $42/mo
- Projected year-2 tax
- $1,845 · $154/mo
- Expected delta
- +$1,346/yr (+$112/mo · 269.4%)
ⓘ Screening estimate from a state-policy table — verify with the county assessor before closing.
Climate risk First Street
- Flood 1/10 Low FEMA zone X (unshaded) · 0% chance over 30 yrs
- Wildfire 5/10 Major
- Heat 8/10 Severe 7 d/yr ≥106°F today · 18 d/yr by 30 yrs out
- Wind 8/10 Severe 80% chance of damaging wind over 30 yrs
- Air quality 2/10 Low 1 unhealthy d/yr today · 2 by 30 yrs out
Nearby sold comps map
Loading sold comps map…
Walkable amenities ~0.75 mi
Loading nearby amenities…
Taxation est. · year 1
- Rental income
- $20,360
- − Mortgage interest
- −$12,603
- − Property taxes
- −$499
- − Insurance
- −$1,125
- − Repairs & maintenance
- −$1,629
- − Management
- −$1,629
- − Depreciation
- −$6,545
- Taxable loss
- −$3,671
- Est. tax savings @ 24.0%
- +$881
- After-tax cash flow
- $1,182/yr
For passive investors: Depreciation is non-cash, so a rental often shows a tax loss while cash-flowing — sheltering income. Rental losses are passive: they offset passive income freely, and up to $25,000/yr can offset ordinary (W-2) income if you actively participate and your MAGI is under $100k (phasing out to $0 by $150k); unused losses carry forward. On sale, claimed depreciation is recaptured at up to 25%, and gains may owe capital-gains tax (a 1031 exchange can defer both). Figures are a year-1 estimate at your 24.0% rate — not tax advice; consult a CPA.
Schools (NCES district)
- District
- Onslow County Schools
- NCES district ID
- 3703450
- Math proficiency
- 42% ▲ 6.00%
- Reading proficiency
- 49% ▲ 5.00%
- Median HH income
- $46,076
- Composite
- 38.66/100
- National rank
- #4148
- State rank
- #84 of 178 in NC
Livability — Richlands
- Score
- 69/100
- State rank
- #151
- US rank
- #8426
Category grades
Schools grade is shown separately in the Schools card above.
Census & demographics
- County
- Onslow County · 164,453 people
- City population
- 20,990
- Metro
- Jacksonville, NC
- Population (ZIP)
- 20,990
- Household income
- $67,416
- Rent vs Own
- Severe rent burden
- 287.0
Population outlook (Onslow County) Hauer SSP2
- Today (2025)
- 189,789 people
- By 2030
- 194,463 · +2.5%
- By 2040
- 193,629 · +2.0%
- By 2050
- 193,248 · +1.8%
- By 2075
- 196,995 · +3.8%
- By 2100
- 201,513 · +6.2%
Race, ethnicity, and origin ACS 2023
- Neighborhood character
- Predominantly White (74%)
- Race & ethnicity
- White 74% Two or more races 13% Hispanic / Latino 8% Black 7%
- Hispanic origin (detail)
- Mexican 4% Puerto Rican 2%
- Common ancestry
- Slovak 3% Romanian 2% Lithuanian 1%
- Foreign-born
- 2% · Canada
- Languages at home
- 92% English-only · Spanish 6%
Political lean MEDSL · Onslow
- 2024 margin
- Solid R (+35.9) · D 31.5% · R 67.5% · Other 1.0%
- 2008→2024 swing
- -14.5pp toward R · 2008: -21.5pp · 2024: -35.9pp
- All cycles
- 2024: R+35.9 2020: R+30.2 2016: R+34.6 2012: R+27.0 2008: R+21.5
Not yet ingested
- Civics
- —
Market trends
- HPI YoY
- ▼ -21.07%
- Current HPI
- 215.4574
- Rent YoY
- —
- Metro
- Jacksonville, NC
- State GDP YoY
- ▲ 3.28%
- F500 in state
- 26
Industry mix (Fortune 500 HQ in NC)
| Industry | F500 HQs | Revenue |
|---|---|---|
| Financial Services | 2 | $213B |
|
||
| Retail | 2 | $95B |
|
||
| Industrial Conglomerate | 1 | $38B |
|
||
| Metals / Steel | 1 | $35B |
|
||
| Utilities | 1 | $30B |
|
||
| Industrial Machinery | 1 | $19B |
|
||
Price history
+120.6% since first listed4 events — show timeline
- 2026-05-11 Listed $225,000 Hive MLS
- 2021-05-11 Sold (Public Records) $120,000 Public Records
- 2009-10-19 Sold (Public Records) $107,500 Public Records
- 2006-10-31 Sold (Public Records) $102,000 Public Records
Property tax history
-1.7%/yrLatest (2025): $499 · +0.0% YoY. Source: county tax records.
Cash-flow waterfall
monthlySold comps — $/sqft
last 12 mo · ≤1 miLoading sold comps…