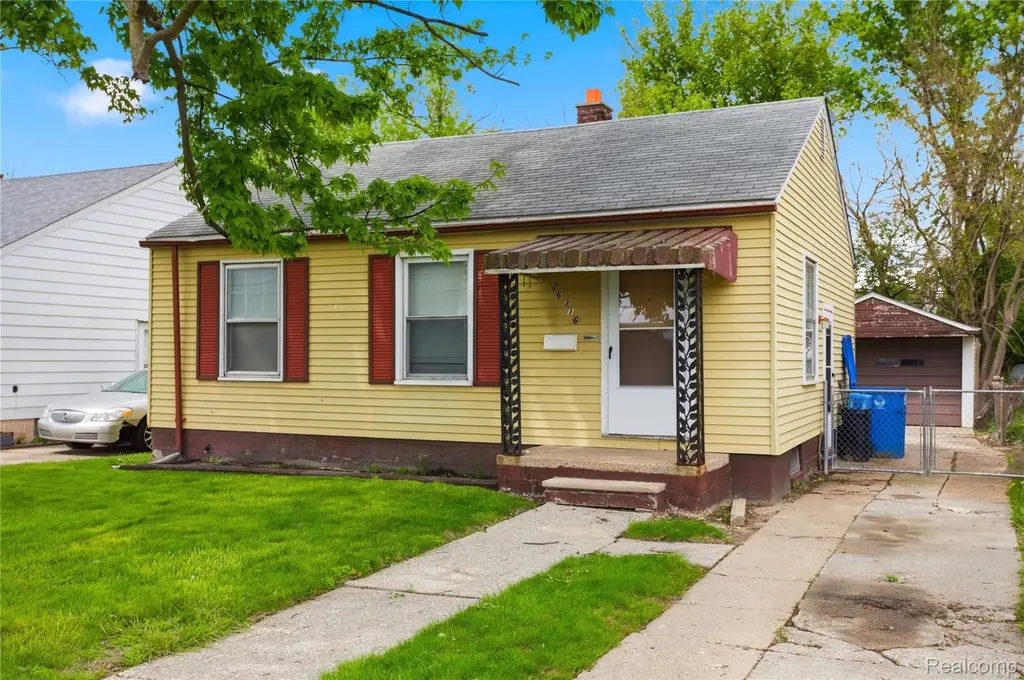
26316 Powers Ave · Dearborn Heights, MI
Flood risk 6/10 · Moderate
- FEMA flood zone
- X (unshaded)
- Chance of flooding over 30 yrs
- 0.72%
- Est. flood insurance / yr
- $473 – $860
Fire risk 1/10 · Minimal
- Est. fire insurance / yr
- $784 – $1,456
Heat risk 3/10 · Minor
- Hot days now (above 98°F)
- 7 days/yr
- Hot days in 30 yrs
- 15 days/yr
Wind risk 2/10 · Minimal
- Chance of severe wind over 30 yrs
- —
Air-quality risk 2/10 · Minimal
- Unhealthy air days now
- 1 days/yr
- Unhealthy air days in 30 yrs
- 2 days/yr
Risk factors via First Street. Map © Google.
Why this score? — see what drove the B- grade
The composite is a weighted blend of 9 inputs, each scored 0–100. Each bar is that input's sub-score; the figure is the points it added to the 100-point composite (weight × sub-score).
- Cash flow +30.0/30.0
- ARV discount +10.5/15.0
- DSCR +10.0/10.0
- 1% rule +8.8/10.0
- Livability +4.0/5.0
- Rent growth +3.0/5.0
- Condition / age +2.5/5.0
- Schools +0.7/10.0
- Appreciation +0.0/10.0
$115,000
🖨 Deal sheet 📄 Offer letter ✓ Due diligence
Listing remarks MLS
Welcome to this charming ranch home in Dearborn Heights featuring 2 bedrooms, 1 full bath, and a comfortable layout with plenty of natural light throughout. The spacious living room flows into a cozy dining area and functional kitchen with ample cabinet space and white appliances. Enjoy added comfort with central air and forced air heating. The unfinished basement offers excellent storage or future finishing potential. Outside, the fenced backyard provides space for pets, entertaining, or relaxing, along with a detached 1-car garage and patio area. Conveniently located near shopping, dining, parks, and major roadways, this home is a great opportunity for first-time buyers, downsizers, or investors alike.
Key facts
- 6,098 sq ft lot
- Garage
- Built 1944
Property features AI
Finance
- Other: Pets allowed
Exterior
- Parking: Detached 1-car garage
- Utilities: Public water; Public sewer
- Home design: Single-family residence; One story; Ground-level entry; Aluminum siding
- Construction: Aluminum siding
- Exterior features: Exterior lighting; Porch; Fenced yard; Paved road access
Interior
- Bathrooms: 1 full bathroom
- Heating & cooling: Central air conditioning; Forced air heating; Natural gas heating
- Interior features: Gas water heater; Unfinished basement; 5 total rooms; Basement present
Neighborhood map
What this means for you Summary
Snapshot
- This is a 3-bed/1.0-bath single-family listed at $115k.
Deal economics
- At list price, monthly cash flow is $492 ($6k/yr) — positive.
- The deal already cash-flows at list — no discount required.
- Meets the 1% rule at list price ($2k rent vs $115k).
- Recommended offer: $112k (3.0% below list) — sets the bar for market timing.
- Cap rate 11.4% vs local median 5.5% in Dearborn Heights — top-decile yield for the area; either an underpriced asset or a hidden risk that comps aren't pricing in. Stress-test before assuming the spread holds.
Location & tenants
- Location reads 79/100 on livability (#82 in MI, #1,885 nationally) — a middle-class / working-renter tenant base. Strengths: commute A+, cost of living A+, housing A+; Watch: schools C-, crime D+, employment D+.
- Westwood Community School District (suburban): math 6% / reading 11% proficiency, ranked #529 of 540 in MI (top 98%) — low school quality limits family demand, transient renter base, plan for 1-2y turnover; 81% free/reduced lunch — lower-income household profile, screen leases tightly.
- Market conditions: Rents rising (+2.0%/yr); 137 active listings in the ZIP; 1 comparable units currently listed for rent nearby; 2,639 units permitted in Wayne County in 2024 (1,216 in 5+ unit buildings).
- This rent runs 32% of the median local income ($60k/yr) — at the standard rent-burdened threshold; future hikes will face affordability resistance.
Forward outlook
- Local home prices are declining (-3.0%/yr); year-one equity from $795 of loan paydown is wiped out by about $3k of value loss. Plan a longer hold.
- Wayne County population projected at -17% by 2050 — secular population decline; favor cash flow + early exit over multi-decade hold.
- At projected returns (-3.0% appreciation + 2.0% rent growth), your $32k cash investment doubles in ~8 years — after that, you're playing with house money.
Negotiation context
- It's been on market 31 days — a 3% lower offer ($112k) is reasonable based on typical stale-listing flexibility.
- 2 sale attempts with the ask held roughly flat each time — persistent listings suggest the price (not the market) is what's stuck; bring a comps-based counter.
- Current owner paid $36k; list at $115k implies a 224% gain — meaningful room to come down on a strong offer.
Risks & watch-outs
- Watch-outs: built in 1944 — expect roof / HVAC / electrical / plumbing capex.
- Climate carrying-cost: major flood risk — expect insurance premiums to compound above CPI over the hold.
Questions for the listing agent
- It's been on market 31 days. Have you received any prior offers? Is the seller open to a 3% concession, seller financing, or rate buy-down credit?
- Built in 1944 — when were the roof, HVAC, electrical panel, plumbing, and water heater last replaced?
- Is there a deadline driving the sale (1031 exchange, divorce, estate, relocation)? That informs how much negotiation room exists.
- Crime grade is D in this area — have there been break-ins, vandalism, or insurance claims at this property in the last 3 years? What carrier currently insures it and at what premium?
- What's the average days-on-market for RENTAL listings here right now (not sales)? A rising rental-DOM trend means longer vacancies and softer asking-rent achievability than the comps imply.
- What's the recent tenant-quality profile in this submarket — average credit score on applications, eviction rate, late-payment / NSF rate, and stable-employment percentage? A property-management company in the area should have these aggregated.
- How much new for-sale + rental construction is in the pipeline within 1–3 miles? Heavy new supply typically softens prices + rents 12–24 months out; constrained supply supports both.
Investment metrics
- 1% rule
- 1.38% ✓
- Cap rate
- 11.42%
- Cash-on-cash
- 18.33%
- DSCR
- 1.82
- GRM
- 6.1
CMA / ARV
- ARV (on-the-fly)
- $123,192
- Comps found
- 12
Show comp detail 12 sales within ~0.75 mi
| Address | Dist | Beds/Ba | Sqft | Sold | Price | $/sf | Match |
|---|---|---|---|---|---|---|---|
| 26252 Eton Ave | 0.13mi | 2/1.0 (-1) | 696 (0%) | 8mo | $123,000 | $177 | 82 |
| 26241 Annapolis St | 0.22mi | 2/1.0 (-1) | 696 (0%) | 6mo | $54,500 | $78 | 79 |
| 26389 Annapolis St | 0.22mi | 2/1.0 (-1) | 729 (+5%) | 9mo | $126,500 | $174 | 69 |
| 6029 Fellrath St | 0.49mi | 2/1.0 (-1) | 696 (0%) | 12mo | $130,000 | $187 | 62 |
| 6019 John Daly St | 0.47mi | 2/1.0 (-1) | 721 (+4%) | 9mo | $134,000 | $186 | 60 |
| 25866 Andover St | 0.64mi | 2/1.0 (-1) | 696 (0%) | 9mo | $48,000 | $69 | 58 |
| 6178 Harold St | 0.58mi | 2/1.0 (-1) | 696 (0%) | 13mo | $136,000 | $195 | 57 |
| 6139 Hampden St | 0.54mi | 2/1.0 (-1) | 648 (-7%) | 2mo | $100,000 | $154 | 57 |
| 6325 Harold St | 0.64mi | 2/1.0 (-1) | 709 (+2%) | 13mo | $126,000 | $178 | 52 |
| 5169 Glenis St | 0.18mi | 2/1.0 (-1) | 800 (+15%) | 13mo | $70,000 | $88 | 51 |
| 5961 Mcguire St | 0.50mi | 3/1.0 | 780 (+12%) | 9mo | $139,900 | $179 | 49 |
| 6160 Mcguire St | 0.62mi | 2/1.0 (-1) | 660 (-5%) | 12mo | $89,000 | $135 | 47 |
Match score weights: distance 35% · size 25% · config 20% · recency 20%. Top-matched comps best support the ARV.
Projected returns pro-forma
-3.0% appreciation · 2.03% rent growth · sell at horizon
- IRR
- 8.9%
- Equity multiple
- 1.35×
- Total profit
- $11,156
- Equity at exit
- $17,147
- IRR
- 17.3%
- Equity multiple
- 2.36×
- Total profit
- $43,894
- Equity at exit
- $9,943
Cash invested: $32,200 (down + closing). Projections, not guarantees.
Landlord ↔ Tenant lean methodology
- Overall (STATE)
- 62 Landlord-Friendly
- State Michigan
- 62 Landlord-Friendly · EVEN
- County
- — inherits STATE
- City
- — inherits STATE
ZIP-level market 48125
- Rents YoY
- 2.0%
- Active inventory
- 137
- Price-to-rent
- 6.1×
Monthly cashflow live
- Estimated rent
- $1,581 medium interval (Pro) →
- Mortgage (P&I)
- −$603
- Tax from tax record
- −$107 /mo · $1,278/yr
- Insurance
- −$48
- HOA
- −$0
- Vacancy / Maint / Mgmt
- −$332
- Net cashflow
- $492
Break-even live
UW: 25.0% down · 7.5% · 30yr · 1.5% tax · 5.0% vac · 8.0% maint · 8.0% mgmt
Financing live
Cash to close
- Down payment
- $28,750
- Closing costs
- $3,450
- Reserves months
- —
- Total cash needed
- —
Loan-product check · same deal, 3 products live
Conventional
25% down · 7.5% · 30yr
- Down + closing
- —
- Monthly P&I
- —
- Monthly cashflow
- —
- DSCR
- —
- Eligible?
- —
Personal DTI + credit; lowest rate.
DSCR
20% down · 8.5% · 30yr
- Down + closing
- —
- Monthly P&I
- —
- Monthly cashflow
- —
- DSCR
- —
- Eligible?
- —
No personal income docs; deal must DSCR.
Hard money
10% down · 12.0% · 12mo
- Down + closing
- —
- Monthly P&I
- —
- Monthly cashflow
- —
- DSCR
- —
- Eligible?
- —
Short-term bridge; refi at stabilization.
Rent comps 1 comps
| Address | Beds | Baths | Sqft | Rent | $/sqft | DOM | Units | Dist |
|---|---|---|---|---|---|---|---|---|
| 5845 Michael St Taylor, MI | 2.0 | 1.0 | 618 | $1,325 | $2.14 | 4d | 1 | 0.76mi |
Listing history 19 events
-
2026-06-18days on market $115,000 Active 31 DOM
-
2026-06-17days on market $115,000 Active 30 DOM
-
2026-06-16days on market $115,000 Active 29 DOM
-
2026-06-15days on market $115,000 Active 28 DOM
-
2026-06-13days on market $115,000 Active 26 DOM
-
2026-06-13days on market $115,000 Active 25 DOM
-
2026-06-09days on market $115,000 Active 22 DOM
-
2026-06-08days on market $115,000 Active 21 DOM
-
2026-06-07days on market $115,000 Active 20 DOM
-
2026-06-04days on market $115,000 Active 17 DOM
-
2026-06-03days on market $115,000 Active 16 DOM
-
2026-06-02days on market $115,000 Active 15 DOM
-
2026-06-01days on market $115,000 Active 14 DOM
-
2026-05-31days on market $115,000 Active 13 DOM
-
2026-05-18status Pending 713-char remark
Show marketing remark (713 chars)
Welcome to this charming ranch home in Dearborn Heights featuring 2 bedrooms, 1 full bath, and a comfortable layout with plenty of natural light throughout. The spacious living room flows into a cozy dining area and functional kitchen with ample cabinet space and white appliances. Enjoy added comfort with central air and forced air heating. The unfinished basement offers excellent storage or future finishing potential. Outside, the fenced backyard provides space for pets, entertaining, or relaxing, along with a detached 1-car garage and patio area. Conveniently located near shopping, dining, parks, and major roadways, this home is a great opportunity for first-time buyers, downsizers, or investors alike.
-
2026-05-18status Pending
Show marketing remark (713 chars)
Welcome to this charming ranch home in Dearborn Heights featuring 2 bedrooms, 1 full bath, and a comfortable layout with plenty of natural light throughout. The spacious living room flows into a cozy dining area and functional kitchen with ample cabinet space and white appliances. Enjoy added comfort with central air and forced air heating. The unfinished basement offers excellent storage or future finishing potential. Outside, the fenced backyard provides space for pets, entertaining, or relaxing, along with a detached 1-car garage and patio area. Conveniently located near shopping, dining, parks, and major roadways, this home is a great opportunity for first-time buyers, downsizers, or investors alike.
-
2026-05-07$115,000 Active 713-char remark
Show marketing remark (713 chars)
Welcome to this charming ranch home in Dearborn Heights featuring 2 bedrooms, 1 full bath, and a comfortable layout with plenty of natural light throughout. The spacious living room flows into a cozy dining area and functional kitchen with ample cabinet space and white appliances. Enjoy added comfort with central air and forced air heating. The unfinished basement offers excellent storage or future finishing potential. Outside, the fenced backyard provides space for pets, entertaining, or relaxing, along with a detached 1-car garage and patio area. Conveniently located near shopping, dining, parks, and major roadways, this home is a great opportunity for first-time buyers, downsizers, or investors alike.
-
2026-05-07$115,000 Active
Show marketing remark (713 chars)
Welcome to this charming ranch home in Dearborn Heights featuring 2 bedrooms, 1 full bath, and a comfortable layout with plenty of natural light throughout. The spacious living room flows into a cozy dining area and functional kitchen with ample cabinet space and white appliances. Enjoy added comfort with central air and forced air heating. The unfinished basement offers excellent storage or future finishing potential. Outside, the fenced backyard provides space for pets, entertaining, or relaxing, along with a detached 1-car garage and patio area. Conveniently located near shopping, dining, parks, and major roadways, this home is a great opportunity for first-time buyers, downsizers, or investors alike.
-
1992-11-06soldstatus $35,500
ⓘ Source: listings_history table (triggers on properties + properties_extension) + one-shot
backfill from property_details.listing_events for pre-trigger history.
Tax reassessment forecast MI · Partial reset (capped growth)
- Current annual tax
- $1,278 · $107/mo
- Projected year-2 tax
- $1,525 · $127/mo
- Expected delta
- +$246/yr (+$21/mo · 19.3%)
ⓘ Screening estimate from a state-policy table — verify with the county assessor before closing.
Climate risk First Street
- Flood 6/10 Major FEMA zone X (unshaded) · 72% chance over 30 yrs
- Wildfire 1/10 Low
- Heat 3/10 Moderate 7 d/yr ≥98°F today · 15 d/yr by 30 yrs out
- Wind 2/10 Low
- Air quality 2/10 Low 1 unhealthy d/yr today · 2 by 30 yrs out
Nearby sold comps map
Loading sold comps map…
Walkable amenities ~0.75 mi
Loading nearby amenities…
Taxation est. · year 1
- Rental income
- $18,975
- − Mortgage interest
- −$6,442
- − Property taxes
- −$1,278
- − Insurance
- −$575
- − Repairs & maintenance
- −$1,518
- − Management
- −$1,518
- − Depreciation
- −$3,345
- Taxable income
- $4,299
- Est. tax owed @ 24.0%
- −$1,032
- After-tax cash flow
- $4,869/yr
For passive investors: Depreciation is non-cash, so a rental often shows a tax loss while cash-flowing — sheltering income. Rental losses are passive: they offset passive income freely, and up to $25,000/yr can offset ordinary (W-2) income if you actively participate and your MAGI is under $100k (phasing out to $0 by $150k); unused losses carry forward. On sale, claimed depreciation is recaptured at up to 25%, and gains may owe capital-gains tax (a 1031 exchange can defer both). Figures are a year-1 estimate at your 24.0% rate — not tax advice; consult a CPA.
Schools (NCES district)
- District
- Westwood Community School District
- NCES district ID
- 2611640
- Math proficiency
- 6% ▼ -6.00%
- Reading proficiency
- 11% ▼ -6.00%
- Median HH income
- $36,350
- Composite
- 7.06/100
- National rank
- #9967
- State rank
- #529 of 540 in MI
Livability — Dearborn Heights
- Score
- 79/100
- State rank
- #82
- US rank
- #1885
Category grades
Schools grade is shown separately in the Schools card above.
Census & demographics
- Census place
- Dearborn Heights, MI
- County
- Wayne County · 1,562,939 people
- City population
- 61,771
- Metro
- Detroit-Warren-Dearborn, MI
- Population (ZIP)
- 22,125
- Household income
- $60,195
- Rent vs Own
- Severe rent burden
- 654.0
Population outlook (Wayne County) Hauer SSP2
- Today (2025)
- 1,675,273 people
- By 2030
- 1,620,300 · -3.3%
- By 2040
- 1,502,341 · -10.3%
- By 2050
- 1,384,039 · -17.4%
- By 2075
- 1,124,592 · -32.9%
- By 2100
- 881,193 · -47.4%
Race, ethnicity, and origin ACS 2023
- Neighborhood character
- Predominantly White (76%)
- Race & ethnicity
- White 76% Black 10% Two or more races 9% Hispanic / Latino 9%
- Hispanic origin (detail)
- Mexican 6%
- Common ancestry
- Romanian 11% Arab 3% Slovak 2%
- Foreign-born
- 11% · Canada
- Languages at home
- 82% English-only · Arabic 13% Spanish 3% Russian/Polish/Slavic 1%
Political lean MEDSL · Wayne
- 2024 margin
- Strong D (+29.0) · D 62.7% · R 33.7% · Other 3.6%
- 2008→2024 swing
- -20.5pp toward R · 2008: 49.5pp · 2024: 29.0pp
- All cycles
- 2024: D+29.0 2020: D+38.1 2016: D+37.3 2012: D+46.9 2008: D+49.5
Not yet ingested
- Civics
- —
Market trends
- HPI YoY
- ▼ -214.70%
- Current HPI
- 218.4698
- Rent YoY
- ▲ 2.03%
- Metro
- Detroit-Warren-Dearborn, MI
- State GDP YoY
- ▲ 1.37%
- F500 in state
- 28
Industry mix (Fortune 500 HQ in MI)
| Industry | F500 HQs | Revenue |
|---|---|---|
| Automotive Parts | 3 | $48B |
|
||
| Automotive | 2 | $372B |
|
||
| Chemicals | 1 | $45B |
|
||
| Automotive Retail | 1 | $29B |
|
||
| Healthcare / Medical Devices | 1 | $23B |
|
||
| Automotive Technology | 1 | $20B |
|
||
Price history
+223.9% since first listed5 events — show timeline
- 2026-05-18 Pending — MiRealSource-MiMLS
- 2026-05-18 Pending — REALCOMP
- 2026-05-07 Listed $115,000 REALCOMP
- 2026-05-07 Listed $115,000 MiRealSource-MiMLS
- 1992-11-06 Sold (Public Records) $35,500 Public Records
Property tax history
-2.3%/yrLatest (2025): $1,278 · -32.4% YoY. Source: county tax records.
Cash-flow waterfall
monthlySold comps — $/sqft
last 12 mo · ≤1 miLoading sold comps…