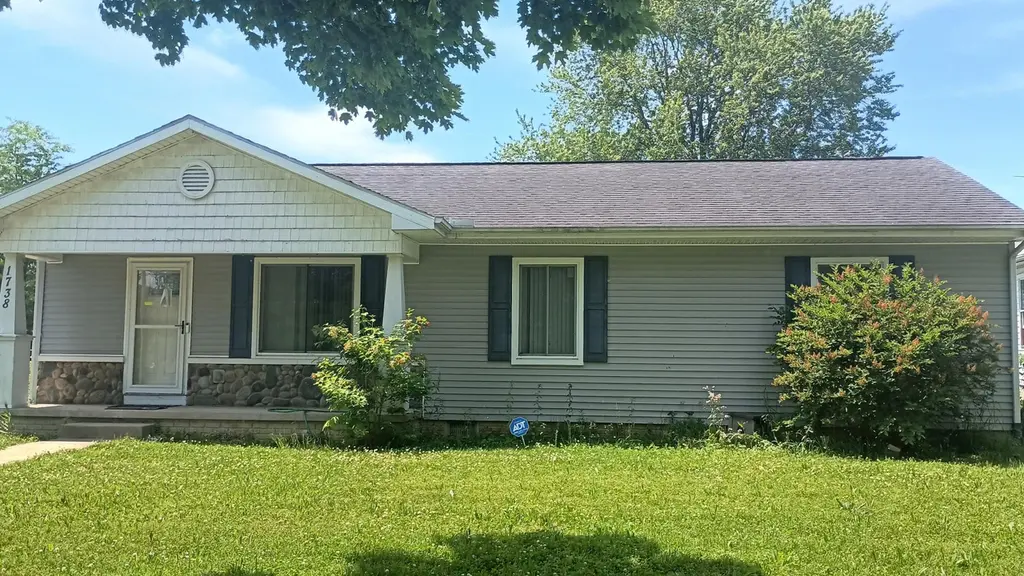
1738 Oak St · Monroe, MI
Flood risk 8/10 · Major
- FEMA flood zone
- X (unshaded)
- Chance of flooding over 30 yrs
- 0.99%
- Est. flood insurance / yr
- $507 – $1,088
Fire risk 2/10 · Minimal
- Est. fire insurance / yr
- $784 – $1,456
Heat risk 3/10 · Minor
- Hot days now (above 101°F)
- 7 days/yr
- Hot days in 30 yrs
- 15 days/yr
Wind risk 2/10 · Minimal
- Chance of severe wind over 30 yrs
- —
Air-quality risk 4/10 · Minor
- Unhealthy air days now
- 3 days/yr
- Unhealthy air days in 30 yrs
- 6 days/yr
Risk factors via First Street. Map © Google.
Why this score? — see what drove the C+ grade
The composite is a weighted blend of 9 inputs, each scored 0–100. Each bar is that input's sub-score; the figure is the points it added to the 100-point composite (weight × sub-score).
- Cash flow +27.6/30.0
- DSCR +9.7/10.0
- 1% rule +7.3/10.0
- ARV discount +5.1/15.0
- Livability +4.2/5.0
- Schools +3.0/10.0
- Rent growth +2.5/5.0
- Condition / age +2.5/5.0
- Appreciation +0.0/10.0
$119,000
🖨 Deal sheet (PDF) 📄 Offer letter ✓ Due diligence
Listing remarks MLS
A great opportunity! Three bedrooms on a corner lot a double lot! Two sheds for plenty of storage for your lawn tools. Enter into a very large dining/living room combination go into a great kitchen including appliances. Down the hall to the three great size bedrooms and the bath, perfect. As you exit the rear door you go through the first floor laundry area including the mechanicals. Today, come today.
Key facts
- Great kitchen
- Double lot
- Corner lot
Tags
Property features AI
Exterior
- Utilities: Public water; Natural gas available; Electricity available; Natural gas water heater
- Home design: Ranch-style single family home; Built in 2008
- Construction: Vinyl siding; Asphalt shingle roof
- Exterior features: Corner lot with sidewalk; Paved road
Interior
- Kitchen: Dishwasher; Range; Refrigerator; Kitchen (approx. 9 x 9)
- Bedrooms: Primary bedroom (approx. 13 x 14); Bedroom 2 (approx. 11 x 12); Bedroom 3 (approx. 10 x 13)
- Bathrooms: 1 full bathroom (approx. 7 x 9)
- Heating & cooling: Forced air heating; Has cooling
- Interior features: Total of 7 rooms; Window screens and window treatments; Crawl space basement
- Laundry & utility: Dedicated laundry room (approx. 7 x 9)
Neighborhood map
What this means for you Summary
Snapshot
- This is a 3-bed/1.0-bath single-family listed at $119k.
Deal economics
- At list price, monthly cash flow is $288 ($3k/yr) — positive.
- The deal already cash-flows at list — no discount required.
- Meets the 1% rule at list price ($1k rent vs $119k).
- Recommended offer: $117k (1.5% below list) — sets the bar for market timing.
- Cap rate 9.9% vs local median 4.0% in Monroe — top-decile yield for the area; either an underpriced asset or a hidden risk that comps aren't pricing in. Stress-test before assuming the spread holds.
Location & tenants
- Location reads 83/100 on livability (#51 in MI, #1,034 nationally) — a professional / high-income tenant draw. Strengths: commute A+, cost of living A+, housing A+; Watch: employment C-, crime D+, amenities D+.
- Monroe Public Schools (suburban): math 24% / reading 47% proficiency, ranked #278 of 540 in MI (top 52%) — families likely to look elsewhere, expect single-tenant / working-renter base with shorter leases.
- Market conditions: 152 active listings in the ZIP; 1 comparable units currently listed for rent nearby; 264 units permitted in Monroe County in 2024 (40 in 5+ unit buildings).
Forward outlook
- Local home prices are declining (-3.0%/yr); year-one equity from $823 of loan paydown is wiped out by about $4k of value loss. Plan a longer hold.
- Monroe County population projected at -20% by 2050 — secular population decline; favor cash flow + early exit over multi-decade hold.
Negotiation context
- It's been on market 15 days — a 2% lower offer ($117k) is reasonable based on typical stale-listing flexibility.
- 11 sale attempts since 8y ago with the ask held roughly flat each time — persistent listings suggest the price (not the market) is what's stuck; bring a comps-based counter.
Risks & watch-outs
- Watch-outs: flood insurance adds $66/mo.
- Climate carrying-cost: severe flood risk — expect insurance premiums to compound above CPI over the hold.
Questions for the listing agent
- What's the actual annual flood-insurance premium (NFIP or private), and is the property in a SFHA with mandatory coverage?
- Is there a deadline driving the sale (1031 exchange, divorce, estate, relocation)? That informs how much negotiation room exists.
- Schools are D-rated, which usually means shorter tenancies and higher turnover. Who's the typical renter profile here, and what's been the actual vacancy rate?
- Crime grade is D in this area — have there been break-ins, vandalism, or insurance claims at this property in the last 3 years? What carrier currently insures it and at what premium?
- What's the average days-on-market for RENTAL listings here right now (not sales)? A rising rental-DOM trend means longer vacancies and softer asking-rent achievability than the comps imply.
- What's the recent tenant-quality profile in this submarket — average credit score on applications, eviction rate, late-payment / NSF rate, and stable-employment percentage? A property-management company in the area should have these aggregated.
- How much new for-sale + rental construction is in the pipeline within 1–3 miles? Heavy new supply typically softens prices + rents 12–24 months out; constrained supply supports both.
Investment metrics
- 1% rule
- 1.23% ✓
- Cap rate
- 9.86%
- Cash-on-cash
- 12.75%
- DSCR
- 1.57
- GRM
- 6.7
CMA / ARV
- ARV (on-the-fly)
- $112,992
- Comps found
- 7
Show comp detail 7 sales within ~0.75 mi
| Address | Dist | Beds/Ba | Sqft | Sold | Price | $/sf | Match |
|---|---|---|---|---|---|---|---|
| 1738 Oak St | 0.00mi | 3/1.0 | 1,284 (0%) | 24mo | $160,000 | $125 | 80 |
| 615 Conant Ave | 0.29mi | 3/1.0 | 1,248 (-3%) | 11mo | $165,000 | $132 | 73 |
| 1775 Oak St | 0.05mi | 3/1.0 | 1,092 (-15%) | 10mo | $76,000 | $70 | 64 |
| 529 Almyra Ave | 0.33mi | 4/1.0 (+1) | 1,184 (-8%) | 13mo | $104,000 | $88 | 56 |
| 1309 Wood St | 0.34mi | 2/1.0 (-1) | 1,159 (-10%) | 9mo | $95,000 | $82 | 55 |
| 1131 Franklin St | 0.58mi | 3/1.5 | 1,202 (-6%) | 16mo | $115,000 | $96 | 47 |
| 217 Winchester St | 0.55mi | 4/1.5 (+1) | 1,476 (+15%) | 14mo | $35,000 | $24 | 30 |
Match score weights: distance 35% · size 25% · config 20% · recency 20%. Top-matched comps best support the ARV.
Projected returns pro-forma
-3.0% appreciation · 3.0% rent growth · sell at horizon
- IRR
- -0.7%
- Equity multiple
- 0.97×
- Total profit
- $-909
- Equity at exit
- $17,743
- IRR
- 9.0%
- Equity multiple
- 1.69×
- Total profit
- $23,017
- Equity at exit
- $10,289
Cash invested: $33,320 (down + closing). Projections, not guarantees.
Landlord ↔ Tenant lean methodology
- Overall (STATE)
- 62 Landlord-Friendly
- State Michigan
- 62 Landlord-Friendly · EVEN
- County
- — inherits STATE
- City
- — inherits STATE
ZIP-level market 48161
- Active inventory
- 152
- Price-to-rent
- 6.7×
Monthly cashflow live
- Estimated rent
- $1,469 medium interval (Pro) →
- Mortgage (P&I)
- −$624
- Tax from tax record
- −$133 /mo · $1,595/yr
- Insurance
- −$50
- Flood insurance flood zone
- −$66 /mo · $798/yr
- HOA
- −$0
- Vacancy / Maint / Mgmt
- −$309
- Net cashflow
- $288
Break-even live
Sensitivity live
| Price | -10% $355 | -5% $321 | +0% $288 | +5% $254 | +10% $220 |
|---|---|---|---|---|---|
| Rent | -10% $172 | -5% $230 | +0% $288 | +5% $346 | +10% $404 |
| Rate | -1.0pp $348 | -0.5pp $318 | base $288 | +0.5pp $257 | +1.0pp $225 |
UW: 25.0% down · 7.5% · 30yr · 1.5% tax · 5.0% vac · 8.0% maint · 8.0% mgmt
Financing live
Cash to close
- Down payment
- $29,750
- Closing costs
- $3,570
- Reserves months
- —
- Total cash needed
- —
Loan-product check · same deal, 3 products live
Conventional
25% down · 7.5% · 30yr
- Down + closing
- —
- Monthly P&I
- —
- Monthly cashflow
- —
- DSCR
- —
- Eligible?
- —
Personal DTI + credit; lowest rate.
DSCR
20% down · 8.5% · 30yr
- Down + closing
- —
- Monthly P&I
- —
- Monthly cashflow
- —
- DSCR
- —
- Eligible?
- —
No personal income docs; deal must DSCR.
Hard money
10% down · 12.0% · 12mo
- Down + closing
- —
- Monthly P&I
- —
- Monthly cashflow
- —
- DSCR
- —
- Eligible?
- —
Short-term bridge; refi at stabilization.
Rent comps 1 comps
| Address | Beds | Baths | Sqft | Rent | $/sqft | DOM | Units | Dist |
|---|---|---|---|---|---|---|---|---|
| 505 Harrison St Monroe, MI | 3.0 | 2.0 | 1188 | $1,600 | $1.35 | 45d | 1 | 1.47mi |
Listing history 12 events
-
2026-06-21days on market $119,000 Active 15 DOM
-
2026-06-19days on market $119,000 Active 13 DOM
-
2026-06-18days on market $119,000 Active 12 DOM
-
2026-06-17days on market $119,000 Active 11 DOM
-
2026-06-16days on market $119,000 Active 10 DOM
-
2026-06-15days on market $119,000 Active 9 DOM
-
2026-06-14days on market $119,000 Active 7 DOM
-
2026-06-12days on market $119,000 Active 6 DOM
-
2026-06-09days on market $119,000 Active 3 DOM
-
2026-06-08days on market $119,000 Active 2 DOM
-
2026-06-07remarks 405-char remark
-
2026-06-07$119,000 Active 1 DOM
ⓘ Source: listings_history table (triggers on properties + properties_extension) + one-shot
backfill from property_details.listing_events for pre-trigger history.
Tax reassessment forecast MI · Partial reset (capped growth)
- Current annual tax
- $1,595 · $133/mo
- Projected year-2 tax
- $1,714 · $143/mo
- Expected delta
- +$119/yr (+$10/mo · 7.5%)
ⓘ Screening estimate from a state-policy table — verify with the county assessor before closing.
Climate risk First Street
- Flood 8/10 Severe FEMA zone X (unshaded) · 99% chance over 30 yrs
- Wildfire 2/10 Low
- Heat 3/10 Moderate 7 d/yr ≥101°F today · 15 d/yr by 30 yrs out
- Wind 2/10 Low
- Air quality 4/10 Moderate 3 unhealthy d/yr today · 6 by 30 yrs out
Nearby sold comps map
Loading sold comps map…
Walkable amenities ~0.75 mi
Loading nearby amenities…
Taxation est. · year 1
- Rental income
- $17,630
- − Mortgage interest
- −$6,666
- − Property taxes
- −$1,595
- − Insurance
- −$1,392
- − Repairs & maintenance
- −$1,410
- − Management
- −$1,410
- − Depreciation
- −$3,462
- Taxable income
- $1,694
- Est. tax owed @ 24.0%
- −$407
- After-tax cash flow
- $3,045/yr
For passive investors: Depreciation is non-cash, so a rental often shows a tax loss while cash-flowing — sheltering income. Rental losses are passive: they offset passive income freely, and up to $25,000/yr can offset ordinary (W-2) income if you actively participate and your MAGI is under $100k (phasing out to $0 by $150k); unused losses carry forward. On sale, claimed depreciation is recaptured at up to 25%, and gains may owe capital-gains tax (a 1031 exchange can defer both). Figures are a year-1 estimate at your 24.0% rate — not tax advice; consult a CPA.
Schools (NCES district)
- District
- Monroe Public Schools
- NCES district ID
- 2624150
- Math proficiency
- 24% ▲ 3.00%
- Reading proficiency
- 47% ▲ 12.00%
- Median HH income
- $46,437
- Composite
- 30.33/100
- National rank
- #6269
- State rank
- #278 of 540 in MI
Livability — Monroe
- Score
- 83/100
- State rank
- #51
- US rank
- #1034
Category grades
Schools grade is shown separately in the Schools card above.
Census & demographics
- Census place
- Monroe, MI
- County
- Monroe County · 54,460 people
- City population
- 54,460
- Metro
- Monroe, MI
- Population (ZIP)
- 26,304
- Household income
- $67,414
- Rent vs Own
- Severe rent burden
- 733.0
Population outlook (Monroe County) Hauer SSP2
- Today (2025)
- 144,439 people
- By 2030
- 140,033 · -3.1%
- By 2040
- 128,408 · -11.1%
- By 2050
- 115,024 · -20.4%
- By 2075
- 87,273 · -39.6%
- By 2100
- 63,110 · -56.3%
Race, ethnicity, and origin ACS 2023
- Neighborhood character
- Predominantly White (85%)
- Race & ethnicity
- White 85% Two or more races 7% Black 5% Hispanic / Latino 5%
- Common ancestry
- Lithuanian 10% Romanian 8% Italian 2%
- Foreign-born
- 3% · Canada, Jamaica
- Languages at home
- 96% English-only · Spanish 2% Other Indo-European 1% Arabic 1%
Political lean MEDSL · Monroe
- 2024 margin
- Strong R (+27.1) · D 35.7% · R 62.9% · Other 1.4%
- 2008→2024 swing
- -31.5pp toward R · 2008: 4.3pp · 2024: -27.1pp
- All cycles
- 2024: R+27.1 2020: R+22.6 2016: R+22.1 2012: D+1.0 2008: D+4.3
Not yet ingested
- Civics
- —
Market trends
- HPI YoY
- ▼ -178.99%
- Current HPI
- 126.2638
- Rent YoY
- —
- Metro
- Monroe, MI
- State GDP YoY
- ▲ 1.37%
- F500 in state
- 28
Industry mix (Fortune 500 HQ in MI)
| Industry | F500 HQs | Revenue |
|---|---|---|
| Automotive Parts | 3 | $48B |
|
||
| Automotive | 2 | $372B |
|
||
| Chemicals | 1 | $45B |
|
||
| Automotive Retail | 1 | $29B |
|
||
| Healthcare / Medical Devices | 1 | $23B |
|
||
| Automotive Technology | 1 | $20B |
|
||
Price history
+48.9% since first listed26 events — show timeline
- 2026-06-05 Listed $119,000 SW Michigan MLS
- 2026-06-05 Listed $119,000 REALCOMP
- 2026-06-05 Listed $119,000 MiRealSource-MiMLS
- 2024-07-18 Sold (Public Records) $160,000 Public Records
- 2024-06-27 Sold (MLS) $160,000 MiRealSource-MiMLS
- 2024-06-27 Sold (MLS) $160,000 REALCOMP
- 2024-05-20 Pending — REALCOMP
- 2024-05-20 Pending — MiRealSource-MiMLS
- 2024-05-13 Listed $150,000 MiRealSource-MiMLS
- 2024-05-13 Listed $150,000 REALCOMP
- 2019-10-11 Sold (MLS) $85,000 MiRealSource-MiMLS
- 2019-10-11 Sold (MLS) $85,000 REALCOMP
- 2019-08-28 Pending — REALCOMP
- 2019-08-28 Pending — MiRealSource-MiMLS
- 2019-08-05 Listed $89,900 MiRealSource-MiMLS
- 2019-08-05 Listed $89,900 REALCOMP
- 2019-04-01 Listing Removed — REALCOMP
- 2019-04-01 Listing Removed — MiRealSource-MiMLS
- 2019-03-08 Relisted — REALCOMP
- 2019-03-06 Relisted — MiRealSource-MiMLS
- 2019-01-03 Pending — MiRealSource-MiMLS
- 2019-01-03 Listing Removed — REALCOMP
- 2018-12-29 Price Changed $79,900 MiRealSource-MiMLS
- 2018-09-13 Price Changed $89,900 MiRealSource-MiMLS
- 2018-08-08 Listed $99,000 MiRealSource-MiMLS
- 2018-08-08 Listed $79,900 REALCOMP
Property tax history
+9.3%/yrLatest (2025): $1,595 · +3.7% YoY. Source: county tax records.
Cash-flow waterfall
monthlySold comps — $/sqft
last 12 mo · ≤1 miLoading sold comps…