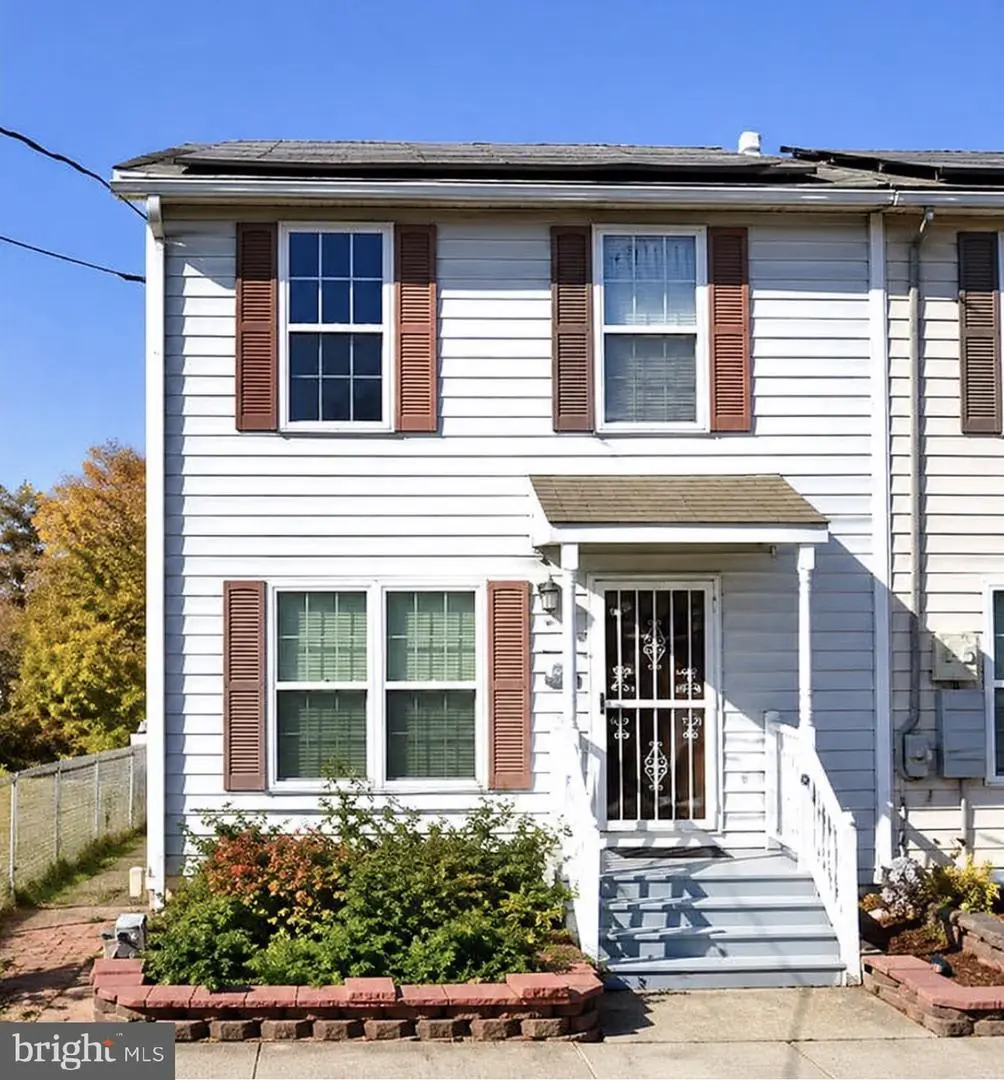
1550 E State St · Hamilton, NJ
Flood risk 7/10 · Major
- FEMA flood zone
- X (unshaded)
- Chance of flooding over 30 yrs
- 0.77%
- Est. flood insurance / yr
- $507 – $1,088
Fire risk 1/10 · Minimal
- Est. fire insurance / yr
- $526 – $976
Heat risk 6/10 · Moderate
- Hot days now (above 102°F)
- 7 days/yr
- Hot days in 30 yrs
- 15 days/yr
Wind risk 6/10 · Moderate
- Chance of severe wind over 30 yrs
- 27.0%
Air-quality risk 5/10 · Moderate
- Unhealthy air days now
- 6 days/yr
- Unhealthy air days in 30 yrs
- 8 days/yr
Risk factors via First Street. Map © Google.
Why this score? — see what drove the B grade
The composite is a weighted blend of 9 inputs, each scored 0–100. Each bar is that input's sub-score; the figure is the points it added to the 100-point composite (weight × sub-score).
- Cash flow +29.4/30.0
- ARV discount +15.0/15.0
- DSCR +10.0/10.0
- 1% rule +7.7/10.0
- Schools +2.7/10.0
- Rent growth +2.5/5.0
- Livability +2.5/5.0
- Condition / age +2.5/5.0
- Appreciation +0.0/10.0
$195,000
🖨 Deal sheet 📄 Offer letter ✓ Due diligence
Listing remarks
Discover the potential at 1550 E. State Street! This property was built in the late 1990's and is a wonderful opportunity for an owner occupant or investor. While it has modern construction and mechanics, it needs cosmetic updates and exterior repairs, making it a promising project. Strategically located in Hamilton, this property offers easy access to public transportation, grocery stores, and local businesses. . As you enter the home, you’ll find a spacious living area filled with light. .. .Just one of the amazing benefits of being the end unit. With some updates, this space can be transformed into a cozy gathering area. The kitchen layout provides ample cabinetry, and stainless st
Key facts
- Built 1998
- Listed 10 days
Property features AI
Exterior
- Parking: Off-street parking; On-street parking
- Utilities: Public water; Public sewer
- Home design: End of row townhouse; Fee simple ownership; Finished above-grade area per assessor
- Construction: Built (year source: Assessor); Block and vinyl siding construction; Other type foundation; Other structures above and below grade
- Exterior features: Lot dimensions approximately 23.00 x 140.00; No tidal water
Interior
- Kitchen: Kitchen included (appliance details not provided)
- Bedrooms: Three bedrooms on the first upper level
- Bathrooms: One full bathroom (all upper levels); One half bathroom on the main level
- Heating & cooling: Forced air heating; Central air conditioning; Electric cooling
- Interior features: Living room; Dining room; Kitchen; No basement
Neighborhood map
What this means for you Summary
Snapshot
- This is a 3-bed/1.5-bath townhouse listed at $195k.
Deal economics
- At list price, monthly cash flow is $627 ($8k/yr) — positive.
- The deal already cash-flows at list — no discount required.
- Meets the 1% rule at list price ($2k rent vs $195k).
Location & tenants
- Location reads: area grade B — affects rentability + tenant quality, not the cash-flow math above.
- Hamilton Township Public School District (suburban): math 17% / reading 41% proficiency, ranked #338 of 472 in NJ (top 72%) — low school quality limits family demand, transient renter base, plan for 1-2y turnover.
- Market conditions: 33 active listings in the ZIP; 27 comparable units currently listed for rent nearby; rentals at typical pace (median 21d on market — plan ~3-4 weeks tenant-placement turnaround); 2,256 units permitted in Mercer County in 2024 (1,303 in 5+ unit buildings).
- This rent runs 43% of the median local income ($68k/yr) — at the standard rent-burdened threshold; future hikes will face affordability resistance.
Forward outlook
- Local home prices are declining (-3.0%/yr); year-one equity from $1k of loan paydown is wiped out by about $6k of value loss. Plan a longer hold.
- Mercer County population projected at +4% by 2050 — modest demand growth; plan on rents tracking national, not racing it.
- At projected returns (-3.0% appreciation + 3.0% rent growth), your $55k cash investment doubles in ~9 years — after that, you're playing with house money.
Negotiation context
- Only 10 days on market — expect competitive offers; lowballing is unlikely to land.
- Current owner paid $64k; list at $195k implies a 206% gain — meaningful room to come down on a strong offer.
Risks & watch-outs
- Watch-outs: flood insurance adds $66/mo.
- Climate carrying-cost: major flood risk; major wind risk, 27% chance of damaging wind over 30y; extreme-heat days projected 7→15/yr by 2055 (HVAC capex compounding) — expect insurance premiums to compound above CPI over the hold.
Questions for the listing agent
- What's the actual annual flood-insurance premium (NFIP or private), and is the property in a SFHA with mandatory coverage?
- Is there a deadline driving the sale (1031 exchange, divorce, estate, relocation)? That informs how much negotiation room exists.
- What's the average days-on-market for RENTAL listings here right now (not sales)? A rising rental-DOM trend means longer vacancies and softer asking-rent achievability than the comps imply.
- What's the recent tenant-quality profile in this submarket — average credit score on applications, eviction rate, late-payment / NSF rate, and stable-employment percentage? A property-management company in the area should have these aggregated.
- How much new for-sale + rental construction is in the pipeline within 1–3 miles? Heavy new supply typically softens prices + rents 12–24 months out; constrained supply supports both.
Investment metrics
- 1% rule
- 1.27% ✓
- Cap rate
- 10.56%
- Cash-on-cash
- 15.23%
- DSCR
- 1.68
- GRM
- 6.6
CMA / ARV
- ARV (on-the-fly)
- $234,240
- Comps found
- 12
Show comp detail 12 sales within ~0.75 mi
| Address | Dist | Beds/Ba | Sqft | Sold | Price | $/sf | Match |
|---|---|---|---|---|---|---|---|
| 277 Norway Ave | 0.25mi | 3/1.5 | 1,240 (-3%) | 0mo | $330,000 | $266 | 83 |
| 1109 Nottingham Way | 0.11mi | 3/1.0 | 1,198 (-6%) | 2mo | $230,000 | $192 | 81 |
| 116 Cleveland Ave | 0.41mi | 3/1.0 | 1,284 (+0%) | 4mo | $215,000 | $167 | 75 |
| 233 Park Ln | 0.25mi | 3/2.0 | 1,376 (+8%) | 1mo | $299,000 | $217 | 73 |
| 403 Klag | 0.54mi | 3/1.0 | 1,296 (+1%) | 1mo | $219,900 | $170 | 70 |
| 50 Mechanics Ave | 0.48mi | 3/1.0 | 1,200 (-6%) | 1mo | $117,500 | $98 | 64 |
| 1267 Nottingham Way | 0.22mi | 4/1.0 (+1) | 1,102 (-14%) | 3mo | $202,000 | $183 | 57 |
| 55 S Olden Ave | 0.54mi | 3/2.0 | 1,410 (+10%) | 0mo | $265,000 | $188 | 56 |
| 235 Darcy Ave | 0.70mi | 4/2.0 (+1) | 1,290 (+1%) | 6mo | $380,000 | $295 | 54 |
| 321 Cleveland Ave | 0.57mi | 4/1.0 (+1) | 1,391 (+9%) | 2mo | $233,000 | $168 | 50 |
| 30 Mechanics Ave | 0.49mi | 3/1.5 | 1,092 (-15%) | 5mo | $103,200 | $95 | 48 |
| 251 S Walter Ave | 0.69mi | 3/1.5 | 1,152 (-10%) | 7mo | $143,000 | $124 | 45 |
Match score weights: distance 35% · size 25% · config 20% · recency 20%. Top-matched comps best support the ARV.
Projected returns pro-forma
-3.0% appreciation · 3.0% rent growth · sell at horizon
- IRR
- 4.0%
- Equity multiple
- 1.15×
- Total profit
- $8,343
- Equity at exit
- $29,075
- IRR
- 13.5%
- Equity multiple
- 2.08×
- Total profit
- $58,764
- Equity at exit
- $16,860
Cash invested: $54,600 (down + closing). Projections, not guarantees.
Landlord ↔ Tenant lean methodology
- Overall (STATE)
- 21 Tenant-Leaning
- State New Jersey
- 21 Tenant-Leaning · D+6
- County
- — inherits STATE
- City
- — inherits STATE
ZIP-level market 08609
- Home prices YoY
- -29.3%
- Active inventory
- 33
- Price-to-rent
- 6.6×
Monthly cashflow live
- Estimated rent
- $2,473 high interval (Pro) →
- Mortgage (P&I)
- −$1,023
- Tax from tax record
- −$157 /mo · $1,884/yr
- Insurance
- −$81
- Flood insurance flood zone
- −$66 /mo · $798/yr
- HOA
- −$0
- Vacancy / Maint / Mgmt
- −$519
- Net cashflow
- $627
Break-even live
UW: 25.0% down · 7.5% · 30yr · 1.5% tax · 5.0% vac · 8.0% maint · 8.0% mgmt
Financing live
Cash to close
- Down payment
- $48,750
- Closing costs
- $5,850
- Reserves months
- —
- Total cash needed
- —
Loan-product check · same deal, 3 products live
Conventional
25% down · 7.5% · 30yr
- Down + closing
- —
- Monthly P&I
- —
- Monthly cashflow
- —
- DSCR
- —
- Eligible?
- —
Personal DTI + credit; lowest rate.
DSCR
20% down · 8.5% · 30yr
- Down + closing
- —
- Monthly P&I
- —
- Monthly cashflow
- —
- DSCR
- —
- Eligible?
- —
No personal income docs; deal must DSCR.
Hard money
10% down · 12.0% · 12mo
- Down + closing
- —
- Monthly P&I
- —
- Monthly cashflow
- —
- DSCR
- —
- Eligible?
- —
Short-term bridge; refi at stabilization.
Rent comps 27 comps
| Address | Beds | Baths | Sqft | Rent | $/sqft | DOM | Units | Dist |
|---|---|---|---|---|---|---|---|---|
| 21 Adella Ave Trenton, NJ | 3.0 | 1.0 | 1280 | $2,000 | $1.56 | 14d | 1 | 0.26mi |
| 25 Adella Ave Trenton, NJ | 3.0 | 1.0 | 1280 | $2,050 | $1.60 | 14d | 1 | 0.26mi |
| 255 Hollywood Dr Trenton, NJ | 4.0 | 1.0 | 1650 | $2,950 | $1.79 | 21d | 1 | 0.32mi |
| 8 Joan Ter Trenton, NJ | 3.0 | 2.0 | 1397 | $3,250 | $2.33 | 21d | 1 | 0.34mi |
| 219 Woodlawn Ave Trenton, NJ | 3.0 | 1.0 | 1456 | $2,355 | $1.62 | 14d | 1 | 0.38mi |
| 340 Connecticut Ave Unit 2 Hamilton Township, NJ | 3.0 | 1.0 | 1400 | $2,850 | $2.04 | 14d | 1 | 0.40mi |
| 340 Connecticut Ave Unit 1 Hamilton Township, NJ | 2.0 | 1.0 | 1000 | $2,500 | $2.50 | 14d | 1 | 0.40mi |
| 416 Klagg Ave Trenton, NJ | 3.0 | 1.0 | 1034 | $2,300 | $2.22 | 21d | 1 | 0.52mi |
| 1165 E State St Trenton, NJ | 3.0 | 1.0 | 900 | $1,749 | $1.94 | 14d | 1 | 0.56mi |
| 428 Cleveland Ave Trenton, NJ | 4.0 | 2.0 | 1400 | $2,500 | $1.79 | 21d | 1 | 0.68mi |
| 417 Walnut Ave Trenton, NJ | 3.0 | 1.0 | 992 | $2,050 | $2.07 | 21d | 1 | 0.76mi |
| 239 Ardmore Ave Trenton, NJ | 4.0 | 2.0 | 1665 | $2,750 | $1.65 | 21d | 1 | 0.81mi |
| 1040 Indiana Ave Trenton, NJ | 3.0 | 1.0 | 1232 | $2,950 | $2.39 | 14d | 1 | 0.92mi |
| 234 Walnut Ave Trenton, NJ | 4.0 | 1.0 | 1480 | $2,200 | $1.49 | 21d | 1 | 0.98mi |
| 901 Brunswick Ave #7 Trenton, NJ | 3.0 | 1.0 | 940 | $2,800 | $2.98 | 14d | 1 | 1.08mi |
| 210 Kuser Rd Trenton, NJ | 3.0 | 1.5 | 1360 | $2,700 | $1.99 | 21d | 1 | 1.10mi |
| 42 Grant St Trenton, NJ | 4.0 | 1.0 | 1000 | $2,000 | $2.00 | 14d | 1 | 1.11mi |
| 331 Ellis Ave Trenton, NJ | 3.0 | 1.0 | 1190 | $2,275 | $1.91 | 21d | 1 | 1.12mi |
| 121 Columbus Ave Trenton, NJ | 3.0 | 1.0 | 1050 | $1,900 | $1.81 | 21d | 1 | 1.15mi |
| 105 Walnut Ave Unit 1 Trenton, NJ | 2.0 | 1.0 | 1200 | $2,000 | $1.67 | 21d | 1 | 1.17mi |
| 635 Chambers St Trenton, NJ | 4.0 | 2.0 | 1312 | $2,500 | $1.91 | 14d | 1 | 1.22mi |
| 1314 Princeton Ave Trenton, NJ | 4.0 | 1.0 | 1092 | $2,400 | $2.20 | 14d | 1 | 1.25mi |
| 720 Monmouth St Unit 204 Trenton, NJ | 2.0 | 1.0 | 1011 | $1,750 | $1.73 | 21d | 1 | 1.26mi |
| 756 Cherry Tree Ln Lawrence Township, NJ | 2.0 | 1.0 | 1207 | $2,200 | $1.82 | 14d | 1 | 1.26mi |
| 973 S Olden Ave Unit 2ND FLOOR Trenton, NJ | 2.0 | 1.0 | 1664 | $1,850 | $1.11 | 21d | 1 | 1.31mi |
| 77 Race St Trenton, NJ | 2.0 | 1.0 | 950 | $1,700 | $1.79 | 21d | 1 | 1.34mi |
| 34 Southard St #2 Trenton, NJ | 2.0 | 2.0 | 1808 | $2,150 | $1.19 | 21d | 1 | 1.37mi |
Listing history 9 events
-
2026-06-18days on market $195,000 Coming Soon 10 DOM
-
2026-06-17days on market $195,000 Coming Soon 9 DOM
-
2026-06-16days on market $195,000 Coming Soon 8 DOM
-
2026-06-15days on market $195,000 Coming Soon 7 DOM
-
2026-06-14days on market $195,000 Coming Soon 5 DOM
-
2026-06-13days on market $195,000 Coming Soon 4 DOM
-
2026-06-10days on market $195,000 Coming Soon 2 DOM
-
2026-06-09remarks 693-char remark
-
2026-06-09$195,000 Coming Soon 1 DOM
ⓘ Source: listings_history table (triggers on properties + properties_extension) + one-shot
backfill from property_details.listing_events for pre-trigger history.
Tax reassessment forecast NJ · Partial reset (capped growth)
- Current annual tax
- $1,884 · $157/mo
- Projected year-2 tax
- $3,370 · $281/mo
- Expected delta
- +$1,486/yr (+$124/mo · 78.9%)
ⓘ Screening estimate from a state-policy table — verify with the county assessor before closing.
Climate risk First Street
- Flood 7/10 Severe FEMA zone X (unshaded) · 77% chance over 30 yrs
- Wildfire 1/10 Low
- Heat 6/10 Major 7 d/yr ≥102°F today · 15 d/yr by 30 yrs out
- Wind 6/10 Major 27% chance of damaging wind over 30 yrs
- Air quality 5/10 Major 6 unhealthy d/yr today · 8 by 30 yrs out
Nearby sold comps map
Loading sold comps map…
Walkable amenities ~0.75 mi
Loading nearby amenities…
Taxation est. · year 1
- Rental income
- $29,681
- − Mortgage interest
- −$10,923
- − Property taxes
- −$1,884
- − Insurance
- −$1,772
- − Repairs & maintenance
- −$2,374
- − Management
- −$2,374
- − Depreciation
- −$5,673
- Taxable income
- $4,680
- Est. tax owed @ 24.0%
- −$1,123
- After-tax cash flow
- $6,397/yr
For passive investors: Depreciation is non-cash, so a rental often shows a tax loss while cash-flowing — sheltering income. Rental losses are passive: they offset passive income freely, and up to $25,000/yr can offset ordinary (W-2) income if you actively participate and your MAGI is under $100k (phasing out to $0 by $150k); unused losses carry forward. On sale, claimed depreciation is recaptured at up to 25%, and gains may owe capital-gains tax (a 1031 exchange can defer both). Figures are a year-1 estimate at your 24.0% rate — not tax advice; consult a CPA.
Schools (NCES district)
- District
- Hamilton Township Public School District
- NCES district ID
- 3406540
- Math proficiency
- 17% ▼ -15.00%
- Reading proficiency
- 41% ▼ -4.00%
- Median HH income
- $71,425
- Composite
- 27.33/100
- National rank
- #6990
- State rank
- #338 of 472 in NJ
Livability — Hamilton
No livability data for this city. (Only ~50 U.S. cities are tracked.)
Census & demographics
- County
- Mercer County · 327,655 people
- Metro
- Trenton-Princeton, NJ
- Population (ZIP)
- 15,938
- Household income
- $68,238
- Rent vs Own
- Severe rent burden
- 930.0
Population outlook (Mercer County) Hauer SSP2
- Today (2025)
- 381,395 people
- By 2030
- 384,640 · +0.9%
- By 2040
- 391,431 · +2.6%
- By 2050
- 397,845 · +4.3%
- By 2075
- 417,281 · +9.4%
- By 2100
- 420,327 · +10.2%
Race, ethnicity, and origin ACS 2023
- Neighborhood character
- Diverse neighborhood (Simpson 0.61)
- Race & ethnicity
- Hispanic / Latino 45% Black 43% Two or more races 12% White 8% Asian 1%
- Hispanic origin (detail)
- Mexican 3% Puerto Rican 9% Dominican 11%
- Common ancestry
- Hispanic 5% Swiss 2% Estonian 1%
- Foreign-born
- 32% · Canada, Guatemala, China
- Languages at home
- 51% English-only · Spanish 41% French/Haitian/Cajun 2% Other Indo-European 2%
Political lean MEDSL · Mercer
- 2024 margin
- Solid D (+33.9) · D 65.9% · R 32.0% · Other 2.1%
- 2008→2024 swing
- -2.2pp toward R · 2008: 36.1pp · 2024: 33.9pp
- All cycles
- 2024: D+33.9 2020: D+40.0 2016: D+36.2 2012: D+36.8 2008: D+36.1
Not yet ingested
- Civics
- —
Market trends
- HPI YoY
- ▼ -114.12%
- Current HPI
- 275.8566
- Rent YoY
- —
- Metro
- Trenton-Princeton, NJ
- State GDP YoY
- ▲ 2.05%
- F500 in state
- 34
Industry mix (Fortune 500 HQ in NJ)
| Industry | F500 HQs | Revenue |
|---|---|---|
| Consumer Goods | 3 | $31B |
|
||
| Pharmaceuticals | 2 | $153B |
|
||
| Technology | 2 | $21B |
|
||
| Insurance | 2 | $20B |
|
||
| Healthcare | 2 | $19B |
|
||
| Financial Services | 1 | $70B |
|
||
Price history
+205.6% since first listed2 events — show timeline
- 2026-06-08 Coming Soon $195,000 BRIGHT MLS
- 1999-02-03 Sold (Public Records) $63,800 Public Records
Property tax history
-2.4%/yrLatest (2025): $1,884 · +5.2% YoY. Source: county tax records.
Cash-flow waterfall
monthlySold comps — $/sqft
last 12 mo · ≤1 miLoading sold comps…