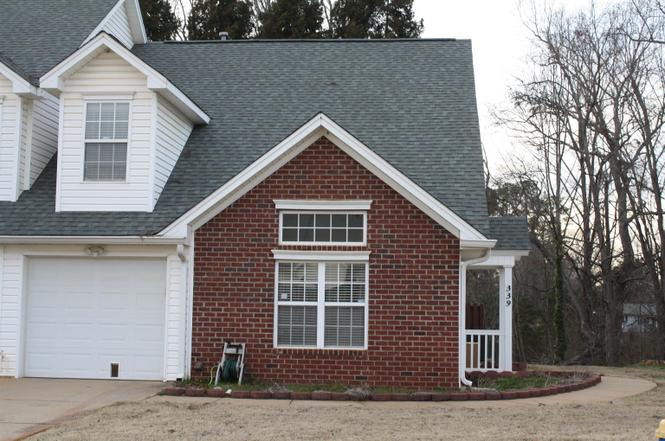
339 Stillwater Cir · Valley Falls, SC
Flood risk 1/10 · Minimal
- FEMA flood zone
- X (unshaded)
- Chance of flooding over 30 yrs
- 0.0%
- Est. flood insurance / yr
- $507 – $1,088
Fire risk 3/10 · Minor
- Est. fire insurance / yr
- $783 – $1,453
Heat risk 6/10 · Moderate
- Hot days now (above 104°F)
- 7 days/yr
- Hot days in 30 yrs
- 17 days/yr
Wind risk 2/10 · Minimal
- Chance of severe wind over 30 yrs
- 1.0%
Air-quality risk 4/10 · Minor
- Unhealthy air days now
- 4 days/yr
- Unhealthy air days in 30 yrs
- 4 days/yr
Risk factors via First Street. Map © Google.
Why this score? — see what drove the D grade
The composite is a weighted blend of 9 inputs, each scored 0–100. Each bar is that input's sub-score; the figure is the points it added to the 100-point composite (weight × sub-score).
- ARV discount +12.8/15.0
- Cash flow +11.7/30.0
- Schools +4.5/10.0
- Livability +3.5/5.0
- 1% rule +3.4/10.0
- DSCR +3.4/10.0
- Rent growth +2.7/5.0
- Condition / age +2.5/5.0
- Appreciation +0.0/10.0
$194,900
🖨 Deal sheet (PDF) 📄 Offer letter ✓ Due diligence
Listing remarks MLS
Looking for carefree living? This spacious 3 bedroom, 2.5 bath home is exactly what you are looking for! Exterior features include brick and vinyl siding, corner unit, and private rear deck. The interior has an open floor plan featuring an enormous den and dining area combination that opens to the roomy kitchen. The master bedroom is located on the main level and has a private bath. Upstairs features 2 nice size bedrooms and huge full bath. New paint, carpet, and appliances! Great opportunity! This is a Fannie Mae HomePath property. Call Skip Kirsch to learn about this wonderful HomePath property and to view today! * * * Up to a $1,000 Selling Agency bonus may be available on this property! Ask the Listing Agent. Eligibility restrictions apply. * * *
Key facts
- Private deck
- Eat in kitchen
- Updated flooring
Tags
Property features AI
Finance
- HOA & community: Homeowners association with a $165 monthly fee; Community pool
Exterior
- Parking: Attached garage (1 space)
- Security: Smoke detectors
- Utilities: Public water; Public sewer; Cable available
- Home design: Residential townhouse; Two levels; Slab foundation
- Construction: Brick veneer and vinyl siding; Built with slab foundation
- Exterior features: Deck; Porch; Storm doors; Level lot; Wooded lot
Interior
- Kitchen: Cooktop; Electric oven; Microwave; Dishwasher; Disposal; Refrigerator; Electric water heater
- Bedrooms: 1 bedroom on the main level
- Flooring: Carpet; Ceramic tile; Vinyl
- Bathrooms: 2 full bathrooms; 1 half bathroom; 2 bathrooms on the main level
- Heating & cooling: Central air; Ceiling fans; Electric heating; Forced air heating
- Interior features: Walk-in closets; Ceiling fans; Cathedral ceilings; Soaking tub; Open floorplan; Insulated windows; Window treatments; Gas log fireplace
- Laundry & utility: Washer hookup (main level); Electric dryer hookup (main level)
Neighborhood map
What this means for you Summary
Snapshot
- This is a 3-bed/2.5-bath townhouse listed at $195k.
Deal economics
- At list price, monthly cash flow is $-57 ($-683/yr) — negative.
- To cash-flow at today's rent, offer at most $185k (5.2% below list).
- To meet the 1% rule (rent ≥ 1% of price), the offer needs to be $163k (16.4% below list).
- Recommended offer: $163k (16.4% below list) — sets the bar for 1% rule.
- Cap rate 5.9% vs local median 3.9% in Valley Falls — top-decile yield for the area; either an underpriced asset or a hidden risk that comps aren't pricing in. Stress-test before assuming the spread holds.
Location & tenants
- Location reads 69/100 on livability (#72 in SC) — a middle-class / working-renter tenant base. Strengths: cost of living A+, housing A-; Watch: crime C-, amenities F, employment D-.
- Spartanburg 02 (suburban): math 49% / reading 56% proficiency, ranked #6 of 80 in SC (top 8%) — acceptable for families but not a draw, mixed tenant base, ~2y average lease.
- Zoned schools: James H. Hendrix Elementary (math 55% / reading 45%, grade D+, #163 of 597 statewide, top 28%, 694 students, 89% FRL); Boiling Springs Middle (math 39% / reading 50%, grade D, #52 of 229 statewide, top 23%, 1,068 students, 70% FRL); Boiling Springs High (math 62% / reading 88%, grade A-, #37 of 196 statewide, top 18%, 2,671 students, 60% FRL) — zoned schools average 73% FRL vs 44% district-wide (28 pts higher); higher-poverty schools than district average — tighter screening recommended.
- Market conditions: Rents flat; 461 active listings in the ZIP; 2 comparable units currently listed for rent nearby; 3,129 units permitted in Spartanburg County in 2024 (40 in 5+ unit buildings).
Forward outlook
- Local home prices are declining (-3.0%/yr); year-one equity from $1k of loan paydown is wiped out by about $6k of value loss. Plan a longer hold.
- Spartanburg County population projected at +18% by 2050 — long-run rental-demand tailwind backs the buy-and-hold thesis.
Negotiation context
- It's been on market 150 days — a 12% lower offer ($172k) is reasonable based on typical stale-listing flexibility.
- 3 sale attempts since 11y ago with the ask held roughly flat each time — persistent listings suggest the price (not the market) is what's stuck; bring a comps-based counter.
- Current owner paid $98k; list at $195k implies a 98% gain — meaningful room to come down on a strong offer.
Risks & watch-outs
- Climate carrying-cost: extreme-heat days projected 7→17/yr by 2055 (HVAC capex compounding) — expect insurance premiums to compound above CPI over the hold.
Questions for the listing agent
- What do current leases actually rent for vs. the listed asking? Can we see a recent rent roll and the last 12 months of T-12 income?
- It's been on market 150 days. Have you received any prior offers? Is the seller open to a 16% concession, seller financing, or rate buy-down credit?
- What does the HOA fee cover, when was the last increase, and are there any pending special assessments or reserve-fund shortfalls?
- Why hasn't it sold? Are there any deal-killer items the seller is aware of (foundation, flood, title, zoning, code violations)?
- Is there a deadline driving the sale (1031 exchange, divorce, estate, relocation)? That informs how much negotiation room exists.
- Schools are F-rated, which usually means shorter tenancies and higher turnover. Who's the typical renter profile here, and what's been the actual vacancy rate?
- The area grade is low — what's the realistic commute time and amenity access for the typical tenant pool here? Any planned neighborhood developments (good or bad) we should know about?
- What's the average days-on-market for RENTAL listings here right now (not sales)? A rising rental-DOM trend means longer vacancies and softer asking-rent achievability than the comps imply.
- What's the recent tenant-quality profile in this submarket — average credit score on applications, eviction rate, late-payment / NSF rate, and stable-employment percentage? A property-management company in the area should have these aggregated.
- How much new for-sale + rental construction is in the pipeline within 1–3 miles? Heavy new supply typically softens prices + rents 12–24 months out; constrained supply supports both.
Investment metrics
- 1% rule
- 0.84% ✗
- Cap rate
- 5.94%
- Cash-on-cash
- -1.25%
- DSCR
- 0.94
- GRM
- 10.0
CMA / ARV
- ARV (on-the-fly)
- $221,100
- Comps found
- 2
Show comp detail 2 sales within ~0.75 mi
| Address | Dist | Beds/Ba | Sqft | Sold | Price | $/sf | Match |
|---|---|---|---|---|---|---|---|
| 382 Still Water Cir | 0.05mi | 3/2.5 | 1,690 (+2%) | 11mo | $211,000 | $125 | 85 |
| 388 Still Water Cir | 0.06mi | 3/2.5 | 1,581 (-4%) | 10mo | $212,000 | $134 | 82 |
Match score weights: distance 35% · size 25% · config 20% · recency 20%. Top-matched comps best support the ARV.
Projected returns pro-forma
-3.0% appreciation · 0.69% rent growth · sell at horizon
- IRR
- -21.0%
- Equity multiple
- 0.29×
- Total profit
- $-38,885
- Equity at exit
- $29,060
- IRR
- -20.7%
- Equity multiple
- 0.03×
- Total profit
- $-52,938
- Equity at exit
- $16,851
Cash invested: $54,572 (down + closing). Projections, not guarantees.
Landlord ↔ Tenant lean methodology
- Overall (STATE)
- 90 Strongly Landlord-Friendly
- State South Carolina
- 90 Strongly Landlord-Friendly · R+6
- County
- — inherits STATE
- City
- — inherits STATE
ZIP-level market 29316
- Home prices YoY
- -18.9%
- Rents YoY
- 0.7%
- Active inventory
- 461
- Price-to-rent
- 10.0×
Monthly cashflow live
- Estimated rent
- $1,630 medium interval (Pro) →
- Mortgage (P&I)
- −$1,022
- Tax from tax record
- −$76 /mo · $912/yr
- Insurance
- −$81
- HOA
- −$165
- Lot rent
- −$0
- Vacancy / Maint / Mgmt
- −$342
- Net cashflow
- $-57
Break-even live
Sensitivity live
| Price | -10% $53 | -5% $-2 | +0% $-57 | +5% $-112 | +10% $-167 |
|---|---|---|---|---|---|
| Rent | -10% $-186 | -5% $-121 | +0% $-57 | +5% $7 | +10% $72 |
| Rate | -1.0pp $41 | -0.5pp $-7 | base $-57 | +0.5pp $-107 | +1.0pp $-159 |
UW: 25.0% down · 7.5% · 30yr · 1.5% tax · 5.0% vac · 8.0% maint · 8.0% mgmt
Financing live
Cash to close
- Down payment
- $48,725
- Closing costs
- $5,847
- Reserves months
- —
- Total cash needed
- —
Loan-product check · same deal, 3 products live
Conventional
25% down · 7.5% · 30yr
- Down + closing
- —
- Monthly P&I
- —
- Monthly cashflow
- —
- DSCR
- —
- Eligible?
- —
Personal DTI + credit; lowest rate.
DSCR
20% down · 8.5% · 30yr
- Down + closing
- —
- Monthly P&I
- —
- Monthly cashflow
- —
- DSCR
- —
- Eligible?
- —
No personal income docs; deal must DSCR.
Hard money
10% down · 12.0% · 12mo
- Down + closing
- —
- Monthly P&I
- —
- Monthly cashflow
- —
- DSCR
- —
- Eligible?
- —
Short-term bridge; refi at stabilization.
Rent comps 2 comps
| Address | Beds | Baths | Sqft | Rent | $/sqft | DOM | Units | Dist |
|---|---|---|---|---|---|---|---|---|
| 1200 College Pointe Ln Spartanburg, SC | 1.0–4.0 | 1.0–4.0 | 1293 | $1,117 | $0.86 | 23d | 10 | 1.28mi |
| 1000 Pinegate Dr Spartanburg, SC | 1.0–4.0 | 1.0–4.0 | 1097 | $1,475 | $1.34 | 23d | 10 | 1.45mi |
HOA detail
- Monthly dues
- $165 · $1,980/yr
Listing history 25 events
-
2026-06-21days on market $194,900 Active 150 DOM
-
2026-06-18days on market $194,900 Active 147 DOM
-
2026-06-17days on market $194,900 Active 146 DOM
-
2026-06-16days on market $194,900 Active 145 DOM
-
2026-06-15days on market $194,900 Active 144 DOM
-
2026-06-14days on market $194,900 Active 142 DOM
-
2026-06-13days on market $194,900 Active 141 DOM
-
2026-06-10days on market $194,900 Active 139 DOM
-
2026-06-09days on market $194,900 Active 138 DOM
-
2026-06-08days on market $194,900 Active 137 DOM
-
2026-06-07days on market $194,900 Active 136 DOM
-
2026-06-05pricedays on market $194,900 Active 133 DOM
-
2026-06-03price $195,900 Active 131 DOM
-
2026-06-02days on market $204,900 Active 131 DOM
-
2026-06-01days on market $204,900 Active 130 DOM
-
2026-05-31days on market $204,900 Active 129 DOM
-
2026-05-30days on market $204,900 Active 128 DOM
-
2026-01-21$204,900 Active
-
2025-06-03price $210,000
-
2025-03-26price $214,900
-
2025-03-06price $220,000
-
2025-02-24$224,900 Active
-
2015-11-24soldstatus $98,500 768-char remark
Show marketing remark (768 chars)
Looking for carefree living? This spacious 3 bedroom, 2.5 bath home is exactly what you are looking for! Exterior features include brick and vinyl siding, corner unit, and private rear deck. The interior has an open floor plan featuring an enormous den and dining area combination that opens to the roomy kitchen. The master bedroom is located on the main level and has a private bath. Upstairs features 2 nice size bedrooms and huge full bath. New paint, carpet, and appliances! Great opportunity! This is a Fannie Mae HomePath property. Call Skip Kirsch to learn about this wonderful HomePath property and to view today! * * * Up to a $1,000 Selling Agency bonus may be available on this property! Ask the Listing Agent. Eligibility restrictions apply. * * *
-
2015-08-03$99,900 768-char remark
Show marketing remark (768 chars)
Looking for carefree living? This spacious 3 bedroom, 2.5 bath home is exactly what you are looking for! Exterior features include brick and vinyl siding, corner unit, and private rear deck. The interior has an open floor plan featuring an enormous den and dining area combination that opens to the roomy kitchen. The master bedroom is located on the main level and has a private bath. Upstairs features 2 nice size bedrooms and huge full bath. New paint, carpet, and appliances! Great opportunity! This is a Fannie Mae HomePath property. Call Skip Kirsch to learn about this wonderful HomePath property and to view today! * * * Up to a $1,000 Selling Agency bonus may be available on this property! Ask the Listing Agent. Eligibility restrictions apply. * * *
-
2004-12-01soldstatus $128,799
ⓘ Source: listings_history table (triggers on properties + properties_extension) + one-shot
backfill from property_details.listing_events for pre-trigger history.
Tax reassessment forecast SC · Resets to sale price
- Current annual tax
- $912 · $76/mo
- Projected year-2 tax
- $1,111 · $93/mo
- Expected delta
- +$199/yr (+$17/mo · 21.8%)
ⓘ Screening estimate from a state-policy table — verify with the county assessor before closing.
Climate risk First Street
- Flood 1/10 Low FEMA zone X (unshaded) · 0% chance over 30 yrs
- Wildfire 3/10 Moderate
- Heat 6/10 Major 7 d/yr ≥104°F today · 17 d/yr by 30 yrs out
- Wind 2/10 Low 100% chance of damaging wind over 30 yrs
- Air quality 4/10 Moderate 4 unhealthy d/yr today · 4 by 30 yrs out
Nearby sold comps map
Loading sold comps map…
Walkable amenities ~0.75 mi
Loading nearby amenities…
Taxation est. · year 1
- Rental income
- $19,555
- − Mortgage interest
- −$10,917
- − Property taxes
- −$912
- − Insurance
- −$974
- − Repairs & maintenance
- −$1,564
- − Management
- −$1,564
- − HOA
- −$1,980
- − Depreciation
- −$5,670
- Taxable loss
- −$4,027
- Est. tax savings @ 24.0%
- +$967
- After-tax cash flow
- $284/yr
For passive investors: Depreciation is non-cash, so a rental often shows a tax loss while cash-flowing — sheltering income. Rental losses are passive: they offset passive income freely, and up to $25,000/yr can offset ordinary (W-2) income if you actively participate and your MAGI is under $100k (phasing out to $0 by $150k); unused losses carry forward. On sale, claimed depreciation is recaptured at up to 25%, and gains may owe capital-gains tax (a 1031 exchange can defer both). Figures are a year-1 estimate at your 24.0% rate — not tax advice; consult a CPA.
Schools (NCES district)
- District
- Spartanburg 02
- NCES district ID
- 4503510
- Math proficiency
- 49% ▼ -7.00%
- Reading proficiency
- 56% ▲ 2.00%
- Median HH income
- $49,591
- Composite
- 44.79/100
- National rank
- #2742
- State rank
- #6 of 80 in SC
Livability — Valley Falls
- Score
- 69/100
- State rank
- #72
- US rank
- #8644
Category grades
Schools grade is shown separately in the Schools card above.
Census & demographics
- Census place
- Valley Falls, SC
- County
- Spartanburg County · 258,607 people
- City population
- 28,009
- Metro
- Spartanburg, SC
- Population (ZIP)
- 33,104
- Household income
- $74,735
- Rent vs Own
- Severe rent burden
- 524.0
Population outlook (Spartanburg County) Hauer SSP2
- Today (2025)
- 325,495 people
- By 2030
- 338,800 · +4.1%
- By 2040
- 363,471 · +11.7%
- By 2050
- 384,156 · +18.0%
- By 2075
- 430,137 · +32.1%
- By 2100
- 442,733 · +36.0%
Race, ethnicity, and origin ACS 2023
- Neighborhood character
- Predominantly White (72%)
- Race & ethnicity
- White 72% Black 15% Two or more races 6% Hispanic / Latino 5% Asian 4%
- Hispanic origin (detail)
- Mexican 3%
- Common ancestry
- Slovak 3% Subsaharan African 3% Scotch-Irish 2%
- Foreign-born
- 11% · Canada, Jamaica
- Languages at home
- 84% English-only · Russian/Polish/Slavic 7% Spanish 5% Other Asian/Pacific 2%
Political lean MEDSL · Spartanburg
- 2024 margin
- Solid R (+33.6) · D 32.6% · R 66.2% · Other 1.2%
- 2008→2024 swing
- -12.0pp toward R · 2008: -21.6pp · 2024: -33.6pp
- All cycles
- 2024: R+33.6 2020: R+27.3 2016: R+30.0 2012: R+23.1 2008: R+21.6
Not yet ingested
- Civics
- —
Market trends
- HPI YoY
- ▼ -51.42%
- Current HPI
- 220.8438
- Rent YoY
- ▲ 0.69%
- Metro
- Spartanburg, SC
- State GDP YoY
- ▲ 4.51%
- F500 in state
- 2
Industry mix (Fortune 500 HQ in SC)
| Industry | F500 HQs | Revenue |
|---|---|---|
| Packaging | 1 | $7B |
|
||
Price history
+59.1% since first listed8 events — show timeline
- 2026-01-21 Listed $204,900 SPMLS
- 2025-06-03 Price Changed $210,000 SPMLS
- 2025-03-26 Price Changed $214,900 SPMLS
- 2025-03-06 Price Changed $220,000 SPMLS
- 2025-02-24 Listed $224,900 SPMLS
- 2015-11-24 Sold (MLS) $98,500 SPMLS
- 2015-08-03 Listed $99,900 SPMLS
- 2004-12-01 Sold (Public Records) $128,799 Public Records
Property tax history
-1.4%/yrLatest (2025): $912 · +1.1% YoY. Source: county tax records.
Cash-flow waterfall
monthlySold comps — $/sqft
last 12 mo · ≤1 miLoading sold comps…