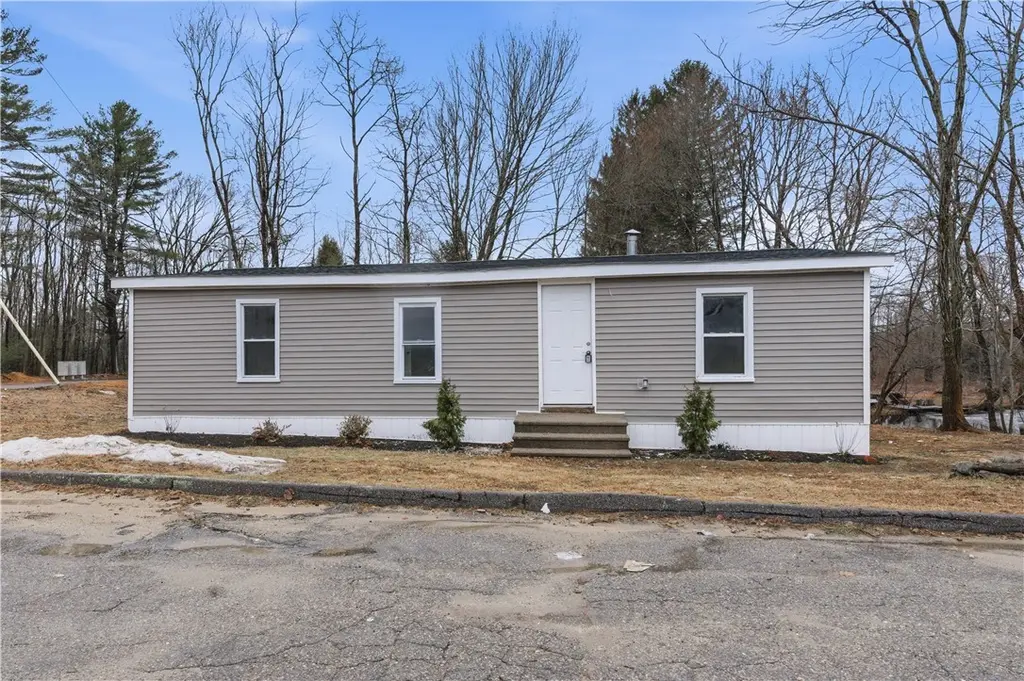
61 Everson Dr · Chepachet, RI
Flood risk No data
- FEMA flood zone
- —
- Chance of flooding over 30 yrs
- —
- Est. flood insurance / yr
- —
Fire risk No data
- Est. fire insurance / yr
- —
Heat risk 4/10 · Minor
- Hot days now (above threshold)
- 7 days/yr
- Hot days in 30 yrs
- 15 days/yr
Wind risk No data
- Chance of severe wind over 30 yrs
- —
Air-quality risk 2/10 · Minimal
- Unhealthy air days now
- 2 days/yr
- Unhealthy air days in 30 yrs
- 2 days/yr
Risk factors via First Street. Map © Google.
Why this score? — see what drove the A- grade
The composite is a weighted blend of 9 inputs, each scored 0–100. Each bar is that input's sub-score; the figure is the points it added to the 100-point composite (weight × sub-score).
- Cash flow +29.4/30.0
- 1% rule +10.0/10.0
- DSCR +10.0/10.0
- Appreciation +10.0/10.0
- ARV discount +7.5/15.0
- Schools +5.1/10.0
- Livability +3.8/5.0
- Rent growth +2.5/5.0
- Condition / age +2.5/5.0
$159,900
🖨 Deal sheet (PDF) 📄 Offer letter ✓ Due diligence
Listing remarks MLS
Best location in the Park! Cozy 3 bed double wide mobile home is located on corner lot overlooking pond. Includes eat-in kitchen with pond view, large livingroom with wood burning stove, laundry area, storage shed, . Affordable country living.
Key facts
- Fully renovated
- New plumbing
- New siding
Tags
Property features AI
Finance
- HOA & community: Monthly association fee of $535; Property has a land lease
Exterior
- Parking: No garage; 2 off-street parking spaces
- Utilities: Circuit breaker electric service; Well water; Septic sewer
- Home design: Single-story home
- Construction: Vinyl siding
Interior
- Kitchen: Electric water heater
- Bedrooms: Total rooms: 6
- Flooring: Laminate
- Bathrooms: 1 full bathroom
- Heating & cooling: Forced air heating; Oil heating
- Interior features: Laminate flooring; Crawl space basement
Neighborhood map
What this means for you Summary
Snapshot
- This is a 3-bed/1.0-bath manufactured listed at $160k.
Deal economics
- At list price, monthly cash flow is $565 ($7k/yr) — positive.
- The deal already cash-flows at list — no discount required.
- Meets the 1% rule at list price ($3k rent vs $160k).
- Recommended offer: $150k (6.0% below list) — sets the bar for market timing.
- Cap rate 10.5% vs local median 3.1% in Chepachet — top-decile yield for the area; either an underpriced asset or a hidden risk that comps aren't pricing in. Stress-test before assuming the spread holds.
Location & tenants
- Location reads 75/100 on livability (#9 in RI, #4,347 nationally) — a middle-class / working-renter tenant base. Strengths: crime A+, employment A+, housing A+; Watch: amenities F, commute F.
- Glocester (rural): math 46% / reading 66% proficiency, ranked #4 of 39 in RI (top 10%) — acceptable for families but not a draw, mixed tenant base, ~2y average lease; only 12% free/reduced lunch — higher-income household profile.
- Zoned schools: Fogarty Memorial (math 47% / reading 67%, grade C+, #19 of 167 statewide, top 12%, 336 students, 9% FRL); Ponaganset Middle School (math 27% / reading 42%, grade F, #17 of 57 statewide, top 30%, 426 students, 17% FRL); Ponaganset High School (math 31% / reading 62%, grade D-, #15 of 58 statewide, top 26%, 921 students, 14% FRL) — zoned schools at 13% FRL track the district average.
- Market conditions: 40 active listings in the ZIP; 776 units permitted in Providence County in 2024 (229 in 5+ unit buildings).
Forward outlook
- In year one you build about $17k of equity ($1k loan paydown + $16k appreciation (10.0% local appreciation)).
- Providence County population projected at +5% by 2050 — modest demand growth; plan on rents tracking national, not racing it.
- At projected returns (10.0% appreciation + 3.0% rent growth), your $45k cash investment doubles in ~2 years — after that, you're playing with house money.
- By year 3, paydown + projected appreciation supports a ~$43k cash-out refi (75% LTV) — recoverable capital for the next deal without selling this one.
Negotiation context
- It's been on market 65 days — a 6% lower offer ($150k) is reasonable based on typical stale-listing flexibility.
- 3 sale attempts since 15y ago; this cycle's ask has dropped $15k (9%) from the opening price — seller is motivated, your offer sets the floor, not the list.
- Current owner paid $50k; list at $160k implies a 220% gain — meaningful room to come down on a strong offer.
Risks & watch-outs
- Watch-outs: HOA is 21% of rent.
Questions for the listing agent
- It's been on market 65 days. Have you received any prior offers? Is the seller open to a 6% concession, seller financing, or rate buy-down credit?
- Built in 1977 — when were the roof, HVAC, electrical panel, plumbing, and water heater last replaced?
- What does the HOA fee cover, when was the last increase, and are there any pending special assessments or reserve-fund shortfalls?
- Why hasn't it sold? Are there any deal-killer items the seller is aware of (foundation, flood, title, zoning, code violations)?
- Is there a deadline driving the sale (1031 exchange, divorce, estate, relocation)? That informs how much negotiation room exists.
- What's the average days-on-market for RENTAL listings here right now (not sales)? A rising rental-DOM trend means longer vacancies and softer asking-rent achievability than the comps imply.
- What's the recent tenant-quality profile in this submarket — average credit score on applications, eviction rate, late-payment / NSF rate, and stable-employment percentage? A property-management company in the area should have these aggregated.
- How much new for-sale + rental construction is in the pipeline within 1–3 miles? Heavy new supply typically softens prices + rents 12–24 months out; constrained supply supports both.
Investment metrics
- 1% rule
- 1.62% ✓
- Cap rate
- 10.53%
- Cash-on-cash
- 15.15%
- DSCR
- 1.67
- GRM
- 5.1
CMA / ARV
No comps found within radius.
Projected returns pro-forma
10.0% appreciation · 3.0% rent growth · sell at horizon
- IRR
- 35.5%
- Equity multiple
- 3.76×
- Total profit
- $123,349
- Equity at exit
- $144,051
- IRR
- 30.6%
- Equity multiple
- 8.49×
- Total profit
- $335,478
- Equity at exit
- $310,651
Cash invested: $44,772 (down + closing). Projections, not guarantees.
Landlord ↔ Tenant lean methodology
- Overall (STATE)
- 31 Tenant-Leaning
- State Rhode Island
- 31 Tenant-Leaning · D+8
- County
- — inherits STATE
- City
- — inherits STATE
ZIP-level market 02814
- Home prices YoY
- 3.0%
- Active inventory
- 40
- Price-to-rent
- 5.1×
Monthly cashflow live
- Estimated rent
- $2,593 medium interval (Pro) →
- Mortgage (P&I)
- −$839
- Tax from tax record
- −$43 /mo · $519/yr
- Insurance
- −$67
- HOA
- −$535
- Vacancy / Maint / Mgmt
- −$545
- Net cashflow
- $565
Break-even live
Sensitivity live
| Price | -10% $656 | -5% $610 | +0% $565 | +5% $520 | +10% $475 |
|---|---|---|---|---|---|
| Rent | -10% $360 | -5% $463 | +0% $565 | +5% $668 | +10% $770 |
| Rate | -1.0pp $646 | -0.5pp $606 | base $565 | +0.5pp $524 | +1.0pp $482 |
UW: 25.0% down · 7.5% · 30yr · 1.5% tax · 5.0% vac · 8.0% maint · 8.0% mgmt
Financing live
Cash to close
- Down payment
- $39,975
- Closing costs
- $4,797
- Reserves months
- —
- Total cash needed
- —
Loan-product check · same deal, 3 products live
Conventional
25% down · 7.5% · 30yr
- Down + closing
- —
- Monthly P&I
- —
- Monthly cashflow
- —
- DSCR
- —
- Eligible?
- —
Personal DTI + credit; lowest rate.
DSCR
20% down · 8.5% · 30yr
- Down + closing
- —
- Monthly P&I
- —
- Monthly cashflow
- —
- DSCR
- —
- Eligible?
- —
No personal income docs; deal must DSCR.
Hard money
10% down · 12.0% · 12mo
- Down + closing
- —
- Monthly P&I
- —
- Monthly cashflow
- —
- DSCR
- —
- Eligible?
- —
Short-term bridge; refi at stabilization.
HOA detail
- Monthly dues
- $535 · $6,420/yr
Listing history 20 events
-
2026-06-21days on market $159,900 Active 65 DOM
-
2026-06-18days on market $159,900 Active 62 DOM
-
2026-06-17days on market $159,900 Active 61 DOM
-
2026-06-16days on market $159,900 Active 60 DOM
-
2026-06-15days on market $159,900 Active 59 DOM
-
2026-06-13days on market $159,900 Active 57 DOM
-
2026-06-13statusdays on market $159,900 Active 56 DOM
-
2026-05-11status Pending
-
2026-05-07price $159,900
-
2026-04-24price $160,000
-
2026-04-07price $172,500
-
2026-03-17$175,000 Active
-
2025-09-16soldstatus $50,000
-
2013-12-19price $24,500 243-char remark
Show marketing remark (243 chars)
Best location in the Park! Cozy 3 bed double wide mobile home is located on corner lot overlooking pond. Includes eat-in kitchen with pond view, large livingroom with wood burning stove, laundry area, storage shed, . Affordable country living.
-
2013-01-31soldstatus $15,500 110-char remark
Show marketing remark (110 chars)
NICE 3 BED MOBILE HOME ON CORNER LOT OVERLOOKING A POND. WOODSTOVE, SHED AND LAUNDRY AREA. QUIET NEIGHBORHOOD.
-
2013-01-10historical 110-char remark
Show marketing remark (110 chars)
NICE 3 BED MOBILE HOME ON CORNER LOT OVERLOOKING A POND. WOODSTOVE, SHED AND LAUNDRY AREA. QUIET NEIGHBORHOOD.
-
2012-09-10$24,500 110-char remark
Show marketing remark (110 chars)
NICE 3 BED MOBILE HOME ON CORNER LOT OVERLOOKING A POND. WOODSTOVE, SHED AND LAUNDRY AREA. QUIET NEIGHBORHOOD.
-
2011-11-18soldstatus $24,500 243-char remark
Show marketing remark (243 chars)
Best location in the Park! Cozy 3 bed double wide mobile home is located on corner lot overlooking pond. Includes eat-in kitchen with pond view, large livingroom with wood burning stove, laundry area, storage shed, . Affordable country living.
-
2011-10-20historical 243-char remark
Show marketing remark (243 chars)
Best location in the Park! Cozy 3 bed double wide mobile home is located on corner lot overlooking pond. Includes eat-in kitchen with pond view, large livingroom with wood burning stove, laundry area, storage shed, . Affordable country living.
-
2011-02-13$49,500 243-char remark
Show marketing remark (243 chars)
Best location in the Park! Cozy 3 bed double wide mobile home is located on corner lot overlooking pond. Includes eat-in kitchen with pond view, large livingroom with wood burning stove, laundry area, storage shed, . Affordable country living.
ⓘ Source: listings_history table (triggers on properties + properties_extension) + one-shot
backfill from property_details.listing_events for pre-trigger history.
Tax reassessment forecast RI · Partial reset (capped growth)
- Current annual tax
- $519 · $43/mo
- Projected year-2 tax
- $1,563 · $130/mo
- Expected delta
- +$1,044/yr (+$87/mo · 201.1%)
ⓘ Screening estimate from a state-policy table — verify with the county assessor before closing.
Climate risk First Street
- Heat 4/10 Moderate
- Air quality 2/10 Low 2 unhealthy d/yr today · 2 by 30 yrs out
Nearby sold comps map
Loading sold comps map…
Walkable amenities ~0.75 mi
Loading nearby amenities…
Taxation est. · year 1
- Rental income
- $31,116
- − Mortgage interest
- −$8,957
- − Property taxes
- −$519
- − Insurance
- −$800
- − Repairs & maintenance
- −$2,489
- − Management
- −$2,489
- − HOA
- −$6,420
- − Depreciation
- −$4,652
- Taxable income
- $4,791
- Est. tax owed @ 24.0%
- −$1,150
- After-tax cash flow
- $5,631/yr
For passive investors: Depreciation is non-cash, so a rental often shows a tax loss while cash-flowing — sheltering income. Rental losses are passive: they offset passive income freely, and up to $25,000/yr can offset ordinary (W-2) income if you actively participate and your MAGI is under $100k (phasing out to $0 by $150k); unused losses carry forward. On sale, claimed depreciation is recaptured at up to 25%, and gains may owe capital-gains tax (a 1031 exchange can defer both). Figures are a year-1 estimate at your 24.0% rate — not tax advice; consult a CPA.
Schools (NCES district)
- District
- Glocester
- NCES district ID
- 4400450
- Math proficiency
- 46% ▼ -9.00%
- Reading proficiency
- 66% ▲ 2.00%
- Median HH income
- $81,483
- Composite
- 50.69/100
- National rank
- #1822
- State rank
- #4 of 39 in RI
Livability — Chepachet
- Score
- 75/100
- State rank
- #9
- US rank
- #4347
Category grades
Schools grade is shown separately in the Schools card above.
Census & demographics
- Census place
- Chepachet, RI
- Population (ZIP)
- 7,421
Population outlook (Providence County) Hauer SSP2
- Today (2025)
- 653,469 people
- By 2030
- 660,819 · +1.1%
- By 2040
- 672,747 · +3.0%
- By 2050
- 683,741 · +4.6%
- By 2075
- 720,435 · +10.2%
- By 2100
- 741,582 · +13.5%
Race, ethnicity, and origin ACS 2023
- Neighborhood character
- Predominantly White (95%)
- Race & ethnicity
- White 95% Two or more races 3% Hispanic / Latino 1%
- Common ancestry
- Lithuanian 13% Romanian 5% Russian 5%
- Foreign-born
- 2% · Canada
- Languages at home
- 97% English-only · Spanish 1% Other Indo-European 1%
Political lean MEDSL · Providence
- 2024 margin
- D (+14.4) · D 56.1% · R 41.7% · Other 2.2%
- 2008→2024 swing
- -20.0pp toward R · 2008: 34.4pp · 2024: 14.4pp
- All cycles
- 2024: D+14.4 2020: D+22.9 2016: D+21.2 2012: D+34.9 2008: D+34.4
Not yet ingested
- Civics
- —
Market trends
- HPI YoY
- ▲ 11.23%
- Current HPI
- 383.6236
- Rent YoY
- —
- Metro
- —
- State GDP YoY
- ▲ 2.25%
- F500 in state
- 10
Industry mix (Fortune 500 HQ in RI)
| Industry | F500 HQs | Revenue |
|---|---|---|
| Healthcare | 1 | $373B |
|
||
| Food Distribution | 1 | $31B |
|
||
| Aerospace / Defense | 1 | $14B |
|
||
| Financial Services | 1 | $8B |
|
||
| Consumer Goods | 1 | $4B |
|
||
Price history
+223.0% since first listed13 events — show timeline
- 2026-05-11 Pending — RIS
- 2026-05-07 Price Changed $159,900 RIS
- 2026-04-24 Price Changed $160,000 RIS
- 2026-04-07 Price Changed $172,500 RIS
- 2026-03-17 Listed $175,000 RIS
- 2025-09-16 Sold (Public Records) $50,000 Public Records
- 2013-12-19 Price Changed $24,500 RIS
- 2013-01-31 Sold (MLS) $15,500 RIS
- 2013-01-10 Listing Removed — RIS
- 2012-09-10 Listed $24,500 RIS
- 2011-11-18 Sold (MLS) $24,500 RIS
- 2011-10-20 Listing Removed — RIS
- 2011-02-13 Listed $49,500 RIS
Property tax history
-0.9%/yrLatest (2025): $519 · +2.8% YoY. Source: county tax records.
Cash-flow waterfall
monthlySold comps — $/sqft
last 12 mo · ≤1 miLoading sold comps…