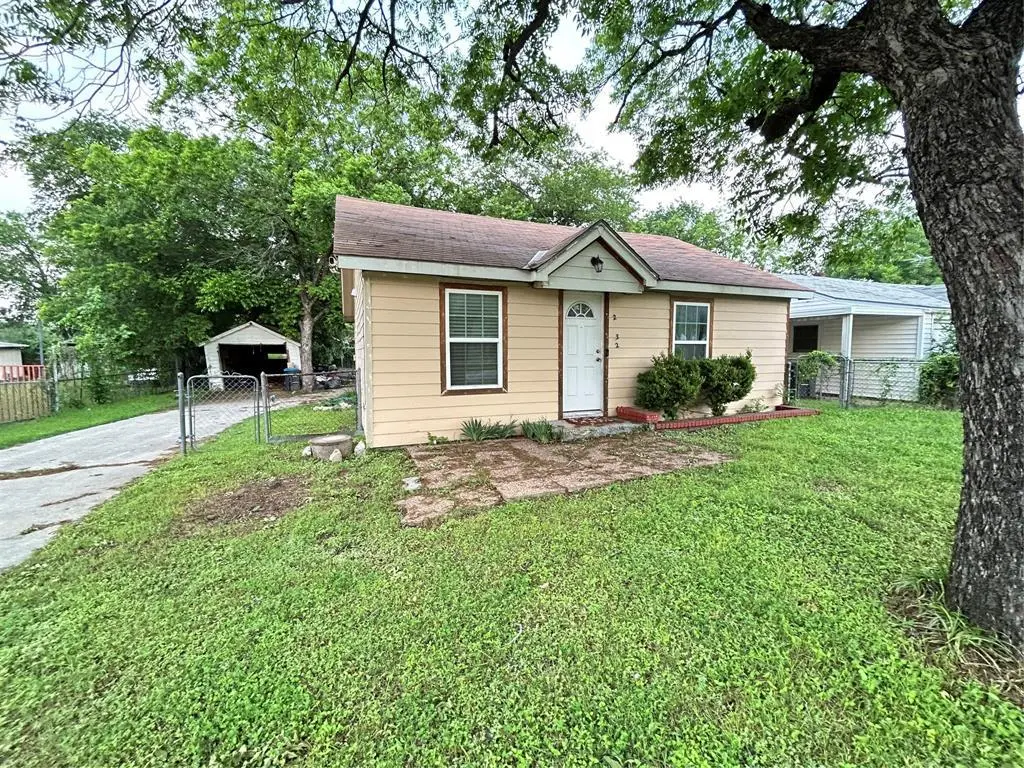
2132 N Sylvania Ave · Fort Worth, TX
Flood risk 1/10 · Minimal
- FEMA flood zone
- X (unshaded)
- Chance of flooding over 30 yrs
- 0.0%
- Est. flood insurance / yr
- $507 – $1,088
Fire risk 1/10 · Minimal
- Est. fire insurance / yr
- $1,222 – $2,270
Heat risk 7/10 · Major
- Hot days now (above 110°F)
- 7 days/yr
- Hot days in 30 yrs
- 22 days/yr
Wind risk 4/10 · Minor
- Chance of severe wind over 30 yrs
- 24.0%
Air-quality risk 4/10 · Minor
- Unhealthy air days now
- 4 days/yr
- Unhealthy air days in 30 yrs
- 5 days/yr
Risk factors via First Street. Map © Google.
Why this score? — see what drove the C grade
The composite is a weighted blend of 9 inputs, each scored 0–100. Each bar is that input's sub-score; the figure is the points it added to the 100-point composite (weight × sub-score).
- Cash flow +19.4/30.0
- ARV discount +15.0/15.0
- 1% rule +6.4/10.0
- DSCR +6.1/10.0
- Livability +4.0/5.0
- Rent growth +2.6/5.0
- Condition / age +2.5/5.0
- Schools +2.0/10.0
- Appreciation +0.0/10.0
$159,000
🖨 Deal sheet (PDF) 📄 Offer letter ✓ Due diligence
Listing remarks MLS
Cute Updated 3 Bedroom home priced to sell fast! Home has been totally updated and features include fresh paint inside and out, carpet and ceramic tile, updated bathroom, recently installed water heater, decorative light fixtures and much more. Backyard has a 1 car garage, storage building and plenty of yard! A must see!
Key facts
- 8,581 sq ft lot
- Garage
- Built 1946
Property features AI
Finance
- Other: Listing is Active Under Contract; Possession at closing/funding; Exclusions: Personal property, TV
- Financial info: Listing terms include Cash, Conventional, FHA-203K, VA Loan; Special listing conditions: Standard
- HOA & community: No association
Exterior
- Parking: Covered parking (1 covered space); Driveway; Garage faces front; 1-car garage
- Security: No specific security features provided
- Utilities: Cable available; City water; City sewer; Municipal utility district: No
- Home design: Single family residence; One story; Residential property; Subdivision: Hightower Sub
- Construction: Built in 1946; Composition roof; Pillar/post/pier foundation
- Exterior features: Gutters; Exterior lighting; Exterior storage; Chain link fencing; Lot under 0.5 acre
Interior
- Kitchen: Disposal
- Bedrooms: 3 bedrooms (primary bedroom on main level)
- Flooring: No flooring details provided
- Bathrooms: 1 full bathroom
- Heating & cooling: Central heating; Central electric cooling; Ceiling fan(s)
- Interior features: Cable TV available; 1 living area; 1 dining area; Room count: 2
- Laundry & utility: No specific laundry details provided
Neighborhood map
What this means for you Summary
Snapshot
- This is a 3-bed/1.0-bath single-family listed at $159k.
Deal economics
- At list price, monthly cash flow is $178 ($2k/yr) — positive.
- The deal already cash-flows at list — no discount required.
- Meets the 1% rule at list price ($2k rent vs $159k).
- Recommended offer: $154k (3.0% below list) — sets the bar for market timing.
- Cap rate 7.6% vs local median 3.9% in Fort Worth — top-decile yield for the area; either an underpriced asset or a hidden risk that comps aren't pricing in. Stress-test before assuming the spread holds.
Location & tenants
- Location reads 80/100 on livability (#49 in TX, #1,954 nationally) — a professional / high-income tenant draw. Strengths: amenities A+, cost of living A+, housing A+; Watch: crime F.
- Fort Worth ISD (urban): math 18% / reading 28% proficiency, ranked #742 of 826 in TX (top 90%) — low school quality limits family demand, transient renter base, plan for 1-2y turnover; 73% free/reduced lunch — lower-income household profile, screen leases tightly.
- Zoned schools: Springdale El (math 27% / reading 27%, grade F, #2,791 of 4,322 statewide, top 68%, 407 students, 93% FRL) — zoned schools average 93% FRL vs 73% district-wide (21 pts higher); higher-poverty schools than district average — tighter screening recommended.
- Market conditions: Rents flat; 71 active listings in the ZIP; 13 comparable units currently listed for rent nearby; rentals leasing fast (median 7d on market — plan ~1-2 weeks tenant-placement turnaround); 18,938 units permitted in Tarrant County in 2024 (8,336 in 5+ unit buildings).
- This rent runs 36% of the median local income ($60k/yr) — at the standard rent-burdened threshold; future hikes will face affordability resistance.
Forward outlook
- Local home prices are declining (-3.0%/yr); year-one equity from $1k of loan paydown is wiped out by about $5k of value loss. Plan a longer hold.
- Tarrant County population projected at +41% by 2050 — long-run rental-demand tailwind backs the buy-and-hold thesis.
Negotiation context
- It's been on market 48 days — a 3% lower offer ($154k) is reasonable based on typical stale-listing flexibility.
- 5 sale attempts since 18y ago with the ask held roughly flat each time — persistent listings suggest the price (not the market) is what's stuck; bring a comps-based counter.
Risks & watch-outs
- Watch-outs: property tax is 2.6% of price; built in 1946 — expect roof / HVAC / electrical / plumbing capex.
- Climate carrying-cost: extreme-heat days projected 7→22/yr by 2055 (HVAC capex compounding) — expect insurance premiums to compound above CPI over the hold.
Questions for the listing agent
- It's been on market 48 days. Have you received any prior offers? Is the seller open to a 3% concession, seller financing, or rate buy-down credit?
- Built in 1946 — when were the roof, HVAC, electrical panel, plumbing, and water heater last replaced?
- Property tax is high relative to price — has the assessment been appealed recently, and will the sale trigger a re-assessment?
- Is there a deadline driving the sale (1031 exchange, divorce, estate, relocation)? That informs how much negotiation room exists.
- Schools are D-rated, which usually means shorter tenancies and higher turnover. Who's the typical renter profile here, and what's been the actual vacancy rate?
- Crime grade is F in this area — have there been break-ins, vandalism, or insurance claims at this property in the last 3 years? What carrier currently insures it and at what premium?
- What's the average days-on-market for RENTAL listings here right now (not sales)? A rising rental-DOM trend means longer vacancies and softer asking-rent achievability than the comps imply.
- What's the recent tenant-quality profile in this submarket — average credit score on applications, eviction rate, late-payment / NSF rate, and stable-employment percentage? A property-management company in the area should have these aggregated.
- How much new for-sale + rental construction is in the pipeline within 1–3 miles? Heavy new supply typically softens prices + rents 12–24 months out; constrained supply supports both.
Investment metrics
- 1% rule
- 1.14% ✓
- Cap rate
- 7.64%
- Cash-on-cash
- 4.80%
- DSCR
- 1.21
- GRM
- 7.3
CMA / ARV
- ARV (median comp)
- $253,672
- List price
- $159,000
- Delta
- -37.32%
- Verdict
- UNDERPRICED
- Comps
- 20 within 1.0 mi
Show comp detail 12 sales within ~0.75 mi
| Address | Dist | Beds/Ba | Sqft | Sold | Price | $/sf | Match |
|---|---|---|---|---|---|---|---|
| 2117 Grace Ave | 0.06mi | 2/1.0 (-1) | 1,006 (-6%) | 0mo | $199,900 | $199 | 83 |
| 2012 Watauga Ct E | 0.23mi | 3/2.0 | 1,097 (+3%) | 7mo | $260,000 | $237 | 74 |
| 2617 Marigold Ave | 0.55mi | 3/1.5 | 1,050 (-1%) | 2mo | $249,950 | $238 | 69 |
| 2020 Watauga Ct W | 0.34mi | 2/1.0 (-1) | 988 (-7%) | 9mo | $250,000 | $253 | 60 |
| 2520 Lotus Ave | 0.19mi | 2/1.0 (-1) | 1,159 (+9%) | 14mo | $275,000 | $237 | 60 |
| 2333 N Chandler Dr E | 0.39mi | 3/1.0 | 1,200 (+13%) | 2mo | $189,000 | $158 | 59 |
| 2708 Marigold Ave | 0.58mi | 3/1.0 | 1,144 (+8%) | 8mo | $125,000 | $109 | 54 |
| 2574 High Crest Ave | 0.66mi | 4/1.0 (+1) | 1,104 (+4%) | 14mo | $225,000 | $204 | 47 |
| 3308 29th St | 0.64mi | 3/1.0 | 1,188 (+12%) | 6mo | $249,900 | $210 | 46 |
| 2309 Primrose Ave | 0.66mi | 3/1.0 | 916 (-14%) | 0mo | $160,000 | $175 | 46 |
| 2072 W Lotus Ave | 0.62mi | 2/1.0 (-1) | 1,012 (-5%) | 15mo | $305,000 | $301 | 45 |
| 2725 Yucca Ave | 0.68mi | 3/2.0 | 1,177 (+11%) | 3mo | $220,000 | $187 | 44 |
Match score weights: distance 35% · size 25% · config 20% · recency 20%. Top-matched comps best support the ARV.
Projected returns pro-forma
-3.0% appreciation · 0.45% rent growth · sell at horizon
- IRR
- -12.0%
- Equity multiple
- 0.58×
- Total profit
- $-18,831
- Equity at exit
- $23,707
- IRR
- -7.7%
- Equity multiple
- 0.57×
- Total profit
- $-18,949
- Equity at exit
- $13,747
Cash invested: $44,520 (down + closing). Projections, not guarantees.
Landlord ↔ Tenant lean methodology
- Overall (STATE)
- 87 Strongly Landlord-Friendly
- State Texas
- 87 Strongly Landlord-Friendly · R+5
- County
- — inherits STATE
- City
- — inherits STATE
ZIP-level market 76111
- Home prices YoY
- -19.2%
- Rents YoY
- 0.5%
- Active inventory
- 71
- Price-to-rent
- 7.3×
Monthly cashflow live
- Estimated rent
- $1,808 high interval (Pro) →
- Mortgage (P&I)
- −$834
- Tax from tax record
- −$350 /mo · $4,203/yr
- Insurance
- −$66
- HOA
- −$0
- Vacancy / Maint / Mgmt
- −$380
- Net cashflow
- $178
Break-even live
Sensitivity live
| Price | -10% $268 | -5% $223 | +0% $178 | +5% $133 | +10% $88 |
|---|---|---|---|---|---|
| Rent | -10% $35 | -5% $107 | +0% $178 | +5% $249 | +10% $321 |
| Rate | -1.0pp $258 | -0.5pp $218 | base $178 | +0.5pp $137 | +1.0pp $95 |
UW: 25.0% down · 7.5% · 30yr · 1.5% tax · 5.0% vac · 8.0% maint · 8.0% mgmt
Financing live
Cash to close
- Down payment
- $39,750
- Closing costs
- $4,770
- Reserves months
- —
- Total cash needed
- —
Loan-product check · same deal, 3 products live
Conventional
25% down · 7.5% · 30yr
- Down + closing
- —
- Monthly P&I
- —
- Monthly cashflow
- —
- DSCR
- —
- Eligible?
- —
Personal DTI + credit; lowest rate.
DSCR
20% down · 8.5% · 30yr
- Down + closing
- —
- Monthly P&I
- —
- Monthly cashflow
- —
- DSCR
- —
- Eligible?
- —
No personal income docs; deal must DSCR.
Hard money
10% down · 12.0% · 12mo
- Down + closing
- —
- Monthly P&I
- —
- Monthly cashflow
- —
- DSCR
- —
- Eligible?
- —
Short-term bridge; refi at stabilization.
Rent comps 13 comps
| Address | Beds | Baths | Sqft | Rent | $/sqft | DOM | Units | Dist |
|---|---|---|---|---|---|---|---|---|
| 2021 Bluebonnet Dr Fort Worth, TX | 3.0 | 2.0 | 1270 | $1,850 | $1.46 | 3d | 1 | 0.44mi |
| 2021 Bluebonnet Dr Fort Worth, TX | 3.0 | 2.0 | 1270 | $1,849 | $1.46 | 25d | 1 | 0.44mi |
| 2211 Barbell Ln Fort Worth, TX | 2.0 | 1.0 | 718 | $1,295 | $1.80 | 44d | 1 | 0.54mi |
| 2104 W Lotus Ave Fort Worth, TX | 2.0 | 1.0 | 1039 | $1,600 | $1.54 | 7d | 1 | 0.61mi |
| 3417 Clary Ave Fort Worth, TX | 2.0 | 1.0 | 1057 | $1,595 | $1.51 | 14d | 1 | 0.97mi |
| 1852 E Northside Dr Fort Worth, TX | 2.0 | 2.0 | 1083 | $2,055 | $1.90 | 19d | 1 | 1.07mi |
| 1852 E Northside Dr Unit 1889 Fort Worth, TX | 2.0 | 2.0 | 1169 | $1,747 | $1.49 | 3d | 1 | 1.09mi |
| 999 Scenic Hill Dr Fort Worth, TX | 2.0 | 1.0–2.5 | 1077 | $2,896 | $2.69 | 2d | 19 | 1.15mi |
| 2204 Salisbury Ave Fort Worth, TX | 2.0 | 1.0 | 910 | $1,400 | $1.54 | 25d | 1 | 1.22mi |
| 2901 Race St Fort Worth, TX | 1.0–2.0 | 1.0–2.0 | 869 | $1,300 | $1.50 | 7d | 1 | 1.22mi |
| 2413 Race St Fort Worth, TX | 2.0 | 1.0–2.0 | 849 | $1,949 | $2.30 | 2d | 13 | 1.23mi |
| 2900 Race St Fort Worth, TX | 2.0 | 1.0–2.0 | 959 | $1,899 | $1.98 | 2d | 21 | 1.28mi |
| 336 Oakhurst Scenic Dr Fort Worth, TX | 2.0 | 1.0–2.0 | 939 | $2,085 | $2.22 | 2d | 29 | 1.48mi |
Listing history 29 events
-
2026-06-17status $159,000 Pending 48 DOM
-
2026-06-17days on market $159,000 Active Option Contract 48 DOM
-
2026-06-16days on market $159,000 Active Option Contract 47 DOM
-
2026-06-15days on market $159,000 Active Option Contract 46 DOM
-
2026-06-13days on market $159,000 Active Option Contract 44 DOM
-
2026-06-09days on market $159,000 Active Option Contract 40 DOM
-
2026-06-08days on market $159,000 Active Option Contract 39 DOM
-
2026-06-07statusdays on market $159,000 Active Option Contract 38 DOM
-
2026-06-04days on market $159,000 Active 35 DOM
-
2026-06-03days on market $159,000 Active 34 DOM
-
2026-06-02days on market $159,000 Active 33 DOM
-
2026-06-01days on market $159,000 Active 32 DOM
-
2026-05-31days on market $159,000 Active 31 DOM
-
2026-04-30$159,000 Active 496-char remark
-
2011-10-25soldstatus
-
2011-10-21soldstatus Closed 322-char remark
Show marketing remark (322 chars)
Cute Updated 3 Bedroom home priced to sell fast! Home has been totally updated and features include fresh paint inside and out, carpet and ceramic tile, updated bathroom, recently installed water heater, decorative light fixtures and much more. Backyard has a 1 car garage, storage building and plenty of yard! A must see!
-
2011-09-23status Pending 322-char remark
Show marketing remark (322 chars)
Cute Updated 3 Bedroom home priced to sell fast! Home has been totally updated and features include fresh paint inside and out, carpet and ceramic tile, updated bathroom, recently installed water heater, decorative light fixtures and much more. Backyard has a 1 car garage, storage building and plenty of yard! A must see!
-
2011-09-13historical Active Option Contract 322-char remark
Show marketing remark (322 chars)
Cute Updated 3 Bedroom home priced to sell fast! Home has been totally updated and features include fresh paint inside and out, carpet and ceramic tile, updated bathroom, recently installed water heater, decorative light fixtures and much more. Backyard has a 1 car garage, storage building and plenty of yard! A must see!
-
2011-06-13price $65,000 322-char remark
Show marketing remark (322 chars)
Cute Updated 3 Bedroom home priced to sell fast! Home has been totally updated and features include fresh paint inside and out, carpet and ceramic tile, updated bathroom, recently installed water heater, decorative light fixtures and much more. Backyard has a 1 car garage, storage building and plenty of yard! A must see!
-
2011-04-26$67,000 Active 322-char remark
Show marketing remark (322 chars)
Cute Updated 3 Bedroom home priced to sell fast! Home has been totally updated and features include fresh paint inside and out, carpet and ceramic tile, updated bathroom, recently installed water heater, decorative light fixtures and much more. Backyard has a 1 car garage, storage building and plenty of yard! A must see!
-
2011-04-09historical
-
2011-02-18price $67,000
-
2010-12-08$69,900 Active
-
2010-12-03historical
-
2010-08-31$75,000 Active
-
2009-06-02soldstatus
-
2009-05-17historical
-
2008-11-20$34,900
-
1985-01-01soldstatus
ⓘ Source: listings_history table (triggers on properties + properties_extension) + one-shot
backfill from property_details.listing_events for pre-trigger history.
Tax reassessment forecast TX · Resets to sale price
- Current annual tax
- $4,203 · $350/mo
- Projected year-2 tax
- $4,203 · $350/mo
- Expected delta
- $0/yr ($0/mo · 0.0%)
ⓘ Screening estimate from a state-policy table — verify with the county assessor before closing.
Climate risk First Street
- Flood 1/10 Low FEMA zone X (unshaded) · 0% chance over 30 yrs
- Wildfire 1/10 Low
- Heat 7/10 Severe 7 d/yr ≥110°F today · 22 d/yr by 30 yrs out
- Wind 4/10 Moderate 24% chance of damaging wind over 30 yrs
- Air quality 4/10 Moderate 4 unhealthy d/yr today · 5 by 30 yrs out
Nearby sold comps map
Loading sold comps map…
Walkable amenities ~0.75 mi
Loading nearby amenities…
Taxation est. · year 1
- Rental income
- $21,696
- − Mortgage interest
- −$8,906
- − Property taxes
- −$4,203
- − Insurance
- −$795
- − Repairs & maintenance
- −$1,736
- − Management
- −$1,736
- − Depreciation
- −$4,625
- Taxable loss
- −$305
- Est. tax savings @ 24.0%
- +$73
- After-tax cash flow
- $2,209/yr
For passive investors: Depreciation is non-cash, so a rental often shows a tax loss while cash-flowing — sheltering income. Rental losses are passive: they offset passive income freely, and up to $25,000/yr can offset ordinary (W-2) income if you actively participate and your MAGI is under $100k (phasing out to $0 by $150k); unused losses carry forward. On sale, claimed depreciation is recaptured at up to 25%, and gains may owe capital-gains tax (a 1031 exchange can defer both). Figures are a year-1 estimate at your 24.0% rate — not tax advice; consult a CPA.
Schools (NCES district)
- District
- Fort Worth ISD
- NCES district ID
- 4819700
- Math proficiency
- 18% ▼ -16.00%
- Reading proficiency
- 28% ▼ -6.00%
- Median HH income
- $42,109
- Composite
- 19.61/100
- National rank
- #8753
- State rank
- #742 of 826 in TX
Livability — Fort Worth
- Score
- 80/100
- State rank
- #49
- US rank
- #1954
Category grades
Schools grade is shown separately in the Schools card above.
Census & demographics
- Census place
- Fort Worth, TX
- County
- Tarrant County · 2,033,669 people
- City population
- 911,619
- Metro
- Dallas-Fort Worth-Arlington, TX
- Population (ZIP)
- 20,989
- Household income
- $60,194
- Rent vs Own
- Severe rent burden
- 616.0
Population outlook (Tarrant County) Hauer SSP2
- Today (2025)
- 2,380,417 people
- By 2030
- 2,578,900 · +8.3%
- By 2040
- 2,974,995 · +25.0%
- By 2050
- 3,350,489 · +40.8%
- By 2075
- 4,216,909 · +77.2%
- By 2100
- 4,741,527 · +99.2%
Race, ethnicity, and origin ACS 2023
- Neighborhood character
- Predominantly Hispanic (67%)
- Race & ethnicity
- Hispanic / Latino 67% White 24% Two or more races 24% Black 4% Asian 3% Native American 1%
- Hispanic origin (detail)
- Mexican 62%
- Common ancestry
- Slovak 1%
- Foreign-born
- 25% · Canada, Vietnam
- Languages at home
- 45% English-only · Spanish 52% Other Asian/Pacific 1% Vietnamese 1%
Political lean MEDSL · Tarrant
- 2024 margin
- Lean R (+5.1) · D 46.7% · R 51.9% · Other 1.4%
- 2008→2024 swing
- +6.6pp toward D · 2008: -11.7pp · 2024: -5.1pp
- All cycles
- 2024: R+5.1 2020: D+0.2 2016: R+8.7 2012: R+15.7 2008: R+11.7
Not yet ingested
- Civics
- —
Market trends
- HPI YoY
- ▼ -74.75%
- Current HPI
- 315.1072
- Rent YoY
- ▲ 0.45%
- Metro
- Dallas-Fort Worth-Arlington, TX
- State GDP YoY
- ▲ 3.95%
- F500 in state
- 110
Industry mix (Fortune 500 HQ in TX)
| Industry | F500 HQs | Revenue |
|---|---|---|
| Energy | 16 | $1,198B |
|
||
| Technology | 5 | $198B |
|
||
| Engineering / Construction | 4 | $72B |
|
||
| Energy Services | 3 | $60B |
|
||
| Utilities | 3 | $41B |
|
||
| Healthcare | 2 | $330B |
|
||
Price history
+355.6% since first listed18 events — show timeline
- 2026-06-17 Pending — NTREIS
- 2026-06-04 Contingent — NTREIS
- 2026-04-30 Listed $159,000 NTREIS
- 2011-10-25 Sold (Public Records) — Public Records
- 2011-10-21 Sold (MLS) — NTREIS
- 2011-09-23 Pending — NTREIS
- 2011-09-13 Contingent — NTREIS
- 2011-06-13 Price Changed $65,000 NTREIS
- 2011-04-26 Listed $67,000 NTREIS
- 2011-04-09 Listing Removed — NTREIS
- 2011-02-18 Price Changed $67,000 NTREIS
- 2010-12-08 Listed $69,900 NTREIS
- 2010-12-03 Listing Removed — NTREIS
- 2010-08-31 Listed $75,000 NTREIS
- 2009-06-02 Sold (MLS) — NTREIS
- 2009-05-17 Listing Removed — NTREIS
- 2008-11-20 Listed $34,900 NTREIS
- 1985-01-01 Sold (Public Records) — Public Records
Property tax history
+7.9%/yrLatest (2025): $4,203 · -2.4% YoY. Source: county tax records.
Cash-flow waterfall
monthlySold comps — $/sqft
last 12 mo · ≤1 miLoading sold comps…